Week - 4
EV BATCH - 17
1 . Implement control logic of a “washing machine” using Stateflow as per given sequence:
- If the power supply is available, the system gets activated
- If the Water supply is not available, stop the process & indicate through LED
- Soaking time should be 200s followed by Washing time of 100s.
- Then rinsing happens for next 20s & dryer runs for 50s
After all the processes have completed turn on the finished LED
AIM : Implement control logic of a “washing machine” using Stateflow as per given sequence:
BLOCKS USED :
- Chart box
- Constant
- Display
- Lamp
Simulation model :
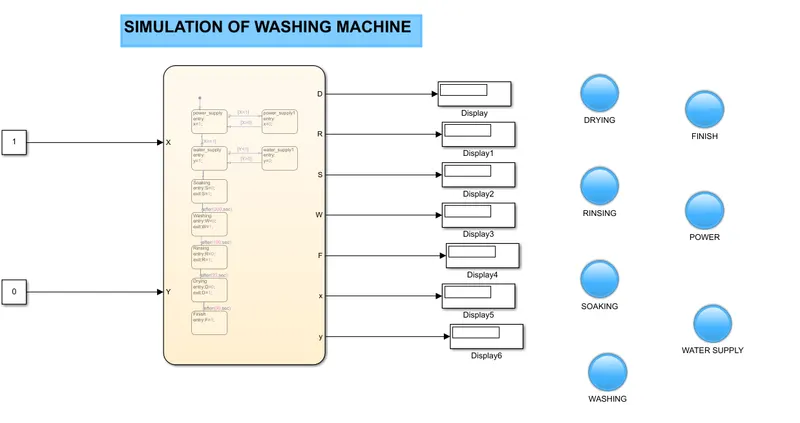
EXPLANATION :
- First open the matlab and click on the simulink then we get the simulink blank model.
- And click on the library select the chart block . Then double click on the chart block we go to inside the chart block .
- Now take the blocks we want 9 blocks and give the connections as shown in the below figure.
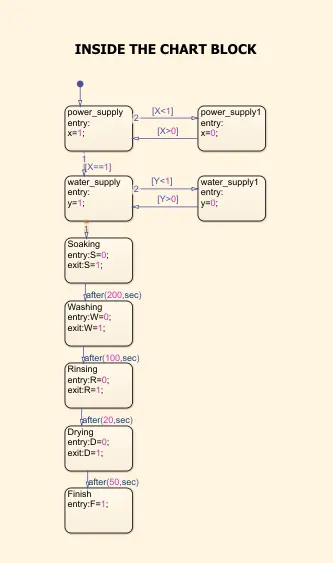
- And now give the names and give the conditions as shown in figure above .and then save the model .
- Next go the modeling shown in above the model and select the symboles spane now get the symboles page on left side of the model . it like shown in the figure below .
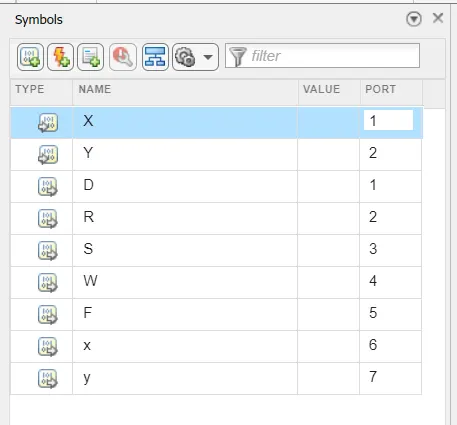
- Now select the input and outputs in the above figure . Here we give X & Y as inputs and remaining variables as ouputs .
- Now we get out of the chart block after that we can see full blank model with two inputs and 7 ouputs .
- Next go the library and select the required blockes i.e., constant, dispaly and lamp . In this we want two constants , 7 displays and 7 lamps .
- Now connect the two constants to inputs of X & Y and then connect the dispalys to the ouputs . And then gives the naming the lamps and connect the lamps to the all respective displays . It is like as shown the figure below .
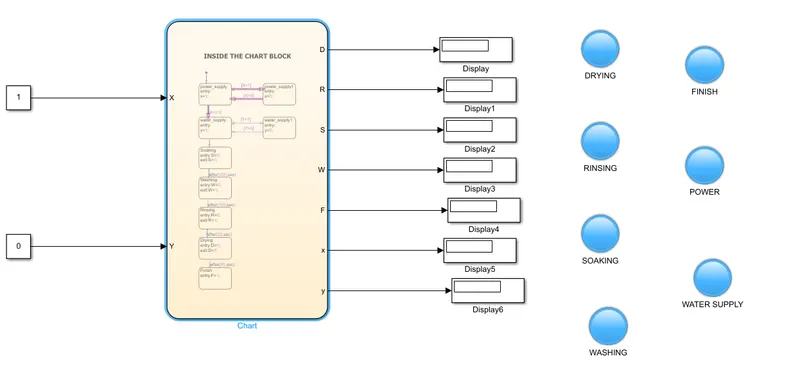
Now click on the water supply lamp and change the colour as your wish and then change the stop time as 700 and run the simulation .
Conditions :
1 . If the power supply is available, the system gets activated
Here we give the constant 2 as value of 1 and run the simulation we can see tha system will activated . 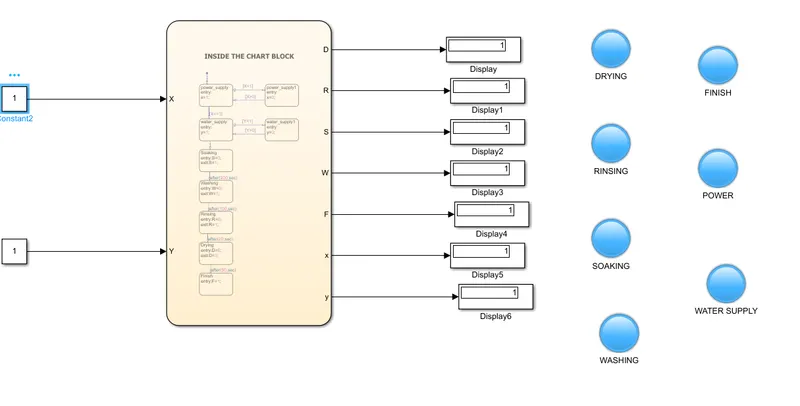
2 . If the Water supply is not available, stop the process & indicate through LED
Here we give constant 1 as value of 0 and then run the simulation we can see the whole system process was stop and water supply will golw . 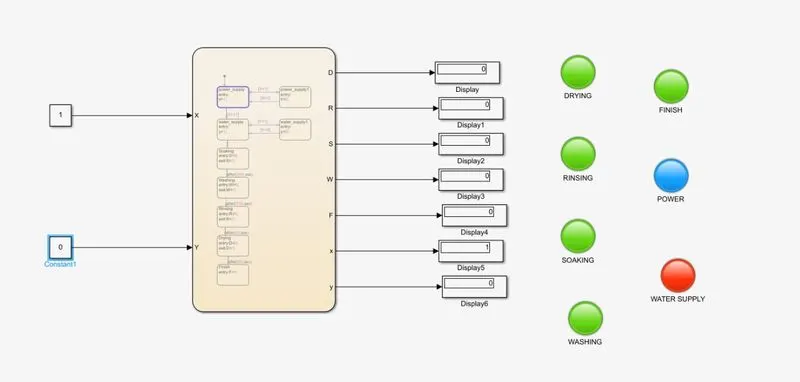
3 . Here we give the Soaking time should be 200s followed by Washing time of 100s.
4 . And then rinsing happens for next 20s & dryer runs for 50s.
Conclusion : Here the implement of logic of washing machine is completed and here we can see all the given conditions are satisfied .
.............................................................................................................................................................................................................................................................................................
2 . Make a Simulink chart for the “Gear shift” logic as per below conditions:
Speed Range(kmph) Gear
0 to 15 1
16 to 25 2
26 to 40 3
41 to 60 4
Above 61 5
Give speed input while the simulation is running & display the gear number.
AIM : Make a simulink chart for a "Gear shift" logic and satisfy the give conditions and aslo give the speed input while the simulation is running and display the gear number.
BLOCKS USED :
- Chart
- Constant
- Slider
- Display
SIMULATION MODEL :
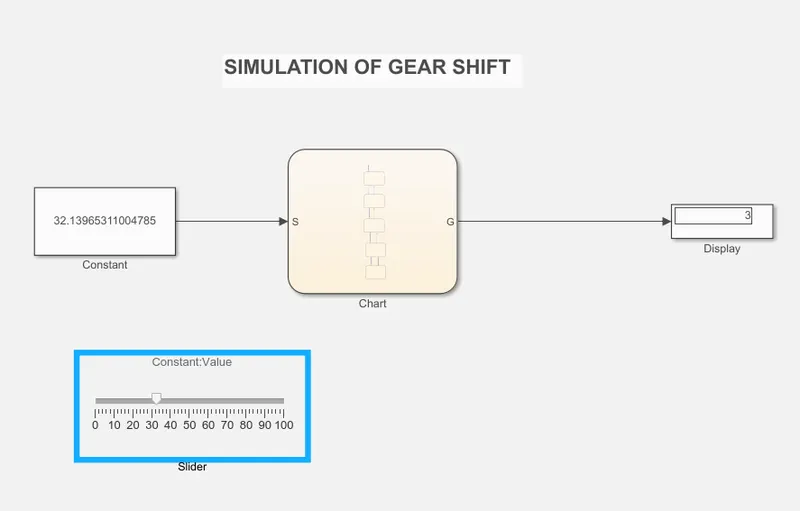
EXPLANATION :
1 . First open the matlab and click on the simulink then we get the simulink blank model .
2 . Now go to the library select the chart block then double click on the chart block and then we go the inside of the chart block.
3 . Now take the chart . In this we want 5 chart and then give the nameing and give the conditons and connections as shown in the below figure.
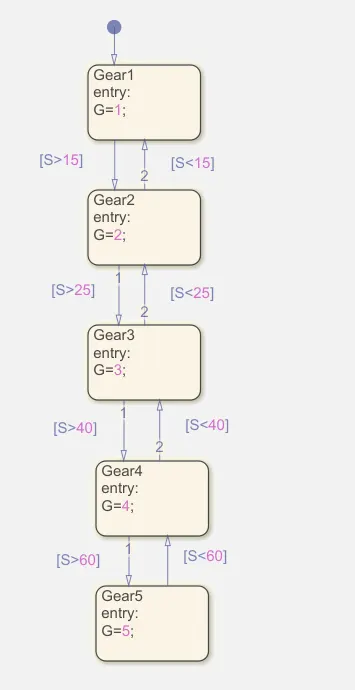
4 . Now go the modeling shown the above of model blank and select the symboles spane . Then we get the symboles page and we give the Sas input and G as output as shown in the below figure .
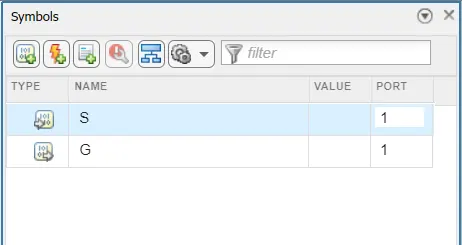
5 . Now come out of the chart and we can see the full form of chart model with one input S and one output W .
6 . Next click on the library and select the required blockes i.e., constant , slider , and display . Now connect the constant to the input S of chart and connect the display to the output W of the chart and connect the slider to the constant as shown in the simulation model .
7 . Now vary values in the slider block and click on the run and we can see the results in the display .
CONDITIONS :
1 . IF THE SPEED RANGE IS BETWEEN 0 TO 15 (Kmph) THEN THE GEAR SHIFT WILL BE THE 1 .
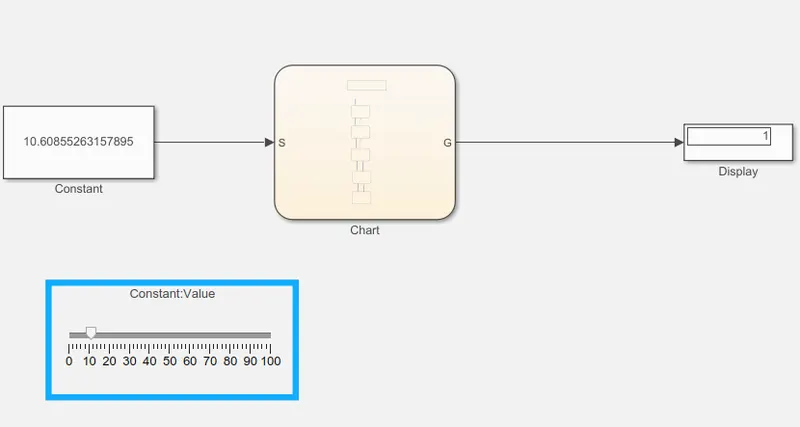
2 . IF THE SPEED RANGE IS BETWEEN THE 16 TO 25 THEN THE GEAR SHIFT WILL BE 2 .
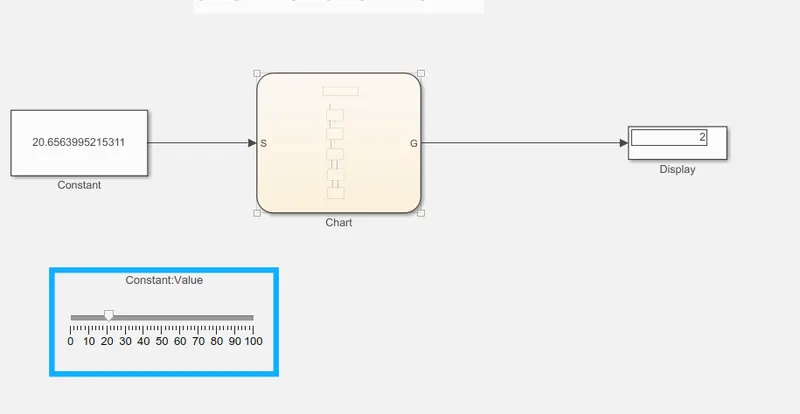
3 . IF THE SPEED RANGE IS BETWEEN 26 TO 40 (Kmph) THEN THE GEAR SHIFT WILL BE 3 .
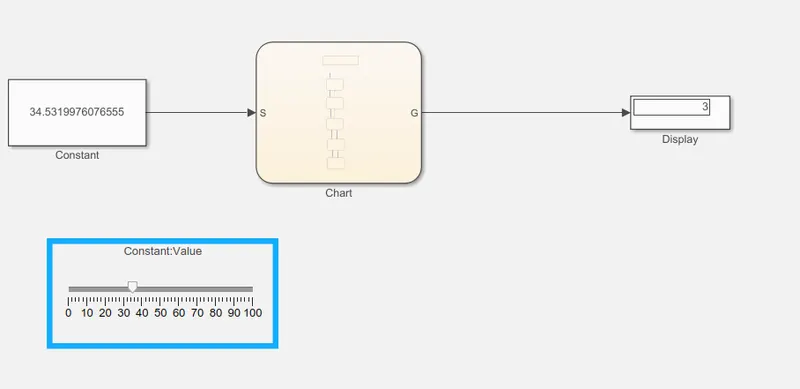
4 . IF THE SPEED RANGE S BETWEEN 41 TO 60 (Kmph) THEN THE GEAR SHIFT WILL BE 4 .
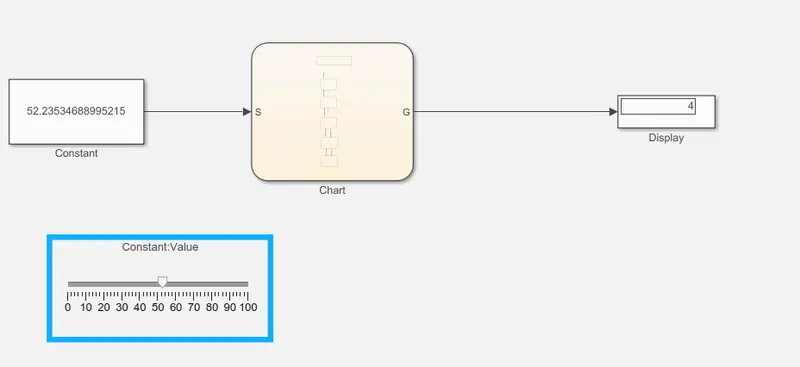
5 . IF THE SPEED RANGE ABOVE 61 THEN THE GEAR SHIFT WILL BE 5 .
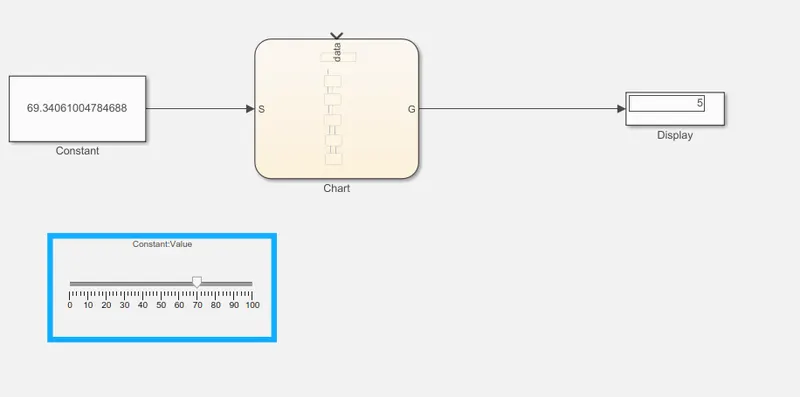
CONCLUSION : Here we make a simulink chart for the gear shift as followed by given 5 conditions are satisfied .