Week - 4
1.WASHING MACHINE
DESCRIPTION: The below image (fig 1.1) depicts the system logic of a washing machine. First of all created a chart under the given input conditions,;
- If the power supply is available, the system gets activated.
- If the water supply is not available, stop the process and indicates through LED.
- Soaking time should be 200 sec, followed by washing time of 100sec.
- Then rinsing happens for nexxt 20 sec and dryer runs for 50 sec.
After giving the conditions assign the variables in symbols pane,as; Power_supply and water_supply as the input data and power,water,soak,rinse,wash,dryer and finished as ouput datas. When both power supply and water supply is given 'value=1', the washing machine starts operate, and if the water supply is not provided then it stops process. During its normal operation, soaking time is 200s followed by washing time of 100s and rinsing for 20s and sent to dryer to dry for 50s and finish the process. Constant blocks are used to give power supply and water supply, which are controlled by rocker switches. Display blocks and lamps are used to indicate the results.
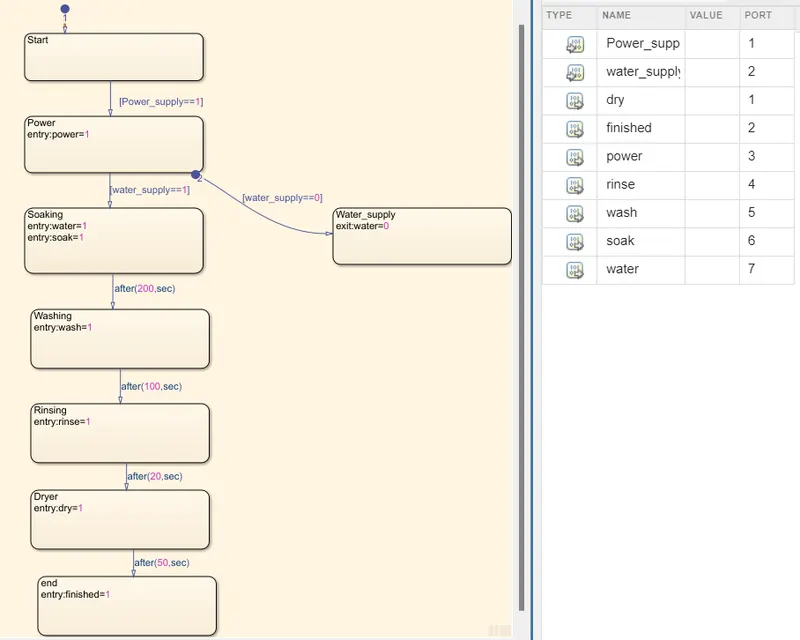
Fig 1.1 System logic
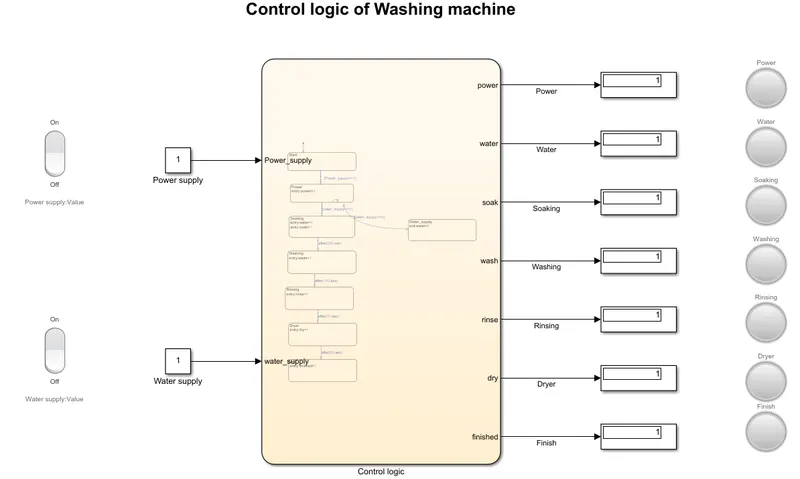
Fig 1.2
There are certain conditions asked to solve in the question.
Condition 1: When Water supply is OFF
In this condition, we provide only Power supply by switching ON the power supply switch, and the Water supply switch kepted in OFF state. The result is as shown in the figure(fig 1.3) below.
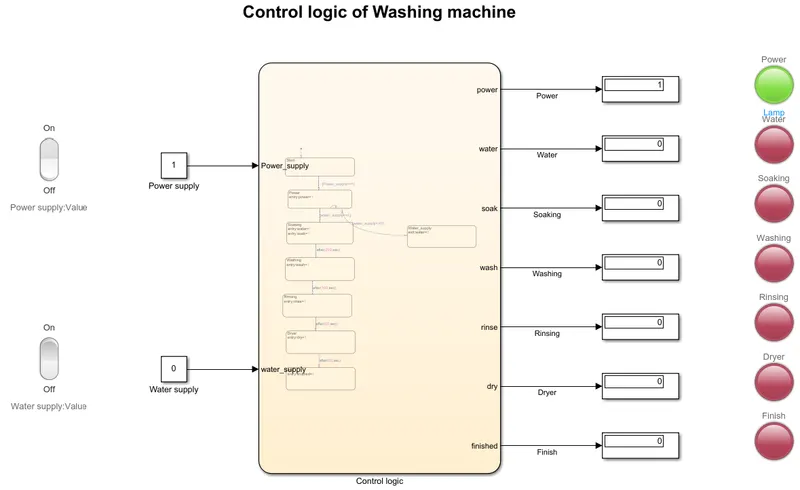
Fig 1.3
From the above figure it is clear that only the indicator of Power is showing Green, the indiactor of all other including water is showing Red. So, it is clear that if water supply is not given all process will stop and LED indicator is used to indicate the state.
Condition 2: When water supply is ON
Here we are providing Power supply as well as Water supply at stimulation time of 400s. And the ouput is as shown in fig 1.5
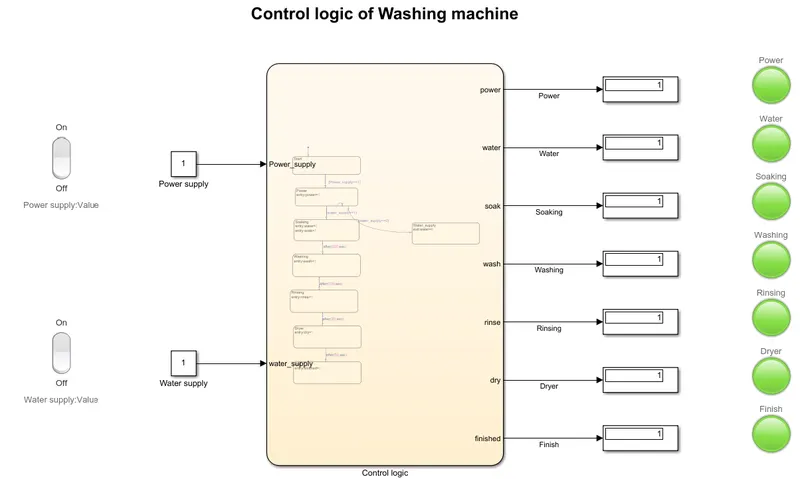
Fig 1.5
We can see from the abive figure that, all the process have been executed such as soaking for time of 200s, washing(time of 100s), rinsing(time of 20s), drying(for time 50s) and finally showing the process have completed indiacating by the Indicator Finish showing Green.
RESULT: The stimulation of Washing machine using state flow is done and the result is achieved.
3. GEAR SHIFT
AIM: To make a chart for the Gear shift logic.
DESCRIPTION: Given conditions;
Speed Range(Km/hr) Gear
0 - 15 1
16 - 25 2
26 - 40 3
41 - 60 4
Above 61 5
The below fig 2.1 depicts the simulink chart of above conditions. The above conditions for gear shifting is enterd in the diagram, and speed is assigned as input and te output is assigned to value. A constant block of value 1 and a slider block are used to give the input values. The slider gain block is used to vary the speed and display block will show the gear shift in the output (fig2.2). A lamp is also connected to Gear chart, which will indicate the gear value by changing the colour accordiing to the gear values. Here gear shift occurs in both forward shift as well as reverse shift according to the control logic.
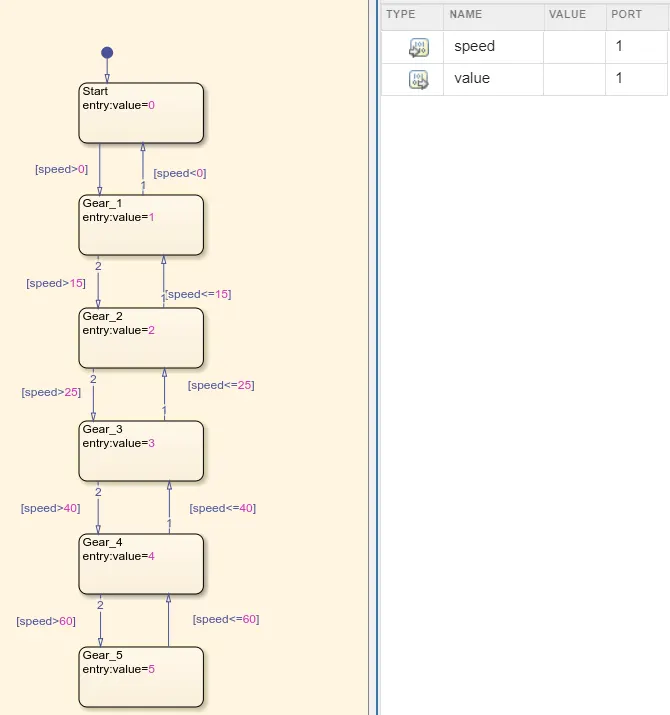
Fig 2.1 Chart diagram
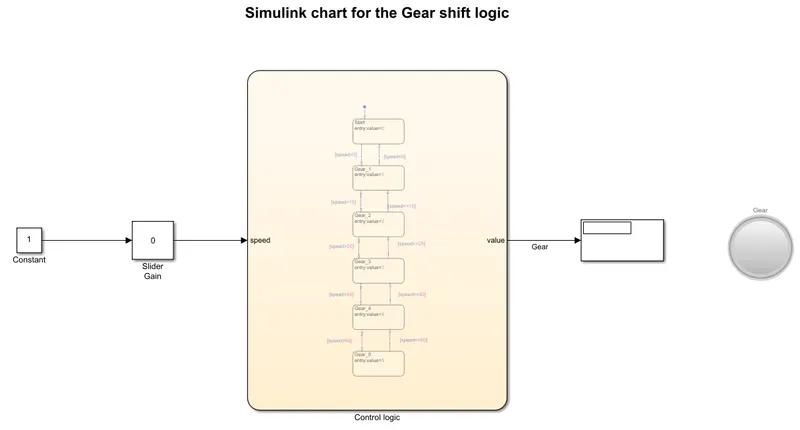
Fig 2.2
OUTPUT:
Output produced for each gear is displayed as shown below;
Gear-1
Speed range: 0-15Km/hr
Input speed : 10Km/hr
Indicator : Green
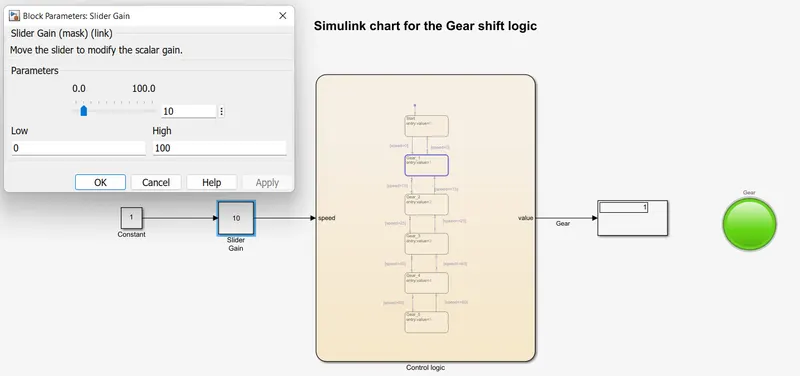
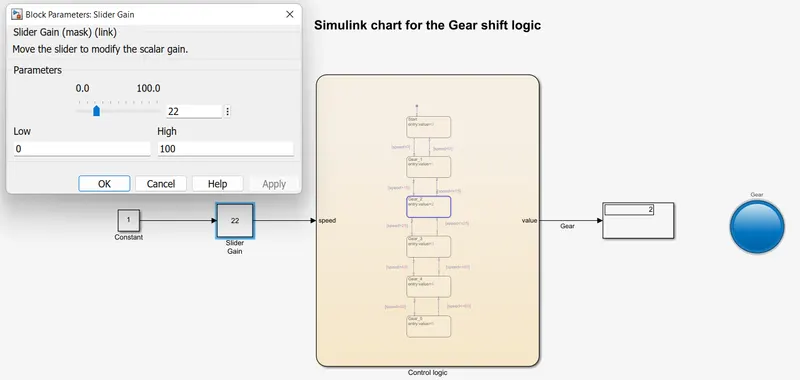
Gear-2:
Speed range : 16-25 Km/hr
Input speed : 22 Km/hr
Indicator : Blue
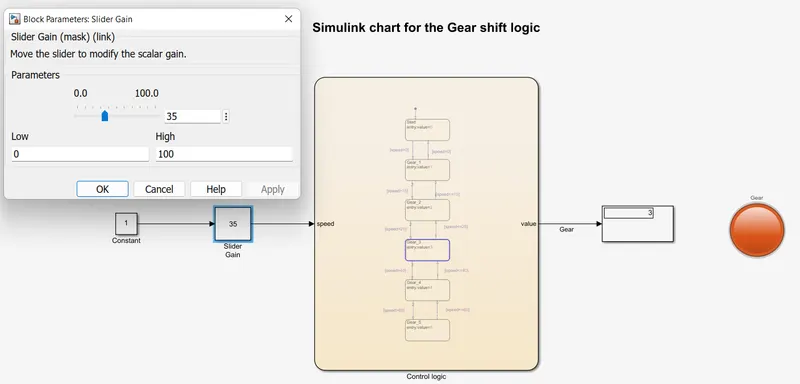
Gear-3
Speed range : 26-40 Km/hr
Input speed : 35 Km/hr
Indicator : Orange
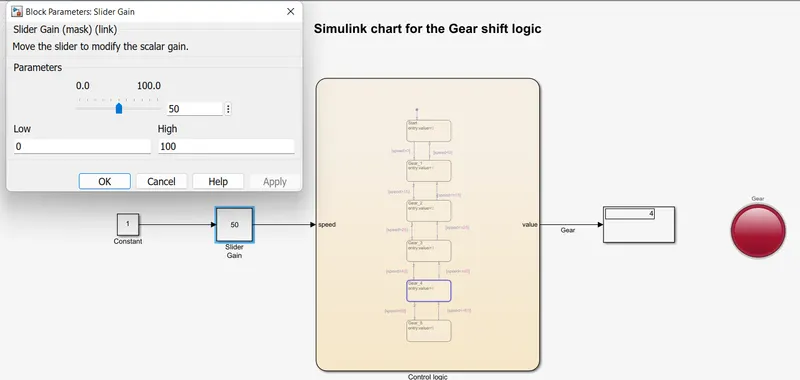
Gear-4
Speed range : 41-60 Km/hr
Input speed : 50 Km/hr
Indicator : Red
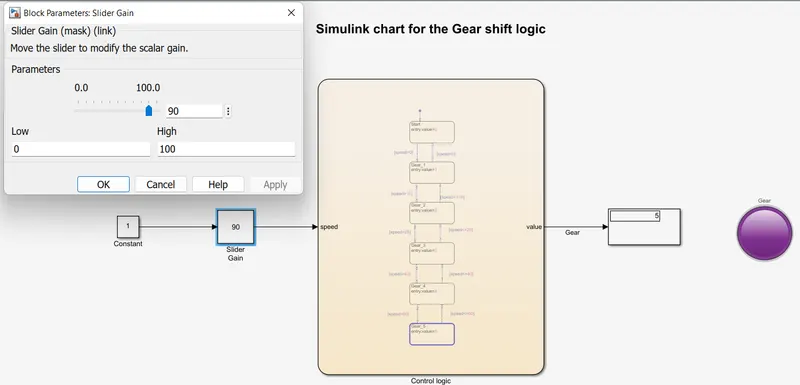
Gear-5
Speed range : Above 60 Km/hr
Input speed : 90 Km/hr
Indicator : Violet
RESULT:
Created a state flow model for Gear shift using simulink and the resluts for each gear shifts are obtained.