Week - 4
a) Aim :
To Implement control logic of a “washing machine” using Stateflow as per given sequence.
Elements used :
- Slider switch
- Constant
- Stateflow chart
- Display
- Lamp
Condition given :
- If the power supply is available, the system gets activated
- If the Water supply is not available, stop the process & indicate through LED
- Soaking time should be 200s followed by Washing time of 100s.
- Then rinsing happens for next 20s & dryer runs for 50s
- After all the processes have completed turn on the finished LED.
Construction :
- Chart is opened from the state flow.
- Inside the chart the state flow function for the washing machine is given.
- Initially two constants were created one for the power input and the other for the water input.
- Both inputs are given as analog inputs, when the value of the input is zero the condition for the input is off.
- If the input value is one then there will be flow and the processs will continue.
- Now the constants were connected to the slider switch seperately.
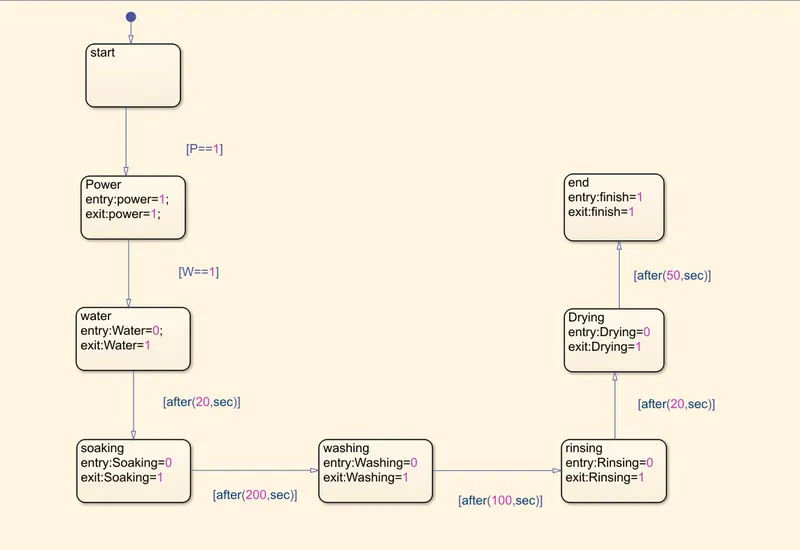
- First a section block is opened and stated as start.
- Another block is inserted for power and is connected with the start.
- The condition for the power input from the start is given as P==1 , which is the process will move to the second step only when the input for the power value is 1.
- Similarly multiple blocks for water input , soaking, washing, rinsing, drying and for the end of process is created.
- Condition for water input is given as W==1 which states the flow of process only when the input value of water is 1.
- The entry and exit input for water and power are stated respectively.
- Then the time for the start of process is given using the after condition.
- [after(20,secs)] states that the process will start after 20 secs from the begning.
- Similarly for the next steps the timing conditions mentioned in the video was given as input conditions.
- As, [after(200,secs)] this condition will allow the water floe for 200 secs and after 200 secs the process will move to the next stage of washing, similarly after 100 for rinsing [after(100,secs)],after for drying [after(20,secs)] , after 50 the cyle of washing machine will stop the cycle [after(50,secs)].
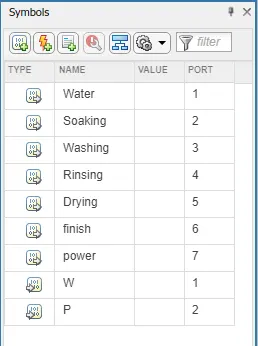
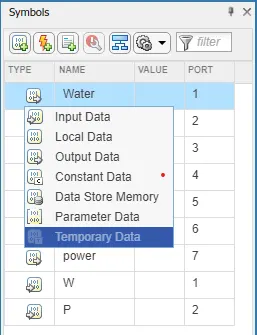
- In the symbols pane the type of datas were defined, here we have 7 output datas for power output , water output , soaking process output, washing process output , rinsing process output , drying process output and end cycle output were defined.
- Also 2 input datas for Power input (P) and water input (W) is defined.
- The port number in the pane defines the order of position of each ports
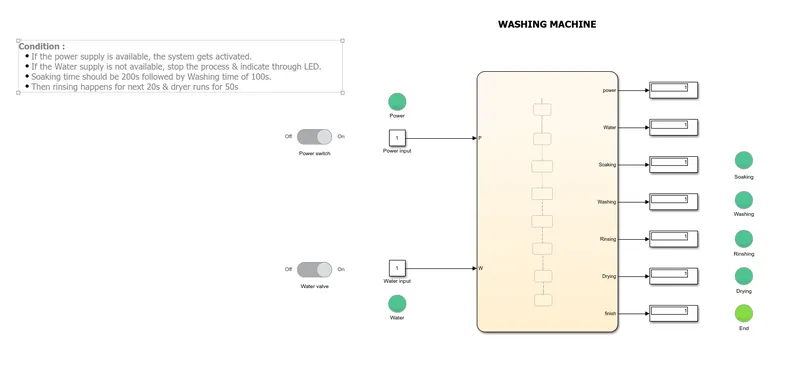
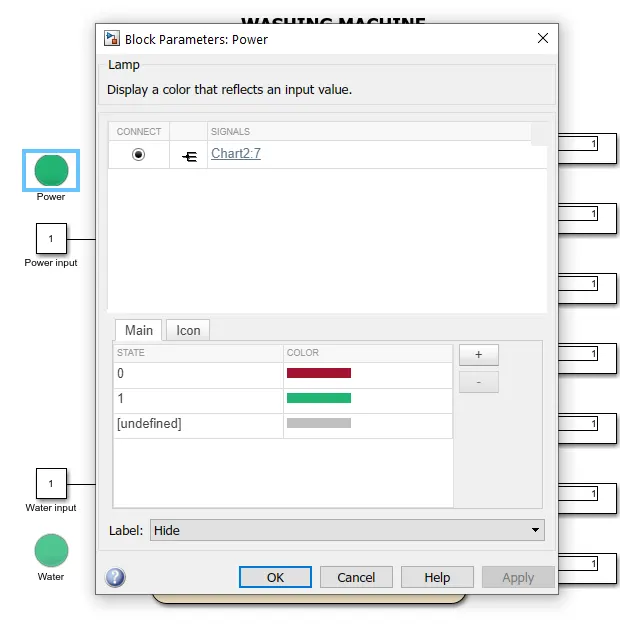
- The output from the each process is displayed and is connected with individual lapms to indicate what process are completed.
- The number 0 indicates there is no flow of cycle and is indicated in RED colour.
- THe number 1 indicates there is flow of cycle and is indicated in GREEN colour.
- Each lamp is connected seperately with the output from each stage of the cycle.
- The Chart2:7 indicates that the lamp is connected with the display 7 ( which is output 7 from the cycle ).
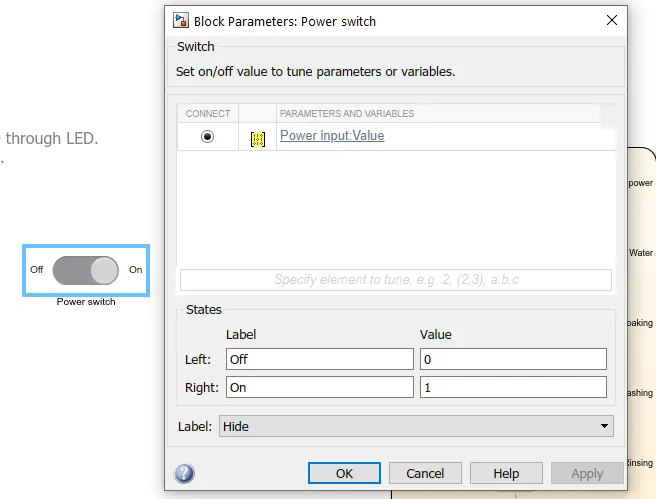
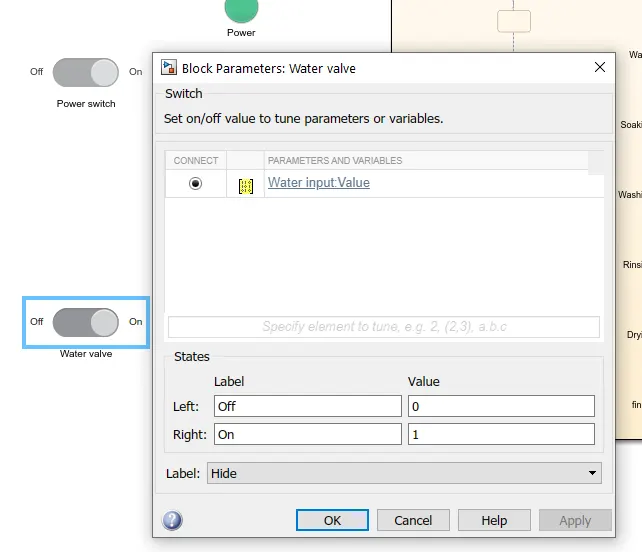
- Two slider switches were connected with the input constants , one for power and other for water respectively.
- Where for ON condition no.1 is defined and for off condition no.0 is defined.
- And the washing machine model is simulated for a run time of 420 secs.
b) Aim :
To Make a Simulink chart for the “Gear shift” logic.
Conditions given :
- Speed Range(kmph) Gear
0 to 15 1
16 to 25 2
26 to 40 3
41 to 60 4
Above 61 5
- Give speed input while the simulation is running & display the gear number.
Elements used :
- Slider
- Constant
- Chart
- Display
- Scope
Conditions :
- Speed Range(kmph) Gear
0 to 15 1
16 to 25 2
26 to 40 3
41 to 60 4
Above 61 5
- Give speed input while the simulation is running & display the gear number.
Construction :
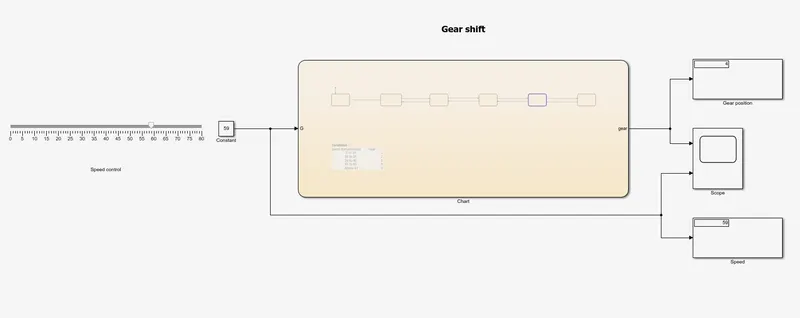
- A chart is taken from he library.
- The flow of chart is defined inside.
- Here the folw of chart detemines the gear in which the vehicle is operating at a particular speed.
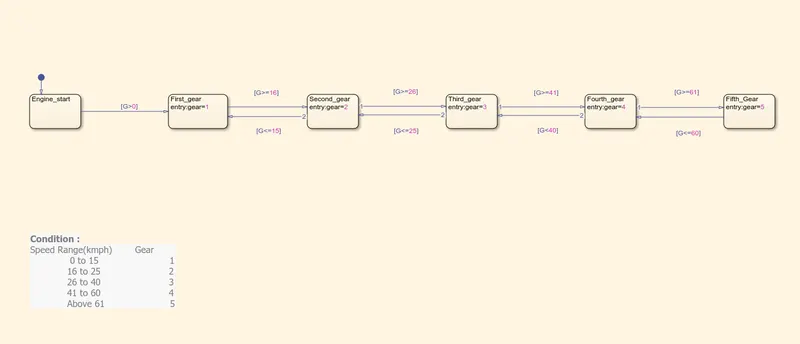
- Initially a state block is taken and is named as Engine_start
- Then five state blocks were taken and named as first gear , second gear , third gear , fourth gear , fifth gear respectively.
- Then the direction of flow between the respective gears were defined in the incresing order of gear number.
- For the operation of each gear respective conditions were defined based on the given conditions.
- For first gear the condition should be [G>0].
- The gear conditions for gear shifts are : [G>=16] for second gear ( which is the condition to shift from second gear to third gear ) , [G>=26] for third gear , [G>=41] for fourth and [G>=61] for fifth gear.
- Speed Range(kmph) Gear
0 to 15 1
16 to 25 2
26 to 40 3
41 to 60 4
Above 61 5
-
Also the direction of flow is reversed beacuse we will not drive only in constant speed increase, there will be variation in speeds based on thetype of road , traffic etc... [G<=15] for second gear ( which is the condition to shift from third gear to second gear ) , [G<=25] for third gear , [G<=40] for fourth and [G<=60] for fifth gear respectively.
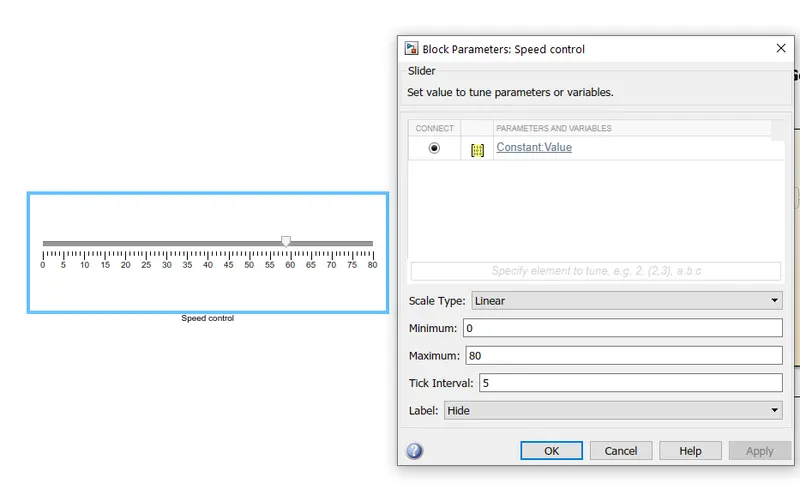
- A simple slider is added from the library and is connected with the constant directly.
- By moving the slider we can change the speed insted of manulally entering the numbers in th constant block.
- for a period of time the file is compiled with the time limit as inifinite (inf).
- While compiling the speed is altered with the help of slider for time gap intervals and the graph is recorded in the scope block.
- The plot is generated for both spped input and gear position output in the display seperately.
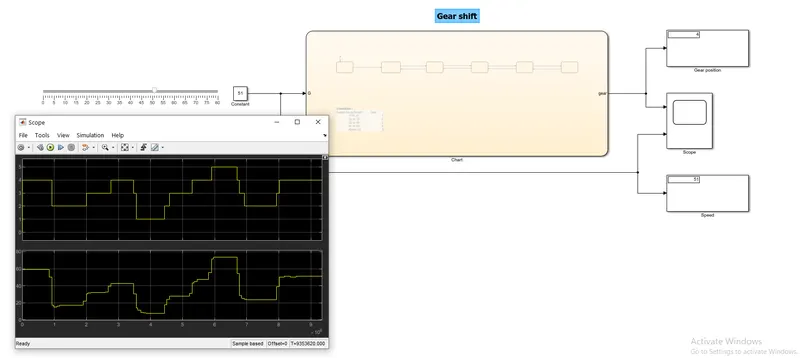
- Plot for the variable inputs using the slider.
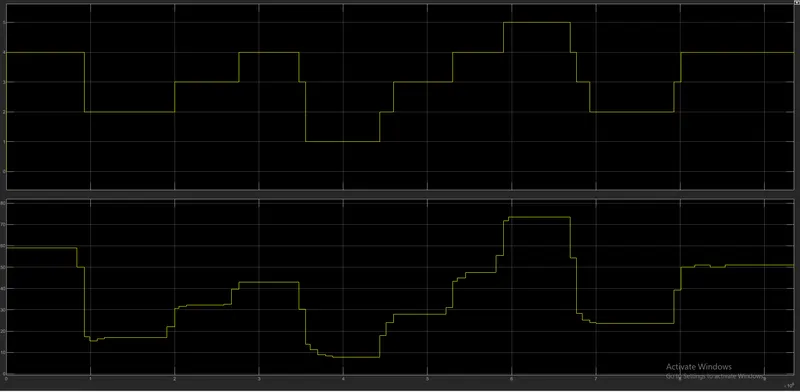
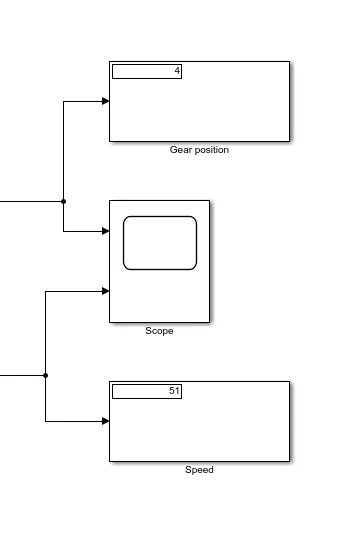
- The below image shows that at the speed of 50kmph the vehicle is operating in fourth gear. Which is shown in the display sepertely.