Week - 4
OBJECTIVE 1 :- Implement control logic for "Washing Machine" using stateflow as per sequence below
(a)Power supply avaliable system gets activated.
(b)If water supply not avaliable stop proccess and indicate via LED
(c)Soaking time 200 sec with following washing time of 100 sec.
(d)Rinsing for 20sec and dryer for 50 sec after complition turn on finished LED.
MODEL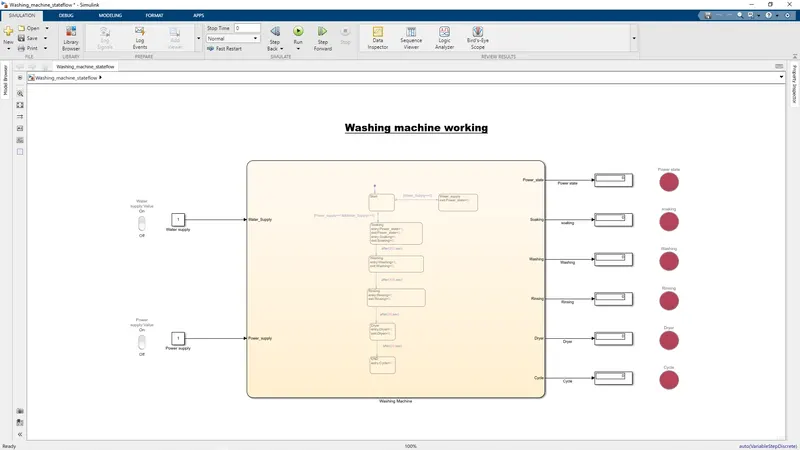
Chart diagram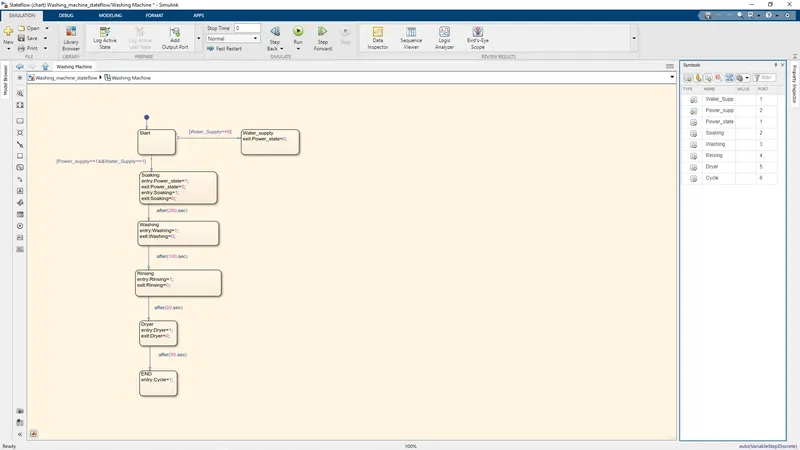
Blocks used acoording to steps:-
- Chart: We use this command to use stateflow method .It is event driven system ,Where system respond to even by making a transition.We create 2 inputs power supply and water supply and than create 6 outputs power state, soaking, washing,rinsing,dryer and cycle
- Constant: We inset 2 inputs via constant here named 'water supply' and 'power supply'
- Rocker switch:We insert this switch Which gives input of 1 at on and 0 at off and connect it with both inputs.
- Display: We connect display to all 6 outputs to show data results.
- Lamp: We connect lamp to each display output which shows on and off when data is 1 and 0 respetively. Off data shows red color and on data shows green colour.
CHART STEPS
- We use "State" block in chart.when we open the chart block by double clicking it.
- We provide needed inputs and output ports accordingly in symbol pane
- We enter the state name and details eg soaking etc. and provide action commands in like entry and exit and provide conditions .
- We mark transitional arrows which leads to another "state" block and give conditions according to which the transition will occur eg. after( 200 sec) means after 200 seconds the transition will occur and other state block will be in action.
- Transitions can be reversed back if changes in action is needed.
OUTPUT
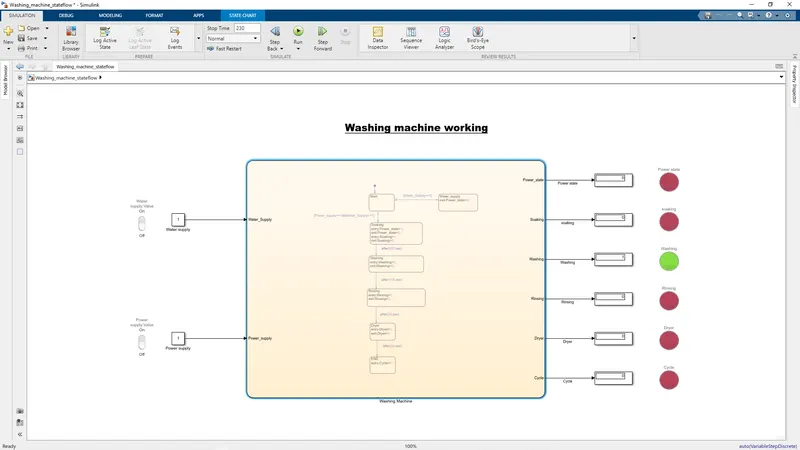
Below shown output is when we stop for 230 sec as shown during that time machine is in washing process.
Below is the result for 400 sec at that point the machine is in cycle state means after finish LED is on as asked.
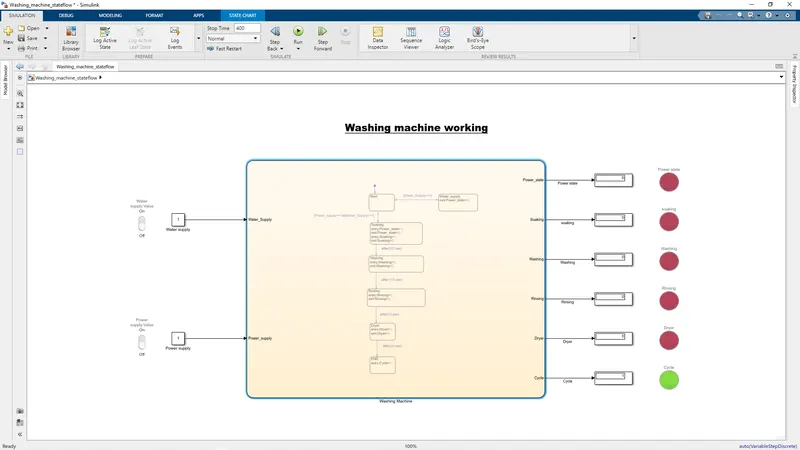
NOTE: IF any input water supply or power supply is given zero machine will not run.
OBJECTIVE 2: Create stateflow model for gear shift where they follow certain case:-
Speed :- 0-15 = gear 1 , 16-25= gear 2, 26-40=gear3, 41-60=gear4
60 above = gear 5.
MODEL
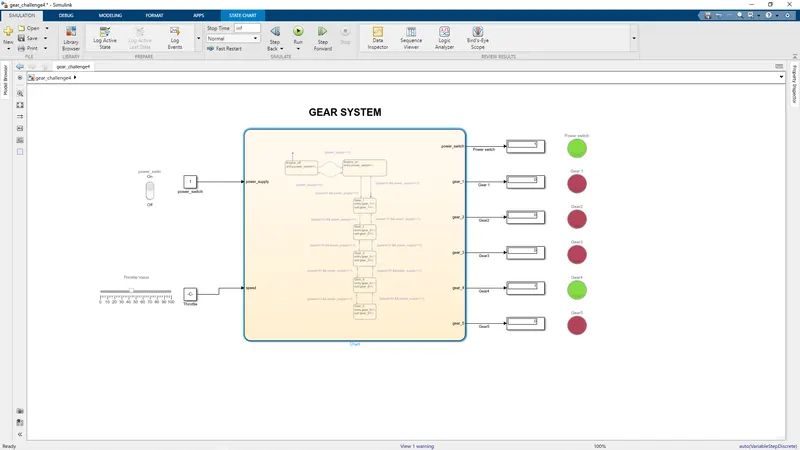
CHART MODEL
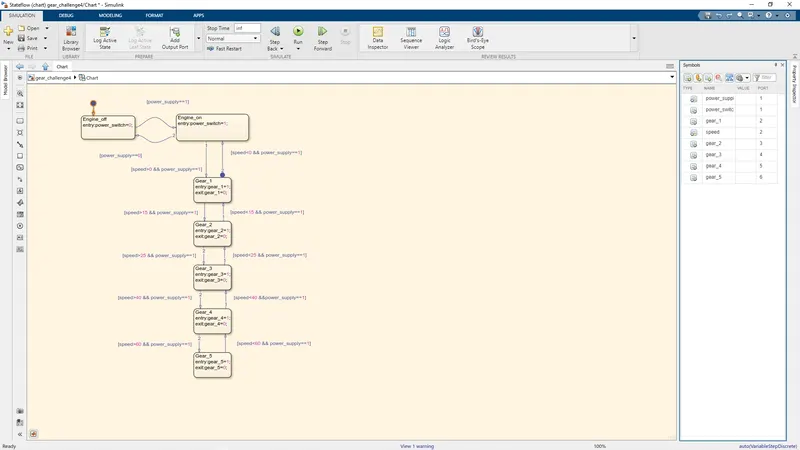
BLOCKS USED WITH STEPS:-
- Chart: To use stateflow method this block is used as shown above Here Power supply and speed is input and power switch , gear 1 , gear 2, gear 3 , gear 4, gear 5 are outputs.
- Constant : We use for inputs speed and Power supply
- Rocker switch : we connect this switch to power supply Where it will provide 0 input at off and 1 at on for power supply .
- Slider: We use this for providing speed inputs which varies during runing respectively as speed varies the output for gear will change.
- Display: We use this to connect to all 6 outputs for displaying data.
- Lamp: We use this to connect to all displays and when its value is zero the Led will show red signal as off and green signal when output is 1 which means on
CHART STEPS
- We use "state" block in chart where we enter all actions and conditions like in this case its all Gear blocks.
- We create required inputs and output ports in symbol pane as needed eg gear 1, gear 2 etc.
- We use arrows by clicking for transition and give condition eg. speed > 15 etc.
- if Gear is needed to be lowered we add reverse arrow and give condition eg. speed< 26 etc
OUTPUT
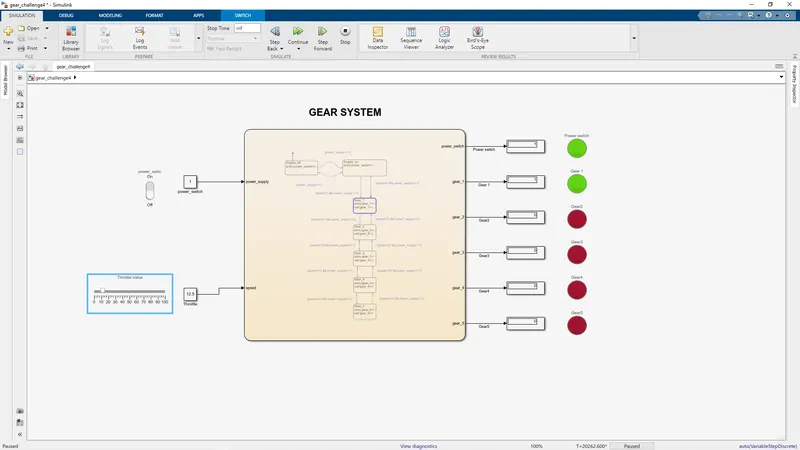
Below output is for 12.5 km/hr speed so gear 1 LED is on.
Below is the output for 100km/hr so gear 5 light is ON.
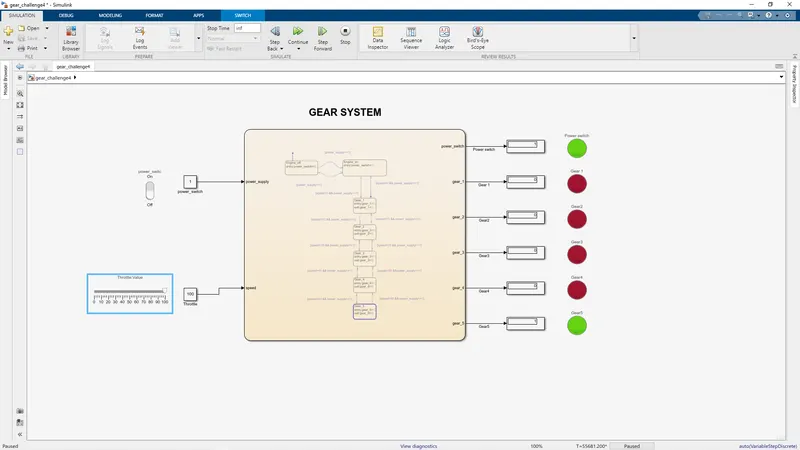
NOTE: speed can be changed while runing as time is infinite acoording to speed led lights will change .