Week - 4
Question-1 Implement control logic of a “washing machine” using Stateflow as per given sequence:
- If the power supply is available, the system gets activated
- If the Water supply is not available, stop the process & indicate through LED
- Soaking time should be 200s followed by Washing time of 100s.
- Then rinsing happens for next 20s & dryer runs for 50s
After all the processes have completed turn on the finished LED
Solution - There are following main components which are required to make state flow of 'Washing machine'
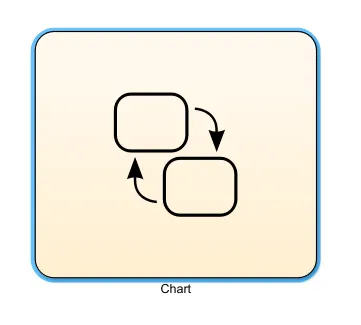
1) Chart - There are lots of state of washing machine such as washing,soaking,rinsing,dryer etc so for state flow where the one activity is depends on another activity we use Chart to make it easier . These type of acitity is called event driven activity. In the Chart every mode or state is depends on completed on previous one activity,after completing the previous one event the next event will start.
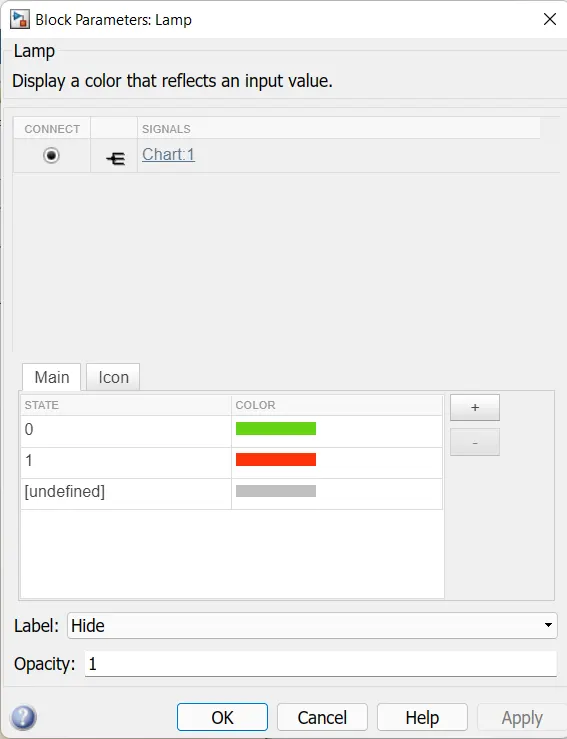
2) Lamp - It is used for color indicating. when we connect the output through the lamp it showes the color as we mention in the lamp option. It is the eastest way to understand that the chart flow is work properly and it depends on which singal it will connect. Basically we connect the lamp from the output singal.
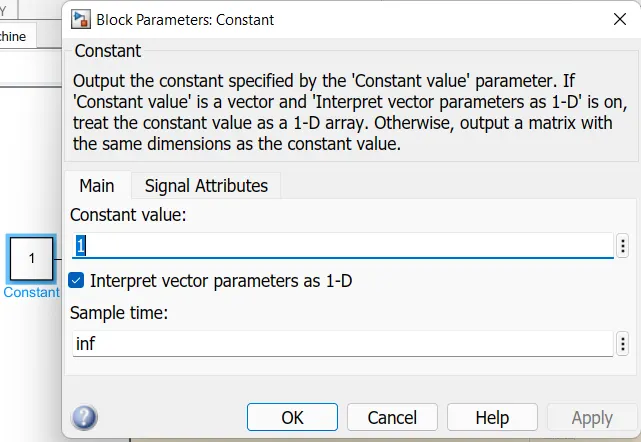
3) Constant - The constant block is used for real or complex value . In the Washing machine char flow we require constant value. So constant block is used for real value.
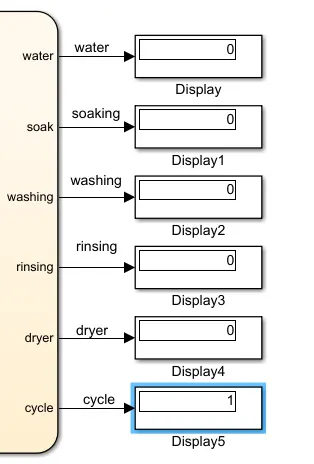
4) Display - Display is used for output data. It shows output values which get after completing the program.
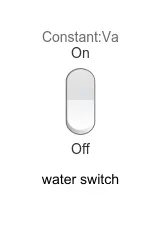
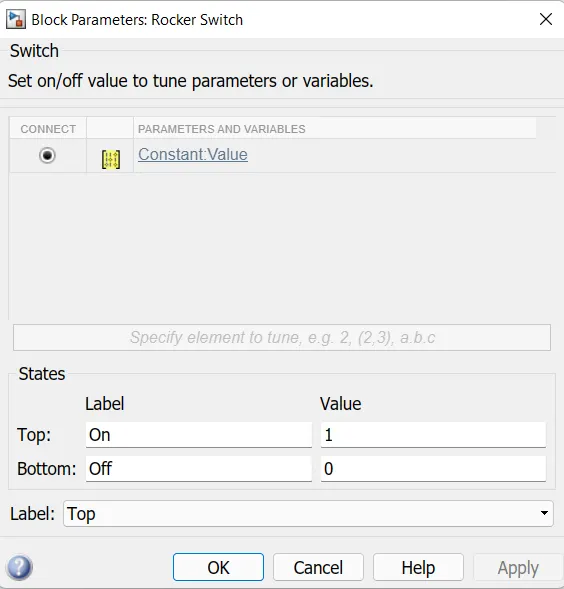
5) Rocker switch- The Rocker Switch block toggles the value of the connected block parameter between two values during simulation. By the use of switch parameter we can change the input and switch become ON and OFF.
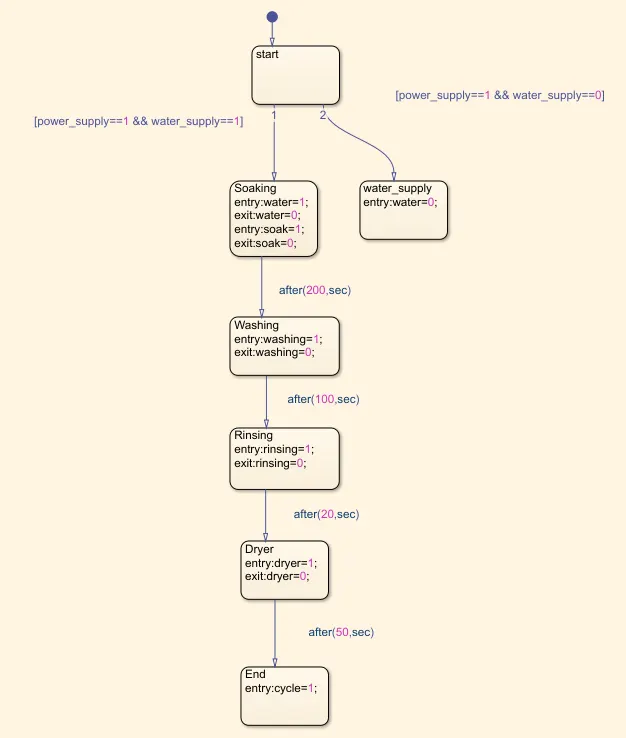
Washing Machine logic
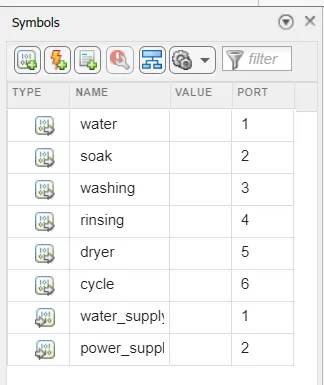
Symbol pane
Explanation
- In the above flow chart there are two conditions for power supply. One is with power supply available with water supply(power_supply==1 && water_supply==1) and another is without water supply(power_supply==1 && water_supply==0)
- After starting the process i.e when power and water are supplied the next process starts.
- The next processes are Soaking,Washing,Rinsing, Drying completed in 200sec, 100sec, 20sec, 50sec respectively.
- After all processes has done all LED will glow.
Run the model
Case 1- When the water supply is off and power supply is on then..
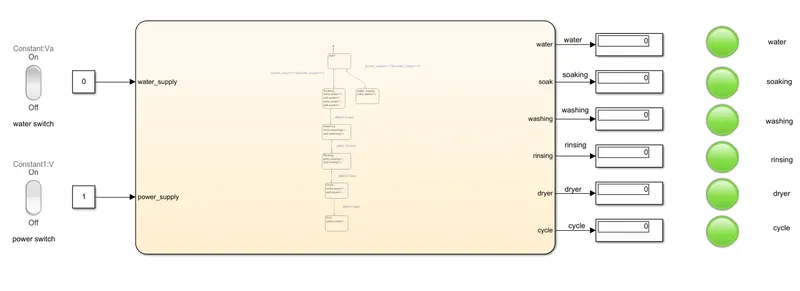
All LED shown green color i.e all the process has completed and all display output is 0.
Case 2- when power supply and water supply on then.....
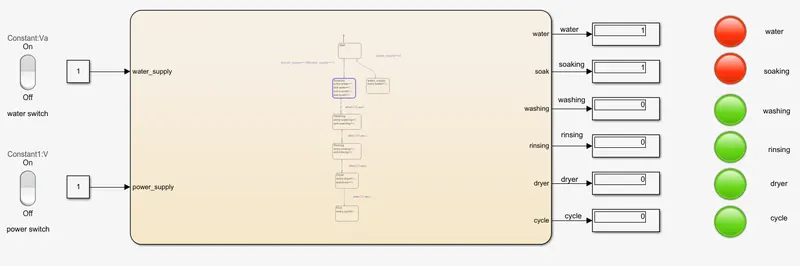
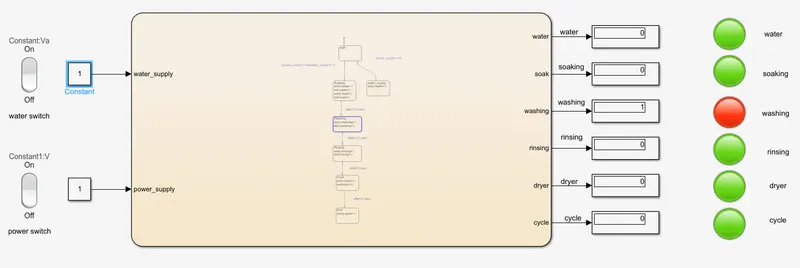
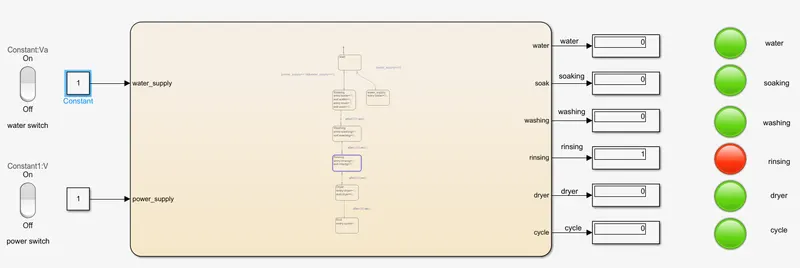
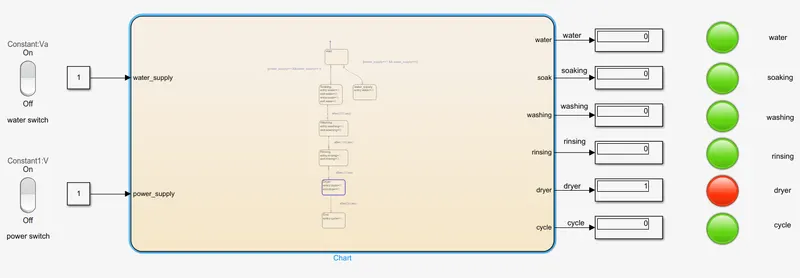
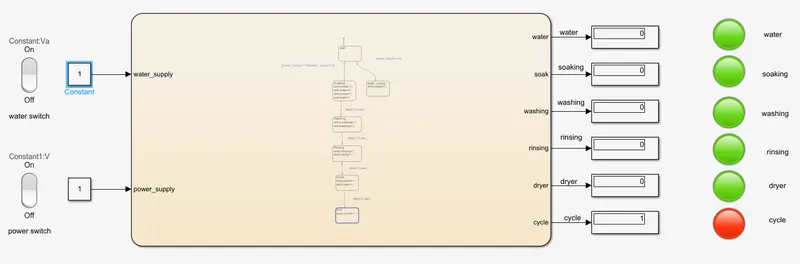
Here all the process is shown above such as soaking , washing, rinsing, dryer and cycle .
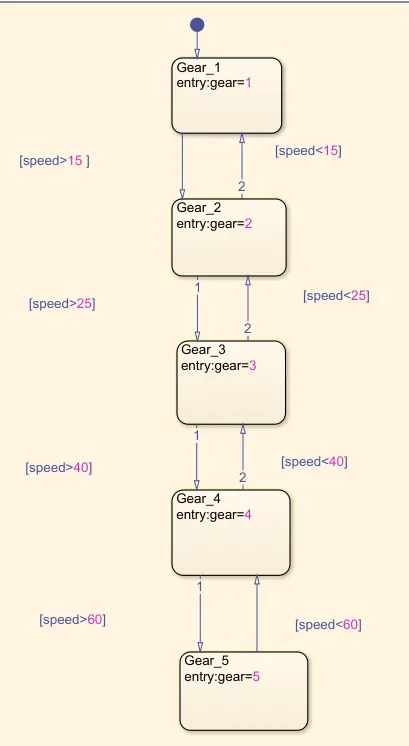
Question 2- Make a Simulink chart for the “Gear shift” logic as per below conditions:
Speed Range(kmph) Gear
0 to 15 1
16 to 25 2
26 to 40 3
41 to 60 4
Above 61 5
Give speed input while the simulation is running & display the gear number.
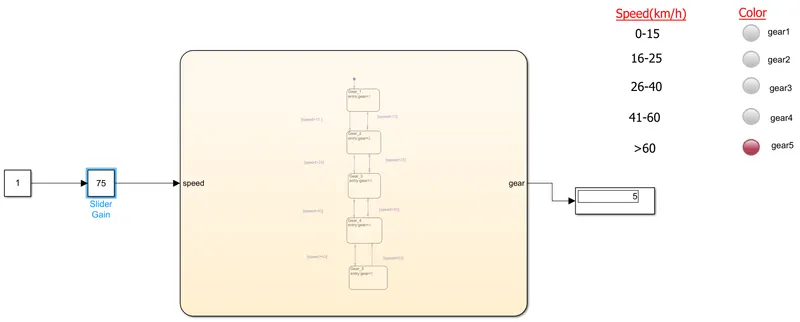
Solution- Block diagram of model
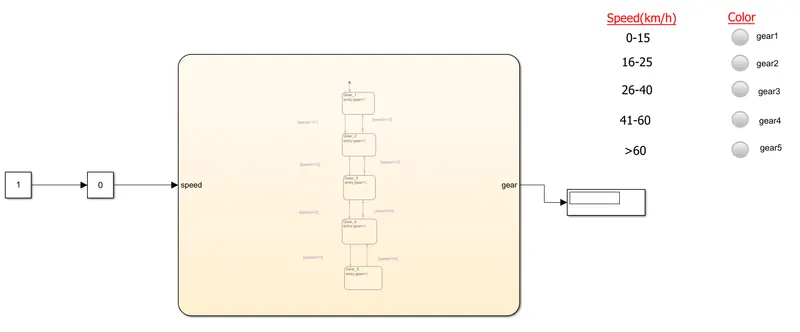
Chart diagram
Symbol pane
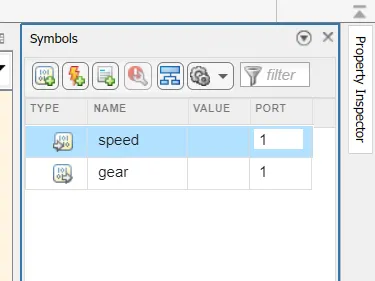
In the above symbol
speed is used as input data
gear is used as output data
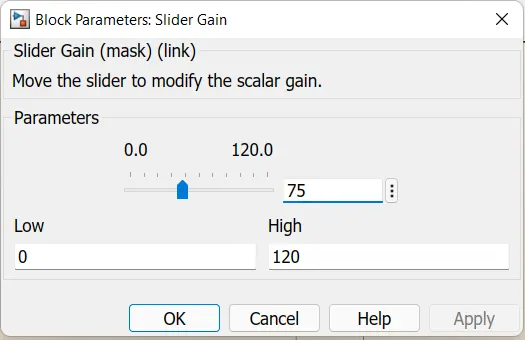
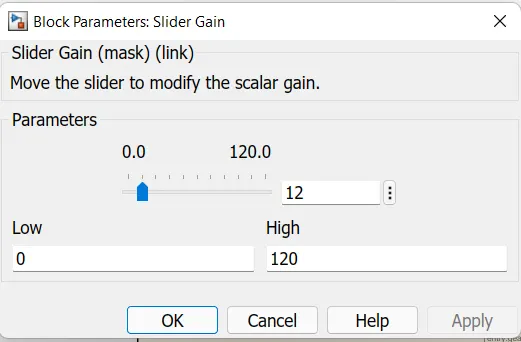
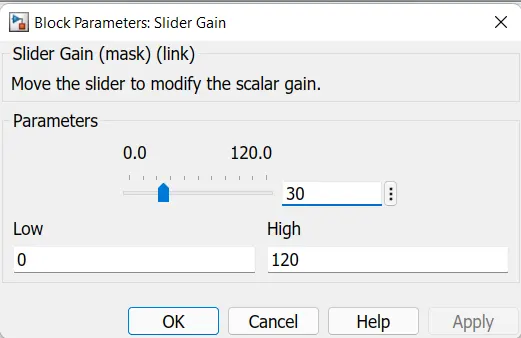
Slider gain
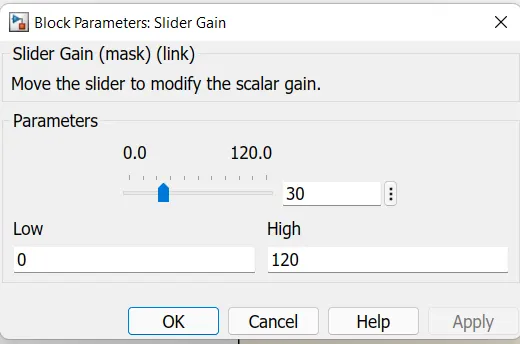
In the slider gain we set the speed
so the low value of speed is 0
and higher value of speed is set 120
with in this limit we can change the speed and get the answer
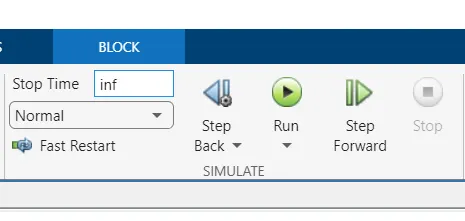
Simulation time
Output-
Case 1
Speed Range(kmph) Gear
0 to 15 1
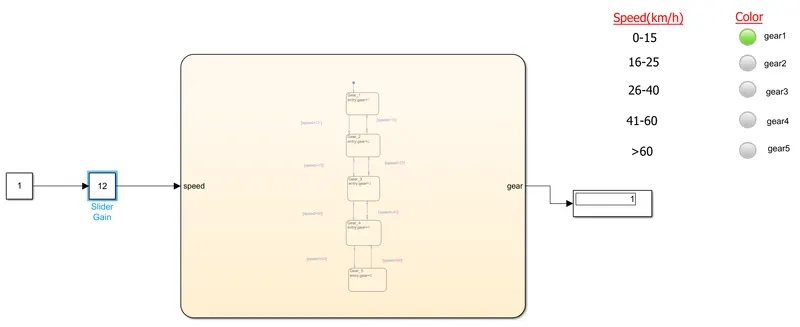
In the slider gain we give the input value less than 15
as we gave 12 as input
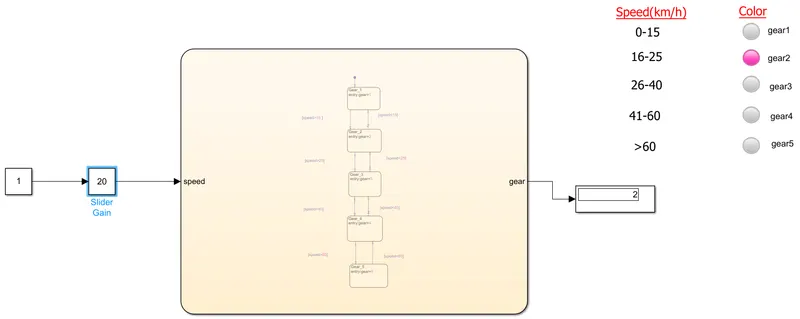
Case 2
Speed Range(kmph) Gear
16 to 25 2
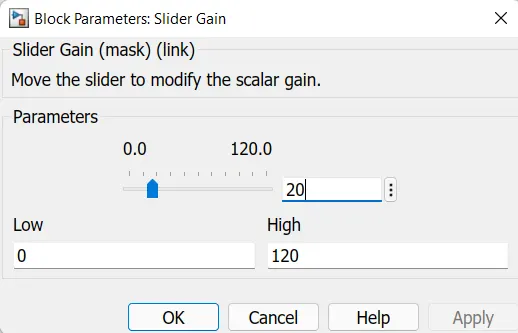
In slider gain we gave the input greater than 15 and less than 25
we gave 20 as input
Case 3
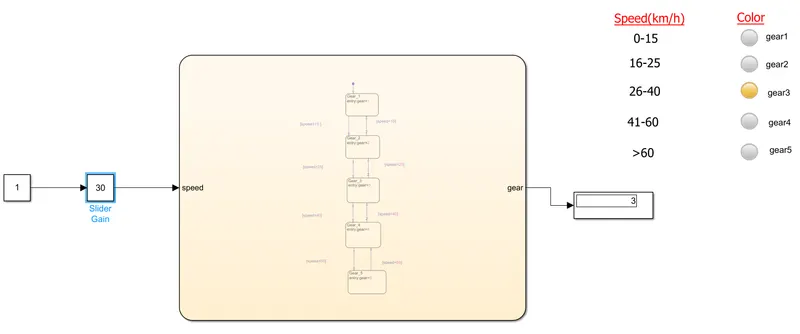
Speed Range(kmph) Gear
26 to 40 3
In slider gain we gave the input greater than 26 and less than 40
we gave 30 as input
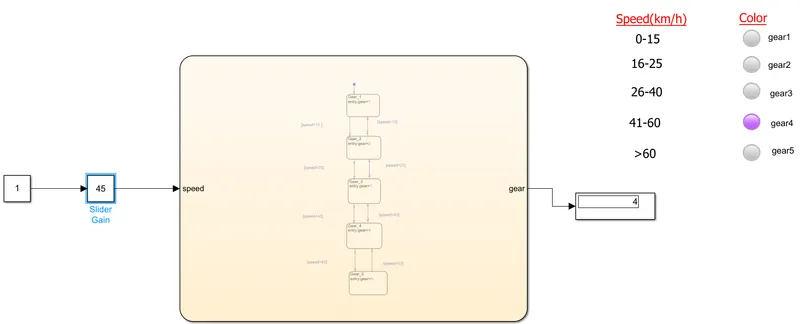
Case 4
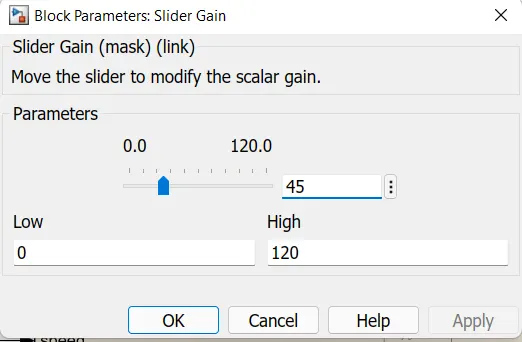
Speed Range(kmph) Gear
41 to 60 4
In slider gain we gave the input greater than 41 and less than 60
we gave 45 as input
Case 5
Speed Range(kmph) Gear
Above 61 5
In slider gain we gave the input greater than 61
we gave 75 as input