Week - 4
ANSWER1:
The blocks used in this simulation are as given below:
- Constant block:- Constant values can be taken as input from this block.
- Display Block:- It is used to display the final output/result of the model/function/equation/chart etc.
- Stateflow Chart:- A finite state machine is a representation of an event-driven (reactive) system. In an event-driven system, the system responds to an event by making a transition from one state (mode) to another. A Stateflow chart is a graphical representation of a finite state machine. States and transitions form the basic elements of the system. A Stateflow chart can use MATLAB or C as the action language to implement control logic.
- Lamps:- The Lamp block displays a color to indicate the value of the input signal. You can use the Lamp block with other Dashboard blocks to build an interactive dashboard of controls and indicators for your model. You can specify pairs of input values and colors to provide the information you want during the simulation.
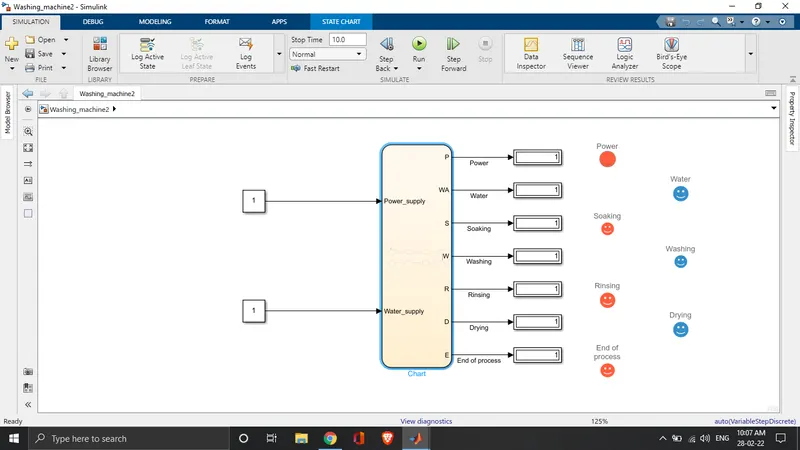
EXPLANATION:-
We have been given the following conditions:-
- If the power supply is available, the system gets activated
- If the Water supply is not available, stop the process & indicate through LED
- Soaking time should be 200s followed by Washing time of 100s.
- Then rinsing happens for the next 20s & dryer runs for 50s
Here, we have two input blocks which are the power supply and the water supply. And rest all our outputs are seen in the form of various stages of washing machine like:-
- Power Supply
- Water Supply
- Soaking
- Washing
- Rinsing
- Drying
- End of Process
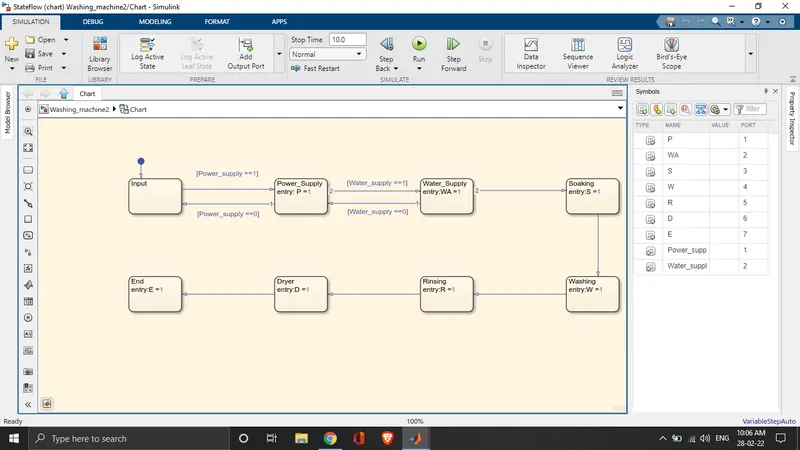
All the Seven lamps are connected with each output respectively and lights when each stage is active as per the conditions given:-
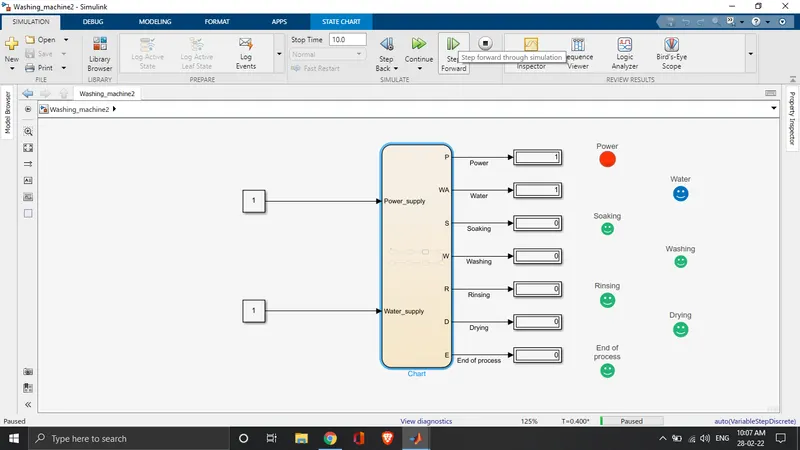
stage1: First we need our power Supply and water supply to be ON. We can see that in the below picture with the lamps ON.
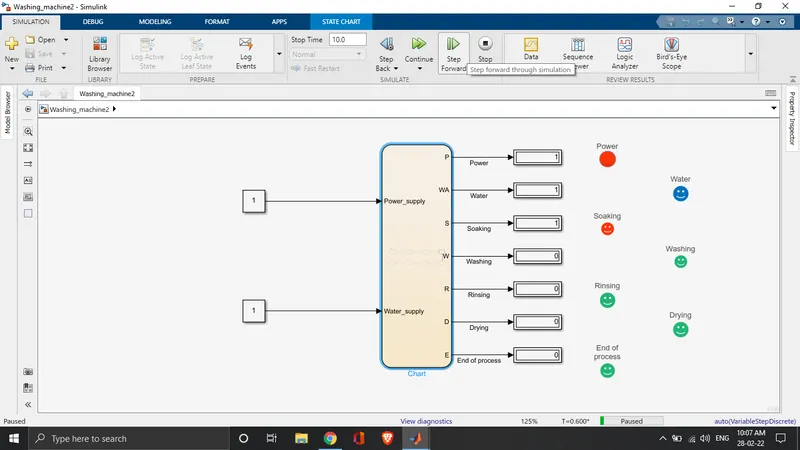
Stage 2: As we have both the inputs, the machine starts working and now the clothes are being soaked.
Stage 3: After that Washing is done and similarly after that all the steps are being followed to get results in form of clean and dry clothes.
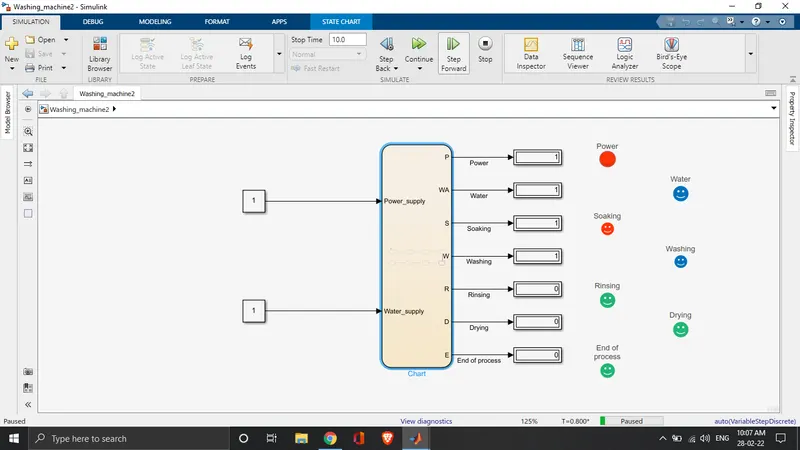
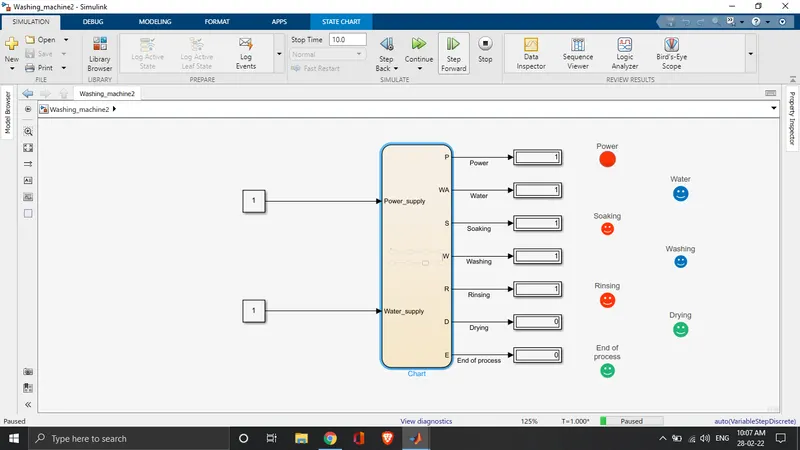
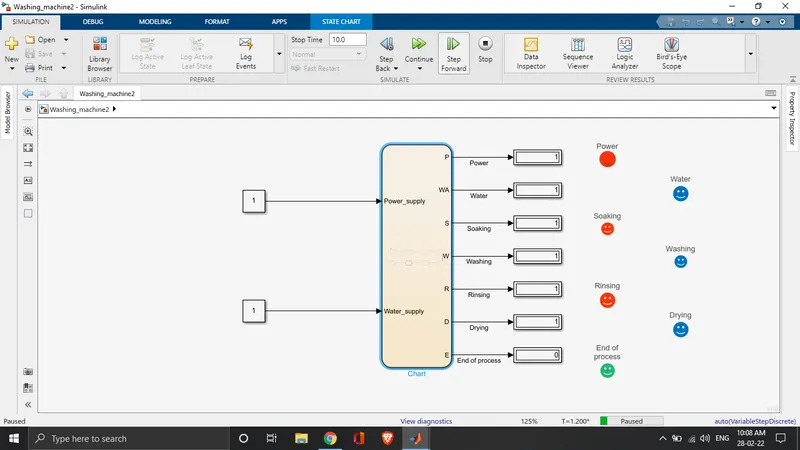
Stage 4: After completion of all the sub-process, there is end of process which tells us that our clothes can be removed from the washing machine
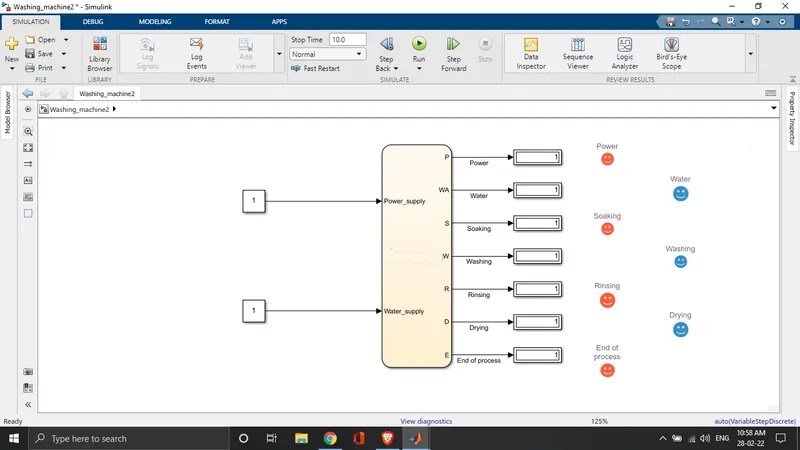
Hence, our simulation is done.
ANSWER:2
Let us first see the blocks used in implementing the Gear Shift logic in Simulink Matlab:-
- Slider Switch:- It toggles the value of the connected block parameter between two values during simulation. Use the Slider Switch block with other Dashboard blocks to create an interactive dashboard for your model. Double-clicking the Slider Switch block does not open its dialog box during the simulation and when the block is selected.
- Constant block:- Constant values can be taken as input from this block.
- Display Block:- It is used to display the final output/result of the model/function/equation/chart etc.
- Stateflow Chart:- A finite state machine is a representation of an event-driven (reactive) system. In an event-driven system, the system responds to an event by making a transition from one state (mode) to another. A Stateflow chart is a graphical representation of a finite state machine. States and transitions form the basic elements of the system. A Stateflow chart can use MATLAB or C as the action language to implement control logic.
- Lamps:- The Lamp block displays a color to indicate the value of the input signal. You can use the Lamp block with other Dashboard blocks to build an interactive dashboard of controls and indicators for your model. You can specify pairs of input values and colors to provide the information you want during the simulation.
- Slider Block:- The Slider block tunes the value of the connected block parameter during simulation. You can modify the range of the Slider block's scale to fit your data. Use the Slider block with other Dashboard blocks to create an interactive dashboard to control your model.
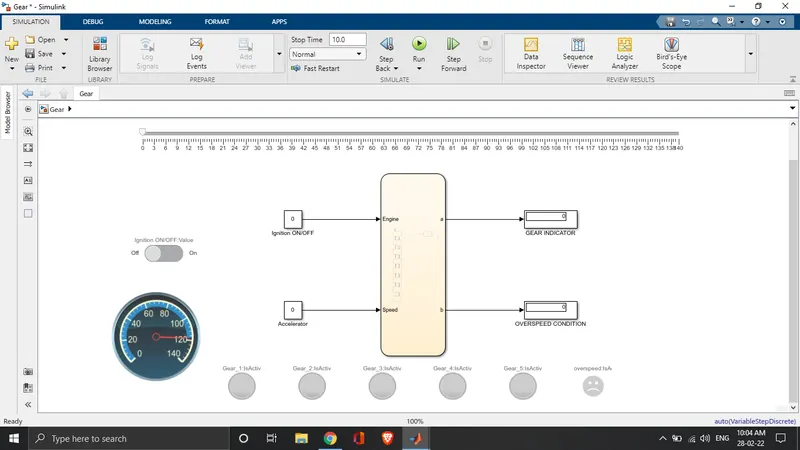
- Circular Gauge:- It displays the value of the input/output blocks connected to it and we can also customize the gauge as per our requirement. Model and Chart can be seen below:-
EXPLANATION:-
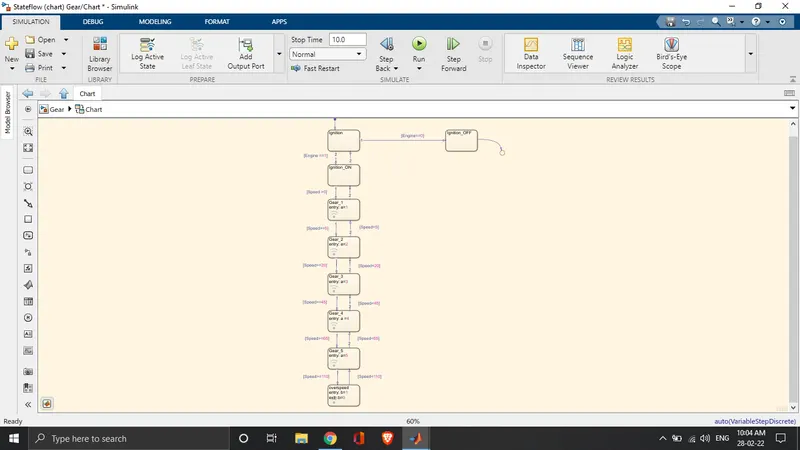
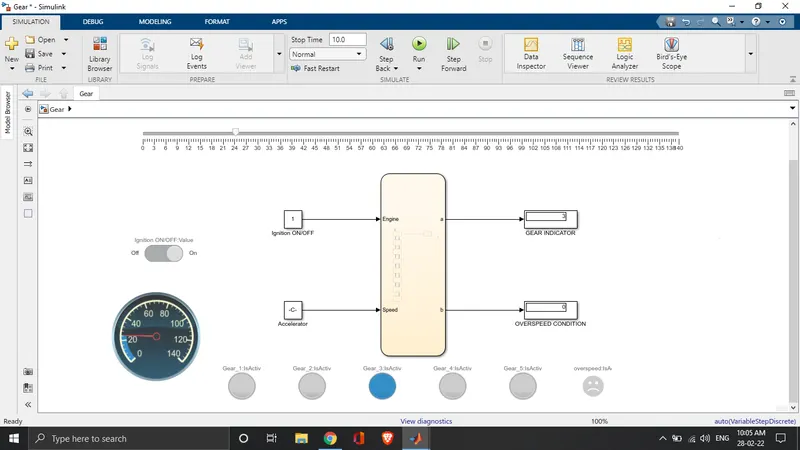
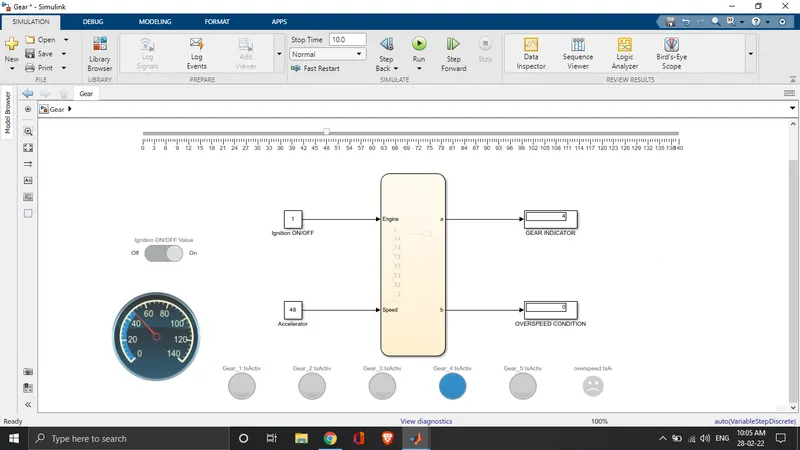
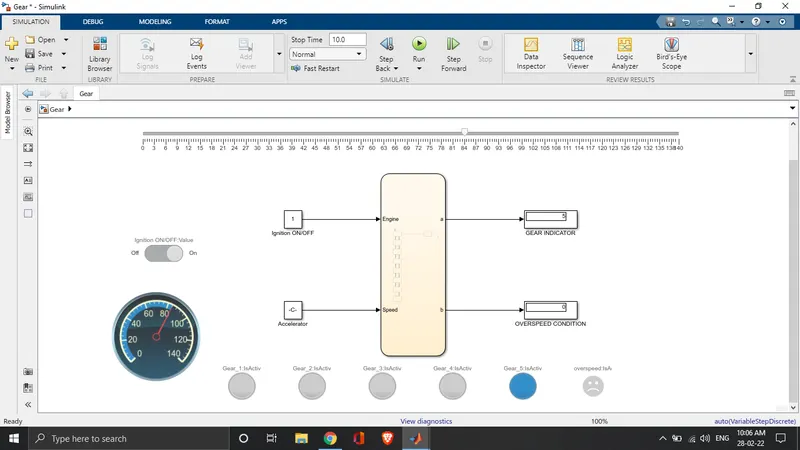
Let us first understand the connection of Blocks. There are two constant input blocks which are speed (acceleration) and another is the Ignition block connected to the engine block. And there are two output blocks in which the Gear indicator block represents which gear is required at what speed and the second one is the Overspeed block, it displays 1(one) as output when the speed is above 110km/hr. The Circular gauge is connected to the accelerometer block which acts as a speedometer and the slider block is also connected to the accelerometer block through which we can provide input by sliding the slider. And the slider switch is connected to the ignition block which turns ON/OFF the engine. And all the lamps are connected to the state blocks in the chart as per the respective gears. In the chart, we can see that there are two state blocks of ignition ON and OFF having conditions (engine == 0) which are OFF, and (engine == 1) which is ON. The rest of all are the gear blocks that show the car is in which gear as per the speed is increased and decreased. The last is the Overspeed block is active when the speed is more than 110 km/hr.
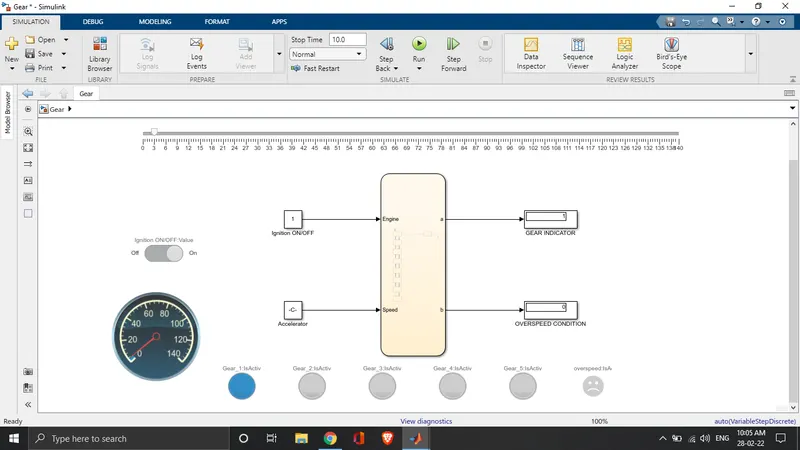
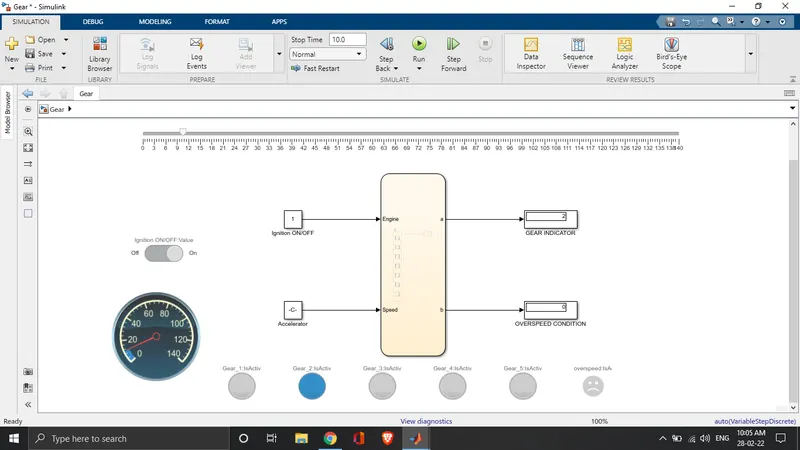
All the five gears can be seen below given pictures:-
GEAR 1: Speed>0
GEAR 2: Speed >5
GEAR 3: Speed > 20
GEAR 4: Speed >45
GEAR 5: Speed >65
OVERSPEED: Speed > 110
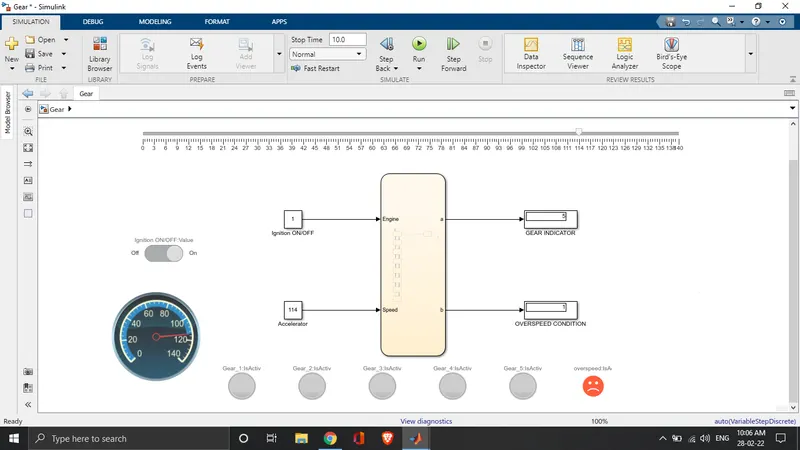
We can see that respective lamps are ON when the car is in different gears.