Week - 4
Q1.
Aim: To implement control logic of a “washing machine” using Stateflow as per given sequence.
Objectives: Create a simulink model for washing machine, operate the control logic of system and Display the output of the results by using lamp indicator ,display and scope.
Given Input Conditions:
- If the power supply is available, the system gets activated
- If the Water supply is not available, stop the process & indicate through LED
- Soaking time should be 200s followed by Washing time of 100s.
- Then rinsing happens for next 20s & dryer runs for 50s
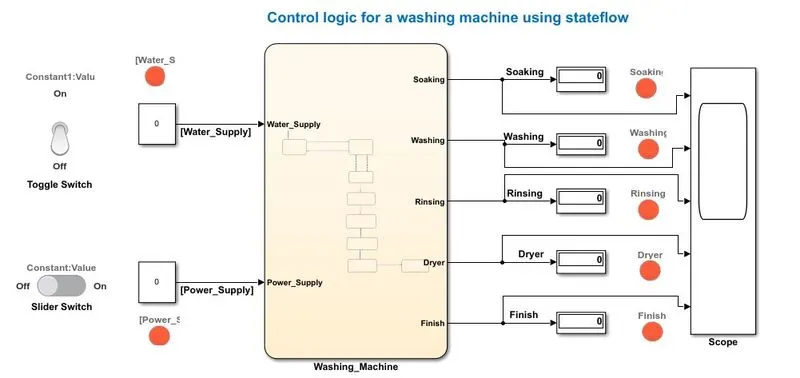
Simulink Model for Washing Wachine:
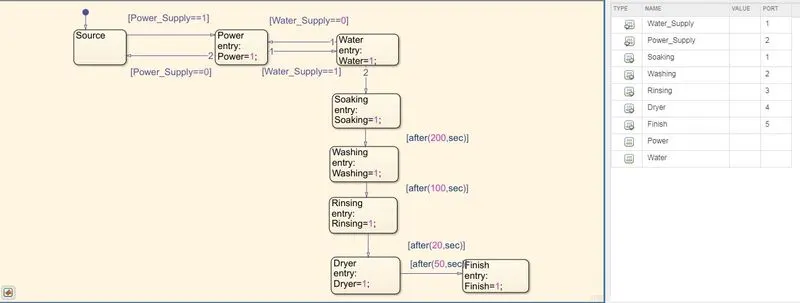
Control Logic using Stateflow:
Theory:
- State Flow: Stateflow provides a graphical language that includes state transition diagrams, flow charts, state transition tables, and truth tables. By using Stateflow to describe how MATLAB algorithms and Simulink models react to input signals, events, and time-based conditions.
- Control Logic: Control Logic is model system logic using State machines, Flowchart and Truth tables.
Procedure/Steps:
- Create a chart block for defining the stateflow as per the given conditions.
- Inside it, the circular junction is to terminate the signal flow and return a null value.
- If power is OFF i.e. O, the process is terminated at the junction else 1 is carry forwarded.
- If water is OFF i.e. O, the process is terminated at the junction else 1 is carry forwarded.
- After this, Soak block gets activated and soaking action takes place.
- After 200 sec of Soaking, Wash block gets activated and washing action takes place.
- After 100 sec of Washing, Rinse block gets activated and rinsing action takes place.
- After 20 sec of Rinsing, Dry block gets activated and drying action takes place.
- After 50 sec of dry, Finish block gets activated. Finish is to terminate the signal flow in the process and exits the chart.
- Define power and water as inputs whereas soak, wash, rinse, dry, finish as outputs.
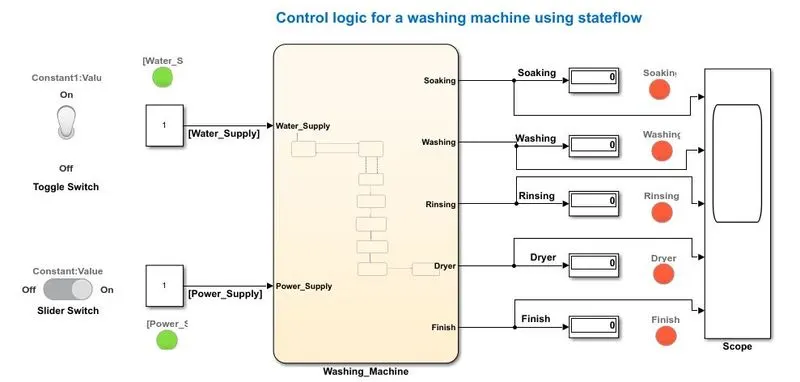
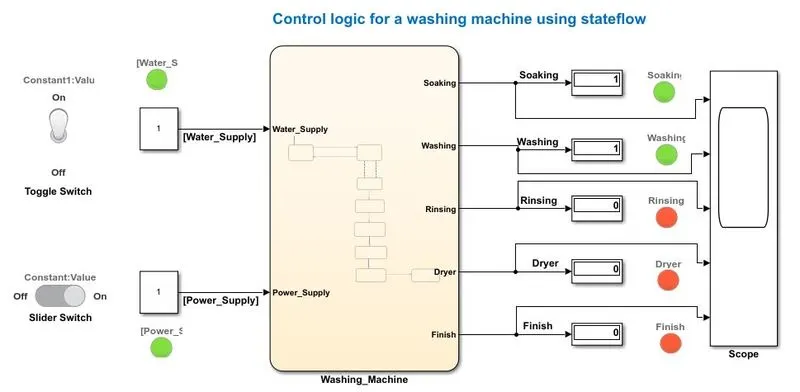
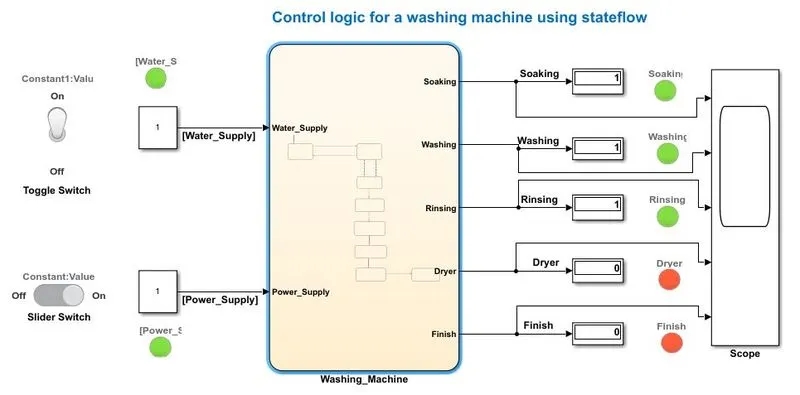
- Connect the chart block with constant blocks for power and water inputs. Input switches connected to them are slider switch and a toggle switch respectively (to distinguish between the two). Attach lamps to observe the ON/OFF condition.
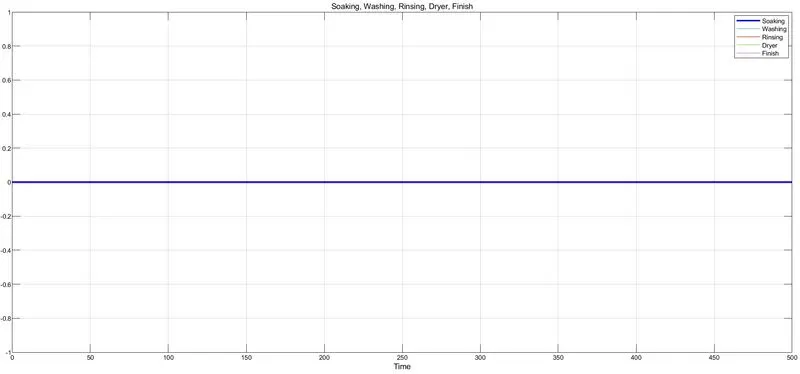
- A common scope block is connected to observe the entire washing process and obtain the output plot. Blue color in the lamp indicates that the process is complete.
Operation and Outputs:
A simulink model for operating the washing machine according to given conditions is shown below
-
Power ON Water OFF
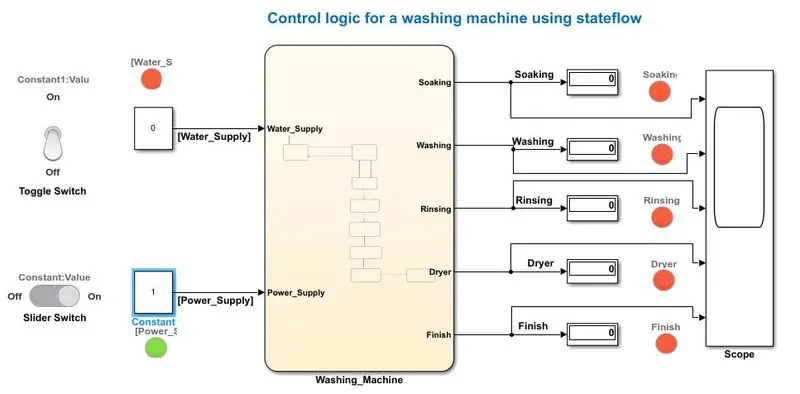
- Power ON & Water ON at t=0 Sec
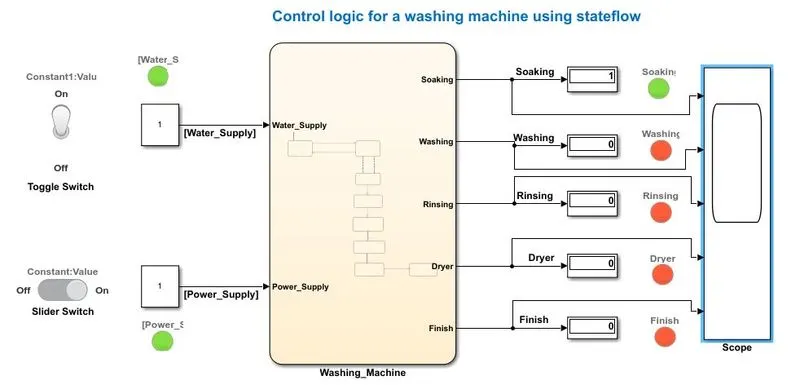
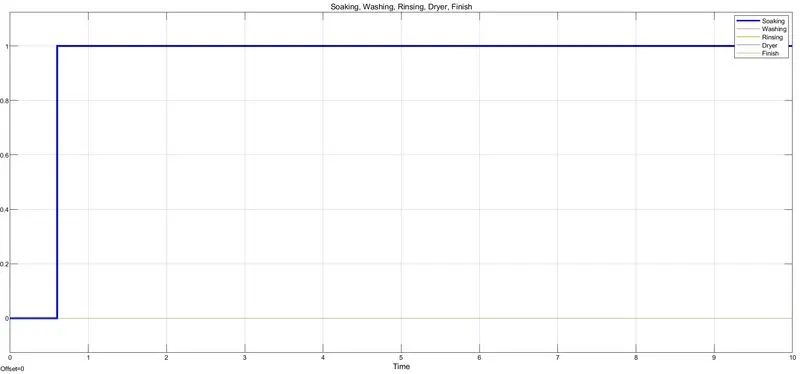
- Power ON & Water ON ; t=10 Sec Soaking ON.
- Power ON & Water ON; t= 220 Sec Washing ON
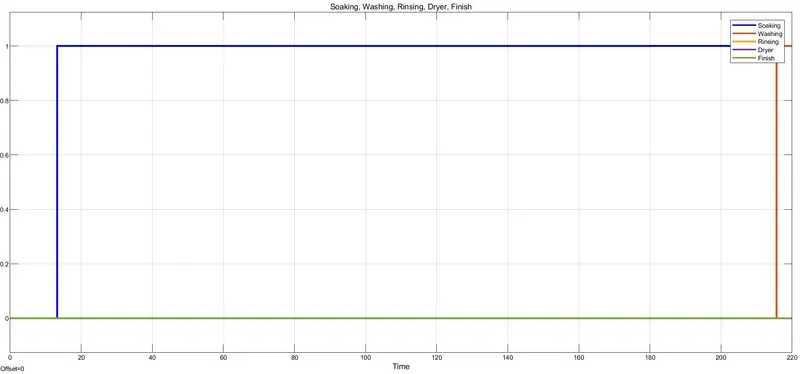
- Power ON & Water ON; t= 330 sec Rinsing ON;
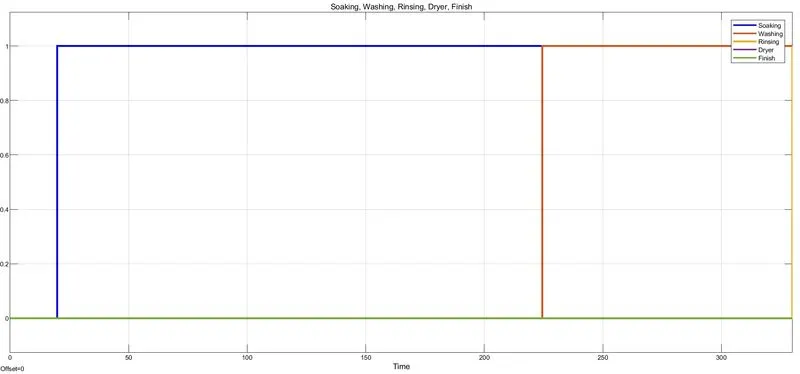
- Power ON & Water ON ; t= 350 sec Dryer ON:
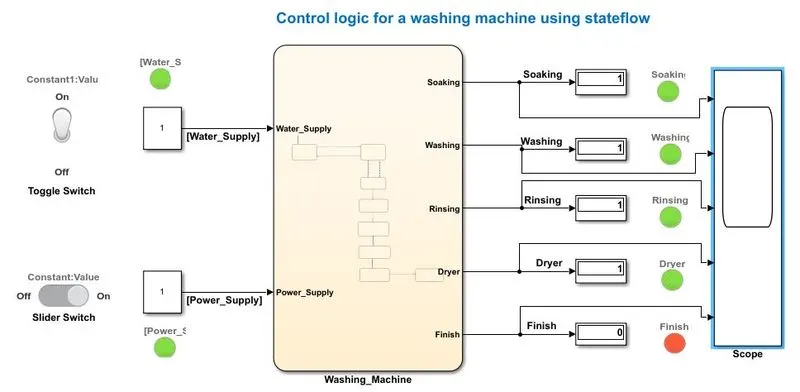
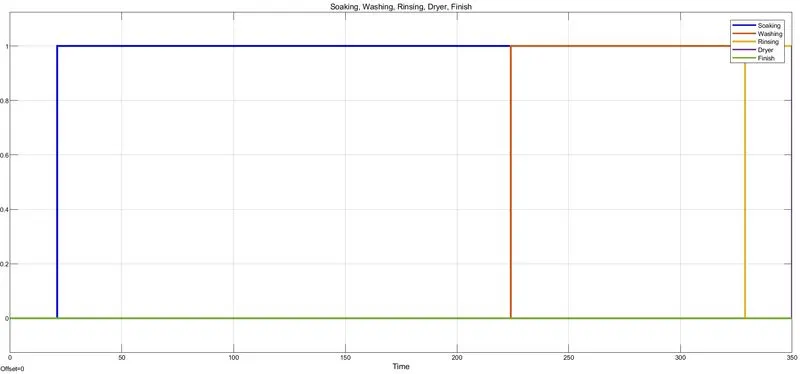
- Power ON & Water ON; t= 420 Sec Finish ON;
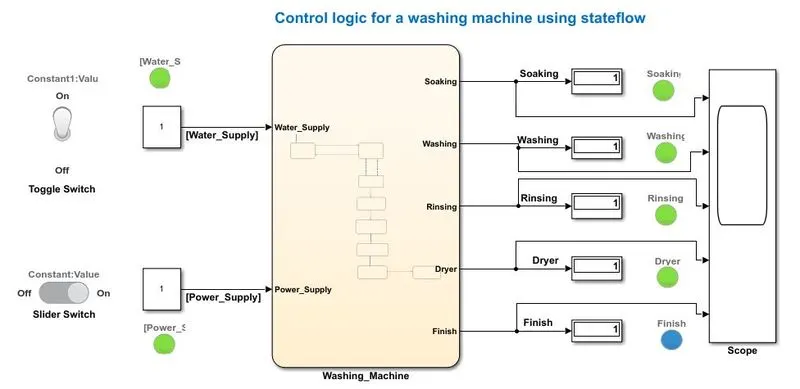
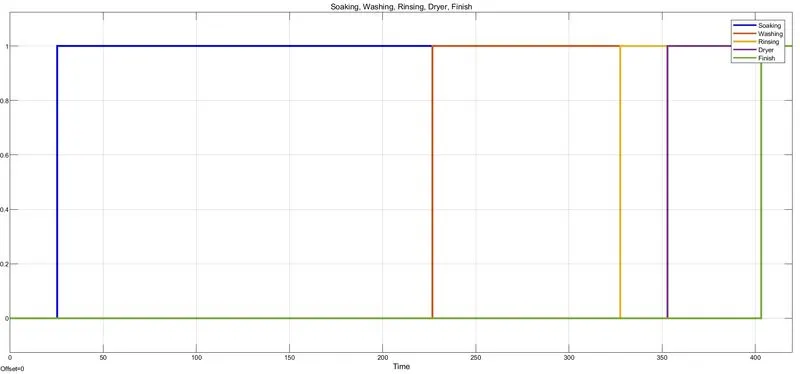
Conclusion: Simulation model and output from scope are showed that the control logic for washing machine using state flow is working properly and has given good results.
Q2.
Aim: To make a simulink chart for the " Gear Shif " logic as per given conditions.
Conditions:
-
Speed Range(kmph) Gear Shift 0 to 15
16 to 25
26 to 40
41 to 60
above 61
1
2
3
4
5
- Give the speed input while the simulation is running and disply the gear number.
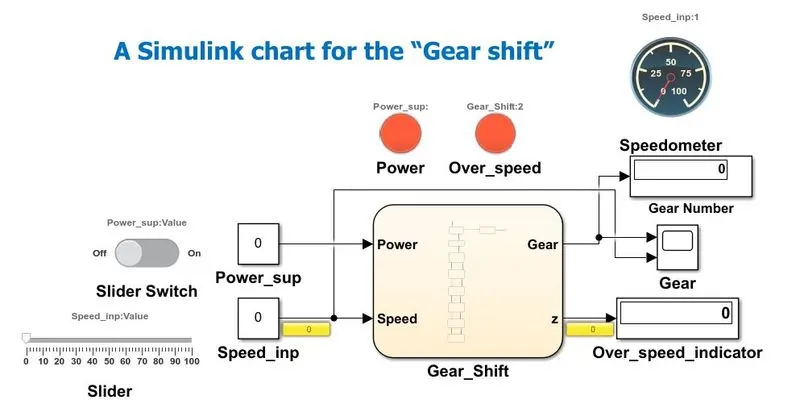
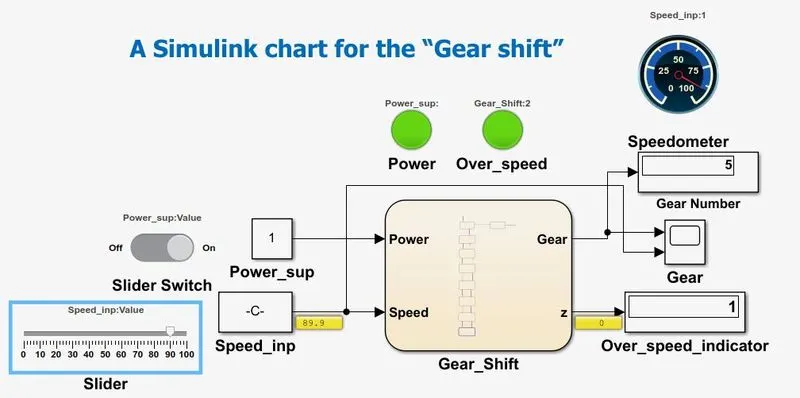
Simulink Model for Gear Shift:
Control Logic using State Flow:
Explanation:
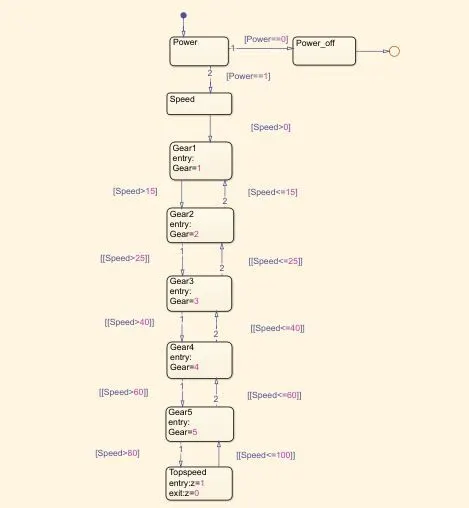
- To create a Simulink model of gear shift create a Stateflow chart and start with the power block which is connected to the breakpoint and a junction with power=-0 condition and connected to speed block(state) power-=1 so that when the speed is above 1 the process will start flowing to gears.
- Here I have mentioned speed to Conway our conditions as above speed greater than zero the gear shift should start the cycle of changing to next gear.
- In gear one, the breaking point is mentioned up to 16 then it is respectively changing till speed 61.
- From gear five till gear one there up arrow(breaking point) the speed is decreased toll zero so that we can shift our gear not only increasing it can be decreased too.
- Additional state mentioned as 'Over Speed' So that if the speed is been increased above 80 there is a lamp which indicates over speed in our Simulink block.
- After completion of our chart, we can see the inputs power and speed, outputs gear and top speed (Z).
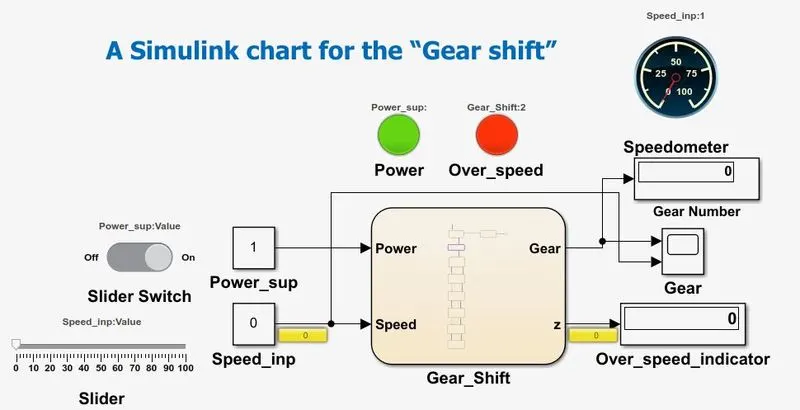
- I have connected the two constants to power and speed so that when the switch is on the power will be indicated from the lamp which is green in color. Speed is connected to a slider which requires manually increasing the speed.
- From the output of gear, I have connected terminator so that it stops the data flow and to view the gear shifts I have connected to the gear shift indicator. and Over speed(z) is connected to display and the display is connected to a lamp which shows over speed so that the lamp will indicate when the speed increased above 80.
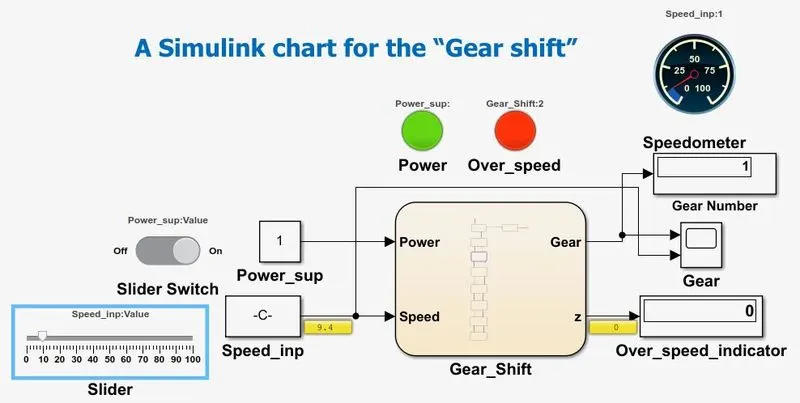
- I have connected it to the slider to the speedometer to view the speed in the speedometer.
Operation and Results:
- Power: ON , Speed: OFF , Gear Number: 0;
- Power: ON , Speed: 0 to 15 , Gear Number: 1;
- Power: ON , Speed: 16 to 25 , Gear Number: 2;
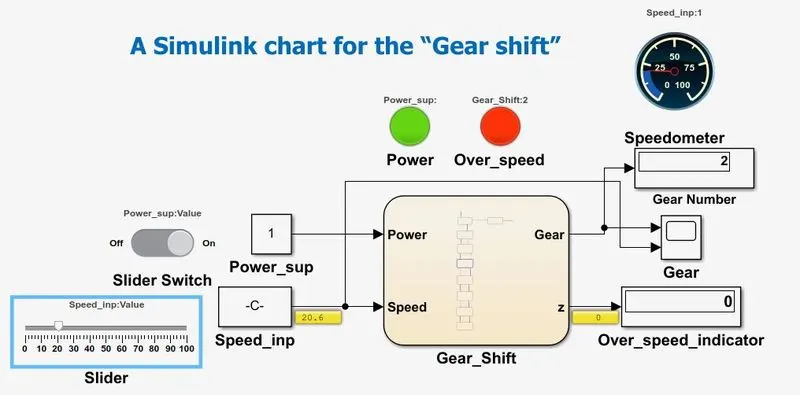
- Power: ON , Speed: 26 to 40 , Gear Number: 3;
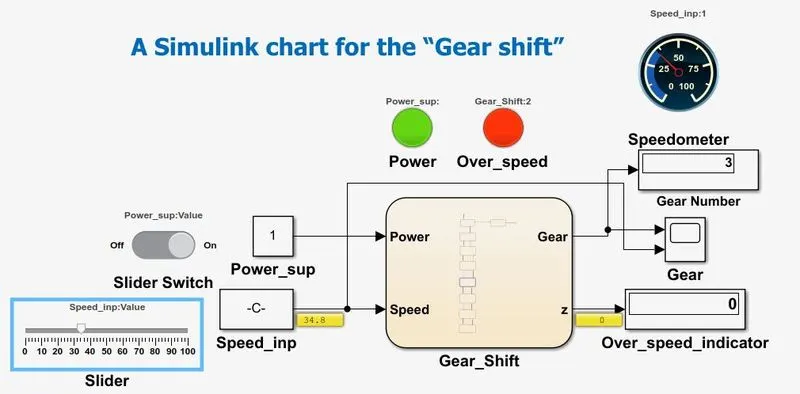
- Power: ON , Speed: 40 to 60 , Gear Number: 4;
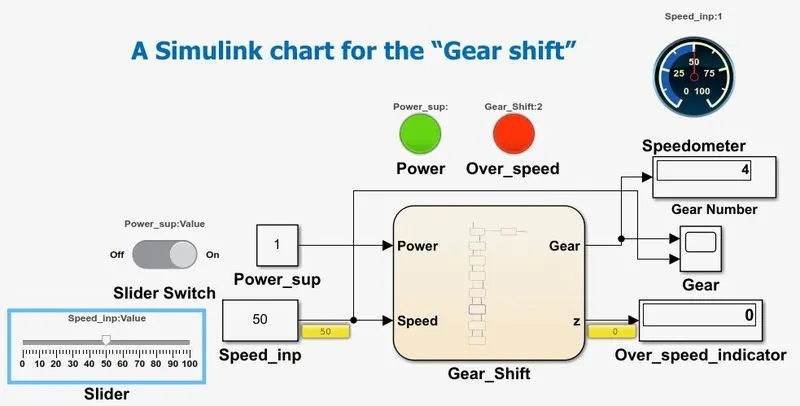
- Power: ON , Speed: above 60, Gear Number: 5;
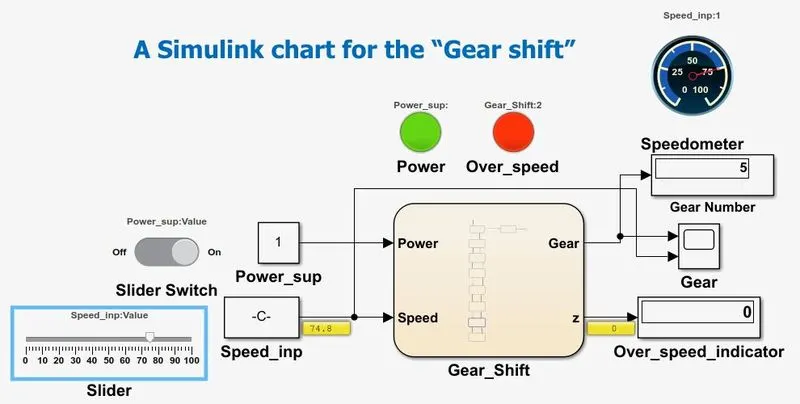
- Power: ON , Speed: 80 t0 100 , Gear Number: 5 , Over Speed Indicator :1;
- Waveform of Speed and Gear Shift in Scope:
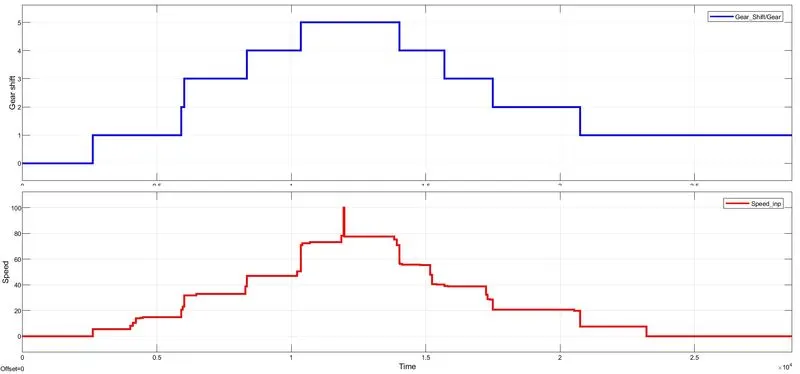
Conclusion: Output from Scope,Lamp Indication, and Over speed indicator are showed that the Simulink chart for the Gear shift and control logic using state flow are working properly and has given good results.