Week - 4
1) Implement control logic of a “washing machine” using Stateflow as per given sequence:
- If the power supply is available, the system gets activated
- If the Water supply is not available, stop the process & indicate through LED
- Soaking time should be 200s followed by Washing time of 100s.
- Then rinsing happens for next 20s & dryer runs for 50s
After all the processes have completed turn on the finished LED
Aim:
- To represent the working of a washing machine using stateflow as per the below sequence
- If the power supply is available, the system gets activated
- If the Water supply is not available, stop the process & indicate through LED
- Soaking time should be 200s followed by Washing time of 100s.
- Then rinsing happens for next 20s & dryer runs for 50s
- After all the processes have completed turn on the finished LED
Procedure:
- create a chart using the chart command .
- Double click on the chart block to enter into the stateflow mode and create the state flow.
- Drag the state blocks from the left pane and connect them according to the given sequence.
- Add the required conditions after each stage for the process to happen.
- The state flow for the above process will be as follows
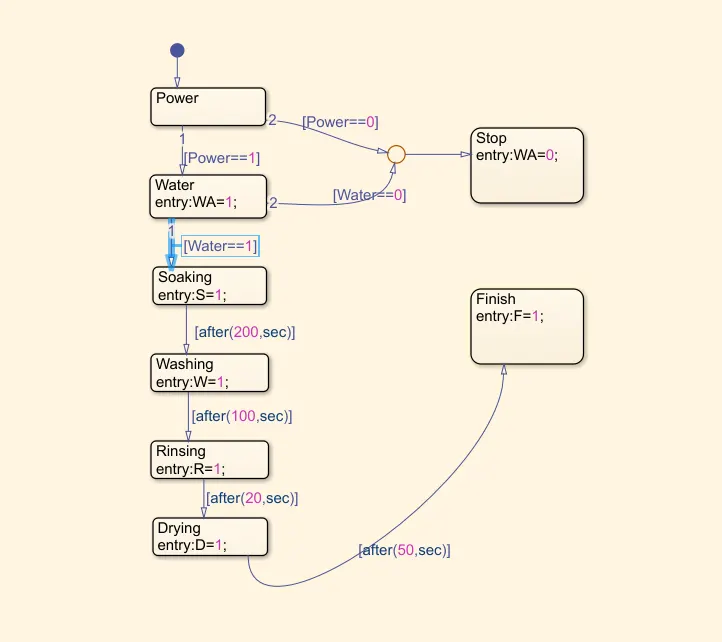
- From the above stateflow we can understand that the machine will work only if power supply and water supply is available.
- If any of the above condition is false the machine will stop working.
- If both the condition is true then the soaking process will be carried out for 200sec.
- After soaking process Washing process will be done in 100sec
- the rinsing will be carried out for 20 sec followed by drying for 50 sec, after which the process will be finisged.
- Now go to the tools tab and select the model explorer option to assign the input and output variables as follows.
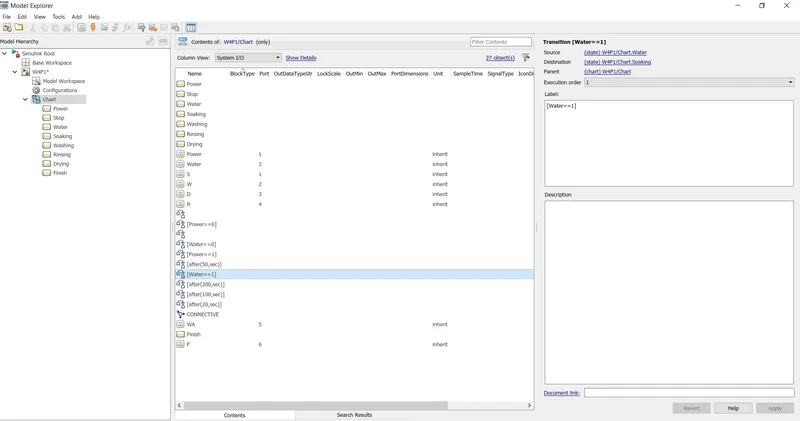
- I have assigned Power & Water as input variables to know their status and S, W, R, D & F as output variables to represent the each stage such as soak, wash, Rinse, Dry & Finish respectively.
- Now go back to the simulink window where you can see the whole state flow in a chart and the input and output variables assigned as well.
- create two toggle switch ro give input to the constants for power supply On/Off & water supply On/off.
- Display is connecte to each outputs to know the state of the process.
- Lamps are coneected to the water supply input to check the water availability (green indicated water availability and red indicates the non availabiliy of water supply)
- Second lamp is connwctd to the stop command in case of nthe non availability of water/ power supply. (Green indicates the condition for power and water is true and red indicates that the condition is false)
- Third lamp is used to indicate that the process is finished/noy finisged (green lamp indicates the full process is finished & red lamp indicates that thae process is not finished)
- change the simulation time to 500 sec and on the simulation tab click on the pacing option and change its value to 25
- The Model will be as follows.
- Condition 1 - where all coonditions are true
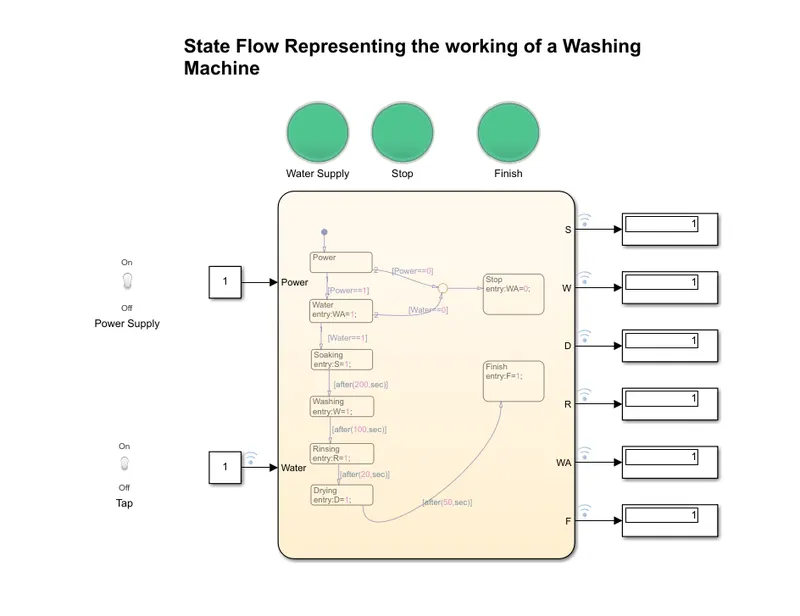
- In the above model we can see that the power suplly is on, water is available so all our laps are turned green and output displays 1
- Condition 2 -Power supply is not available
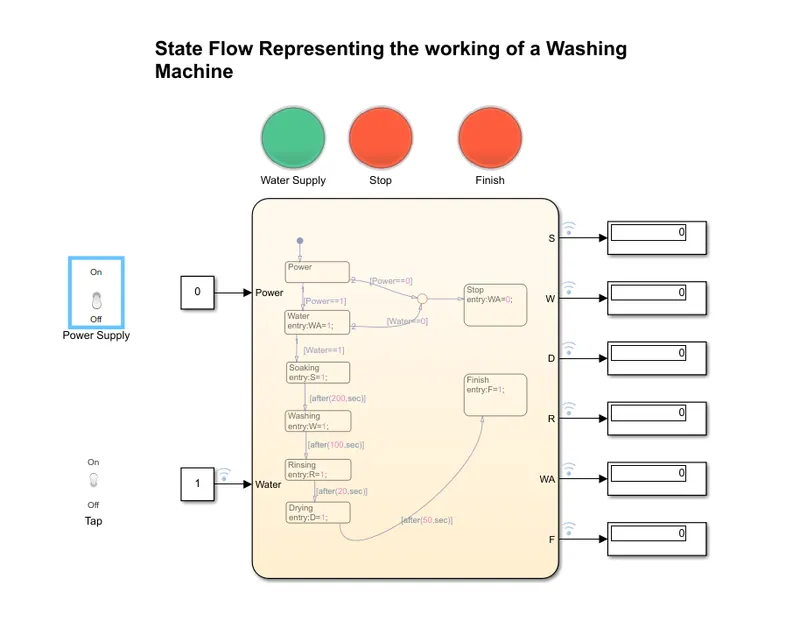
- In the above model we can see that the output diplays 0 as power supply is not available and the lamps indicate red as the process is not finished except the first lamp which indicates the water availability
- Condition 2 -Power & supply is not available
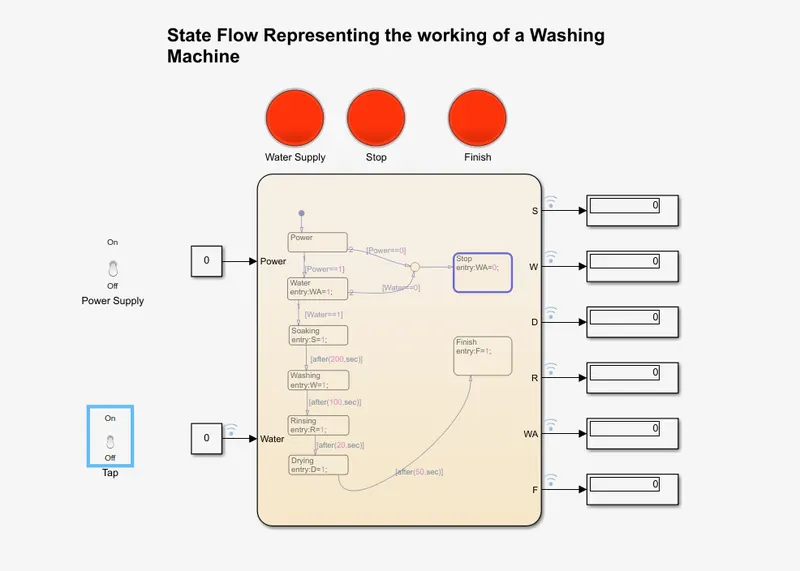
- In this case as all the condition is false the lamps indicate red colour and the output is displayed as 0
2) Make a Simulink chart for the “Gear shift” logic as per below conditions:
Speed Range(kmph) Gear
0 to 15 1
16 to 25 2
26 to 40 3
41 to 60 4
Above 61 5
Give speed input while the simulation is running & display the gear number.
Aim:
- To create the simulink chart as per the below conditions
-
Speed Range(kmph) Gear
0 to 15 1
16 to 25 2
26 to 40 3
41 to 60 4
Above 61 5
Give speed input while the simulation is running & display the gear number.
Explanation :
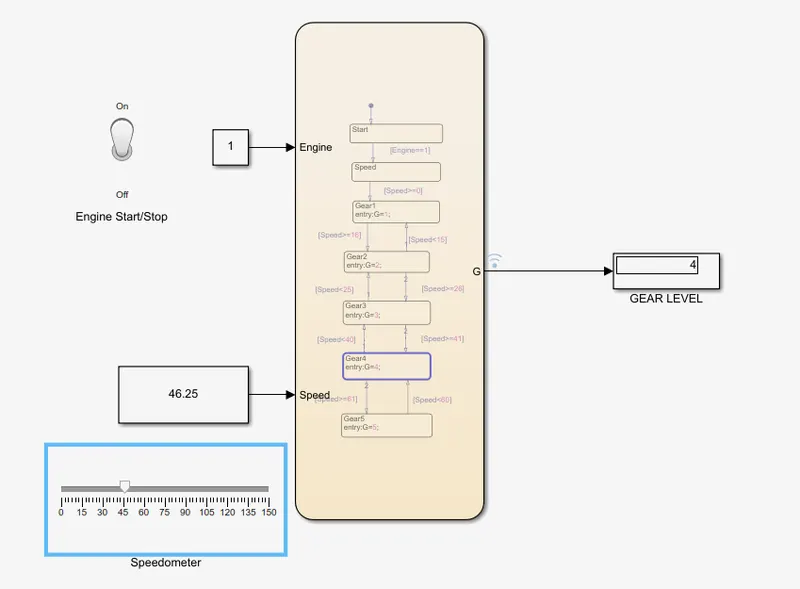
- Create a simulink chart as shown below
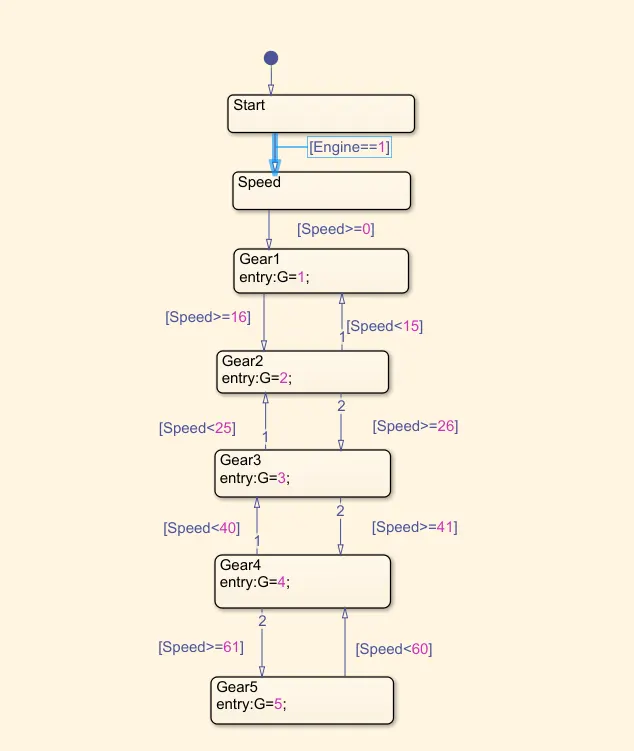
- As per the above chart it is clear that we have assigned 5 gears with certain conditions at which spped each gear shouls get activated.
- We can see that once the engine gets ignited and if the speed of the vehicle is >0 &<=15Gear 1 gets activated.
- If the the speed is >=16 & <=25 gear gets shifted to gear 2
- If the the speed is >=26 & <=40 gear gets shifted to gear 3
- If the the speed is >=41 & <=60 gear gets shifted to gear 4
- If the the speed is >=61 gear gets shifted to gear 5
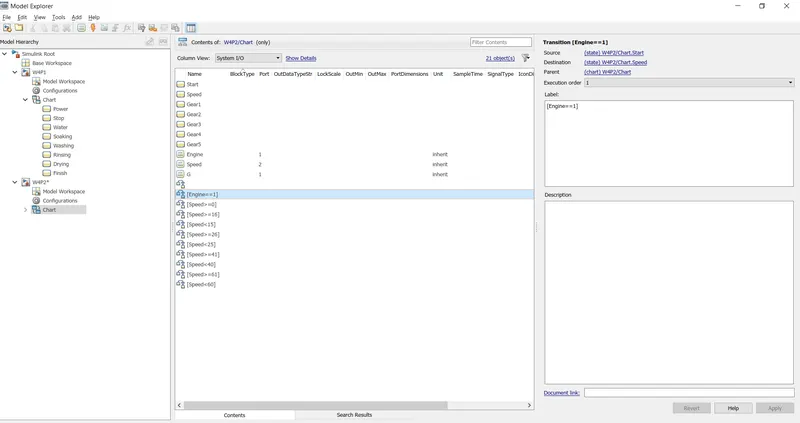
- Assign the input variables as engine & speed and output variable as gear level.
- Now in the simulink window add a toggle switch for engine start stop function and a slider block which acts as an accelerator in our case.
- The output can be connedted to as display to know the gear level.
- The model is as follows.
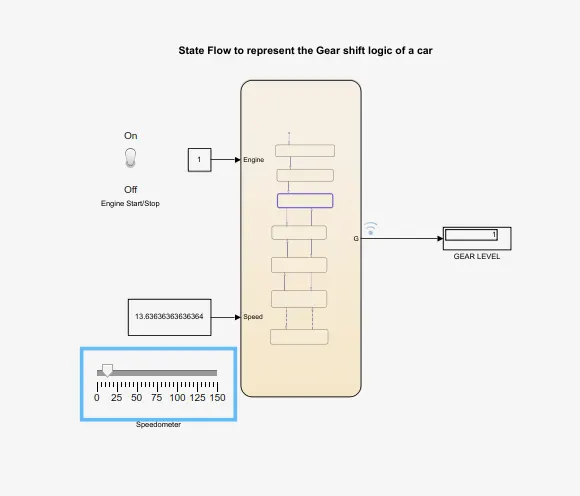
- In the above model we can see that as the speed is 1.36Km/hr our gear in the dispaly is 1
- Now on changing the speed our gear changes accordingly.
- Say for example our speed is around 46 our gear will be as follows