Week - 4
- Implement control logic of a “washing machine” using Stateflow as per given sequence:
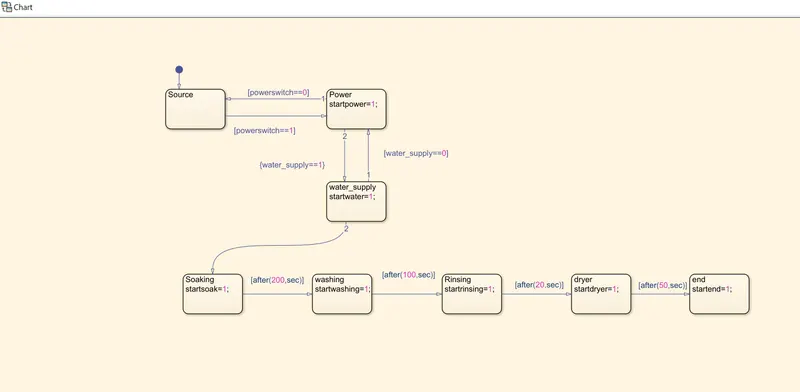
- If the power supply is available, the system gets activated
- If the Water supply is not available, stop the process & indicate through LED
- Soaking time should be 200s followed by Washing time of 100s.
- Then rinsing happens for next 20s & dryer runs for 50s
After all the processes have completed turn on the finished LED ?
Ans:
For the implement of this to the control logic to washing machine we need the blocks in simulink i.e..,
- CHART
- CONSTANT
- ROCKER SWITCH
- DISPALY
- LAMPS
CHART:
This block is used to create a logic of washing machineas per given conditions and time. as shown in below
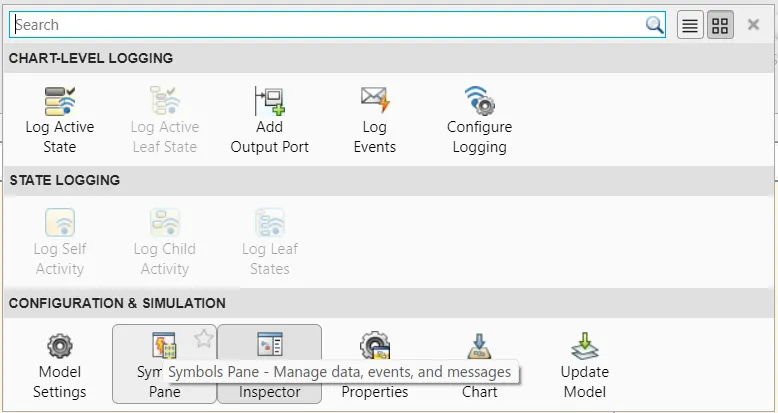
after creating the logic we need to assign the symbols pane and access the permisiion and porty values for output. as shown in fig.
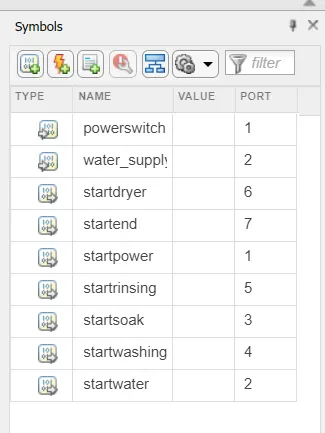
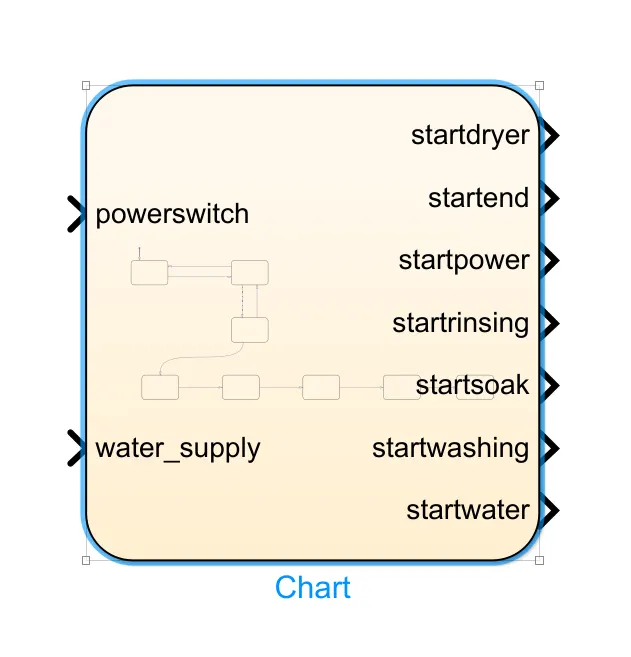
after cerating a logic and symbol pane this block will appears
CONSTANT/SWITCH:
here it is the inputs and output blocks to connect the chart.
here we need to connect the input signal for power and water supply, for this we neeed to connect the constant value for the block .
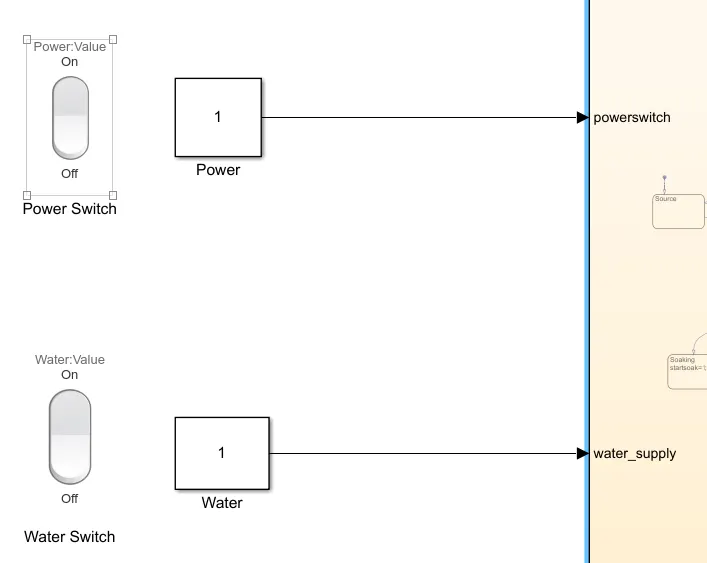
here we conncet the constant blocks to the input signals and the ,rocker switch is connect to constant blocks which the value of constant shows the indicator "on/off'
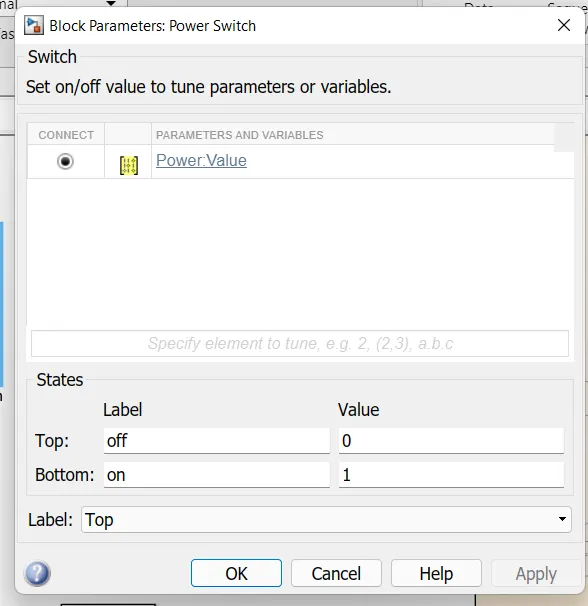 here we assgin the switch on/off values then
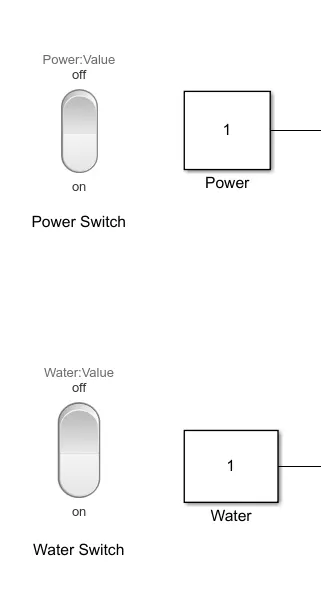
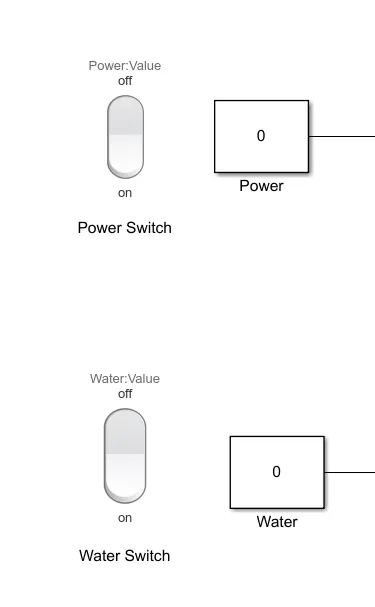
in these blocks value 1 gives the switch 'on' & value 0 gives the switch'off'.
DISPLAY/LAMP:
And the ouput signal is connected to the dispaly blocks for the output
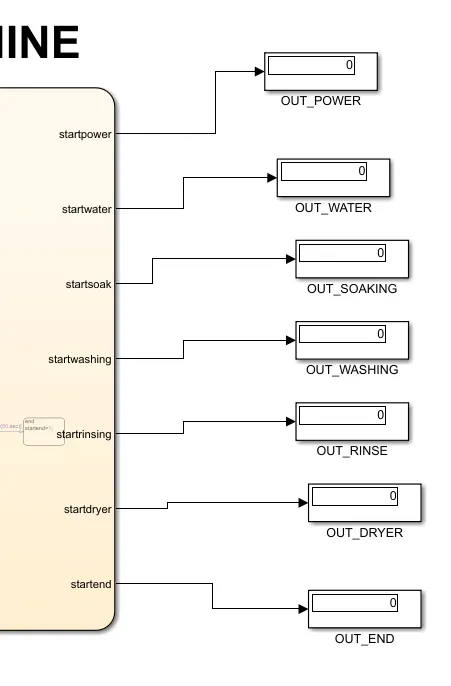
These output values are shows the process of the logic is corect or wrong and we need to check the garphical we need to connect the lamp for all display blocks
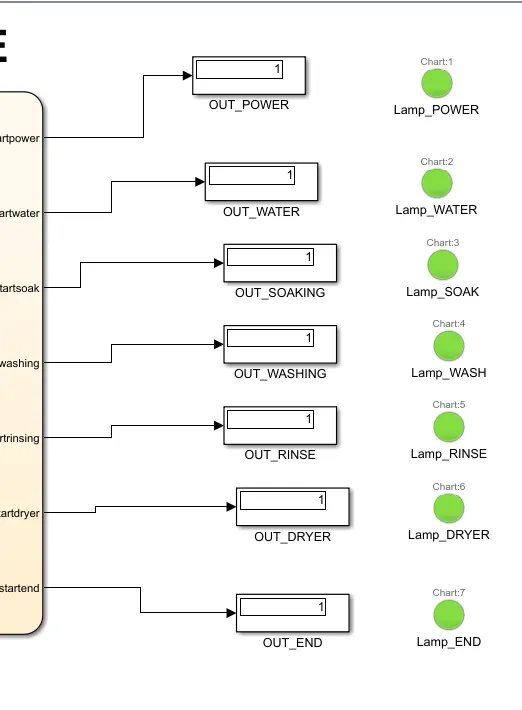
and then we need to assign the values for the lamp which the logic gives in the chart its gives the perfect output as shown in given below.
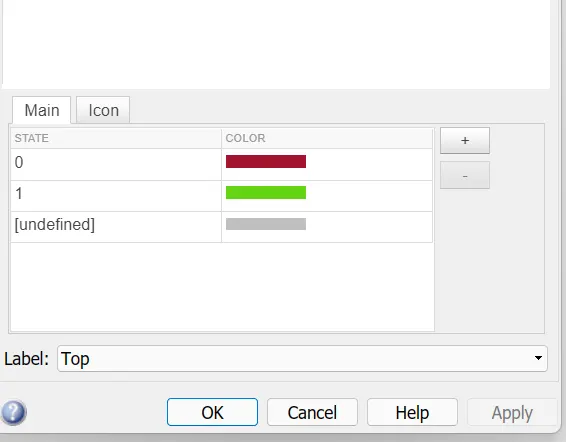 here 0 gives the red color signal because it stops the process & 1 gives the green color siggnal it shows correct the proceess and goes next one .
And finally give the runnibg time as per given taken time for the process to the washing maching running sequence options on the chart
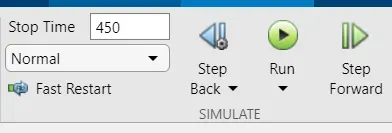
After giving the time we need to run the simulation to gives the values of power and water values is '1',then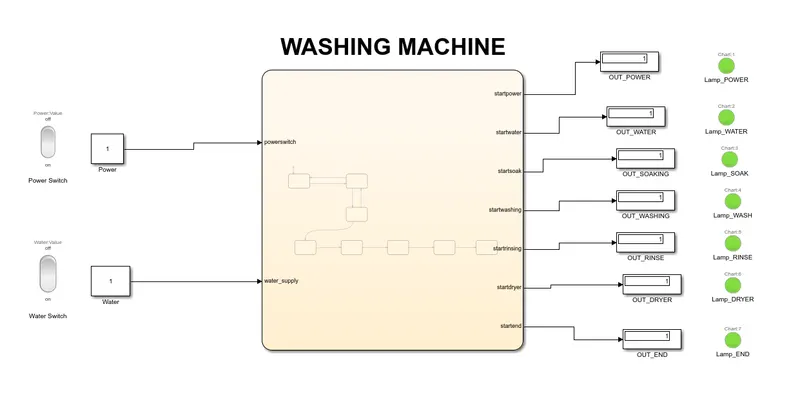
here the lamp shows all the green signals then it is correct all the process .
WHEN WATER SUPPLY IS OFF THEN:
We need to off the water switch to assgin value is '0' then run the simulation
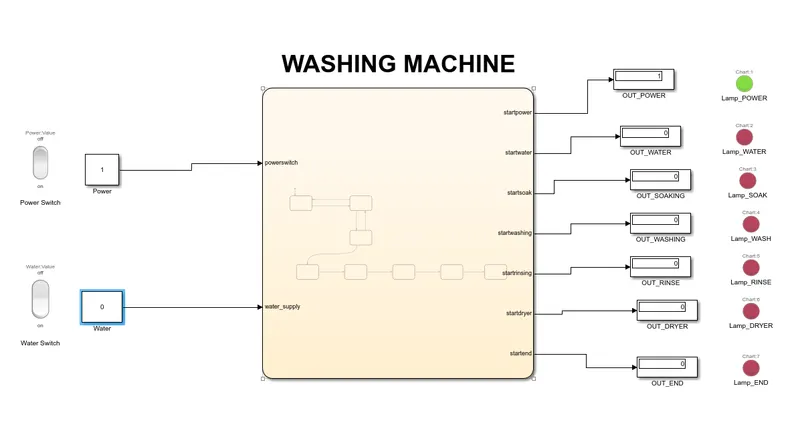
here we stop the water the process all shows red dignal then it is not simulate because without water clothes didn t wash.
SWITCH OFF THE POWER :
We need to assgin the power switch value is '0' then run the simulation.
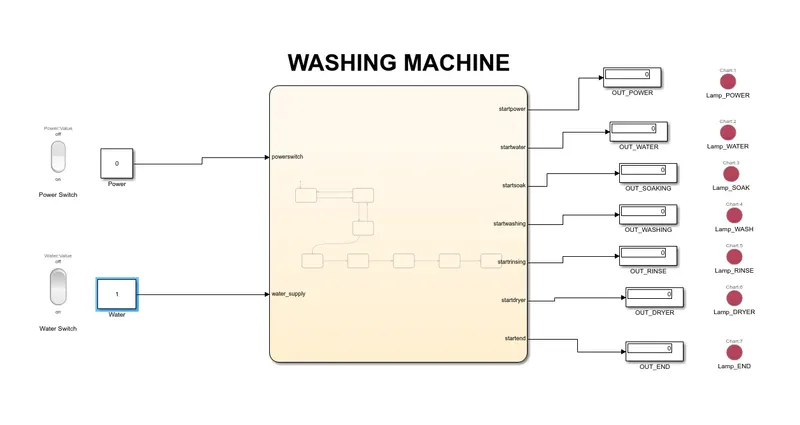
here we switch off the power and swicth on the water but these shows all the red signals because without power supply no action will done in the machine,it all stops the porcess.
FOR THE WASHING MACHINE SIMULATION CHECK THE BELOW FILE "week_4_0".
2. Make a Simulink chart for the “Gear shift” logic as per below conditions:
Speed Range(kmph) Gear
0 to 15 1
16 to 25 2
26 to 40 3
41 to 60 4
Above 61 5
Give speed input while the simulation is running & display the gear number.
Ans: We need to simlate the gear shift logic we need the simulation blocks which is
- CHART
- CONSTANT
- SLIDER
- DISPLAY
- LAMP
CHART:
In the chart we create a logic as per given conditoins on the block for gear shifting
Speed Range(kmph) Gear
0 to 15 1
16 to 25 2
26 to 40 3
41 to 60 4
Above 61 5
for these we need create a logic in chart block then
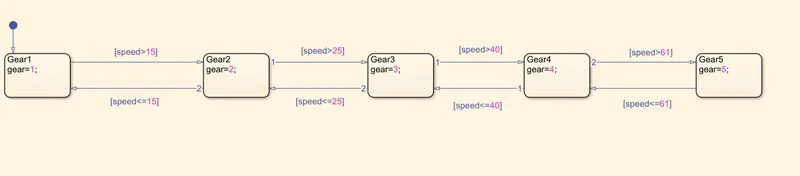
and assgin the symbol pane for two outputs like only speed and gear; then the symbol pane is
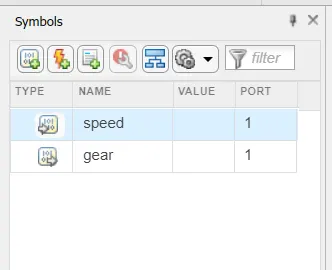
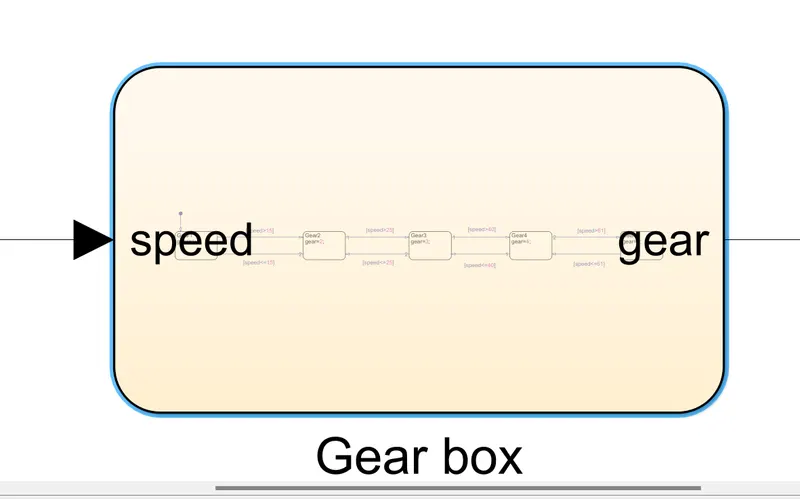
it gives only the one input & one output values as "speed & gear".
we need to connect the input blocks to the chart.
CONSTANT /SLIDER
Constant block which is assign speed input to the chart.
and teh slider is connected to the speed block.
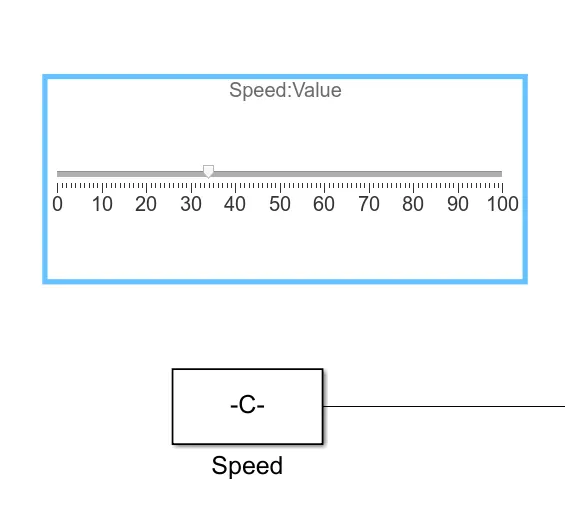
SLIDER:It is used to assgin the value of speed by adjusting the arrow in slider block
We need to output signals to the chart
DISPLAY/LAMP:
It gives the value of speed which is in the gear then it shows the gear position and the lamp is connected to the display.
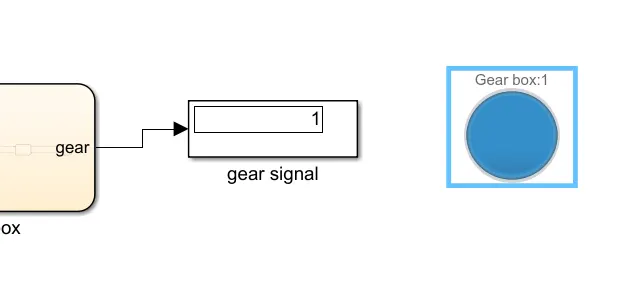
in the lamp we assign differnt colors for different gear shifts then it is
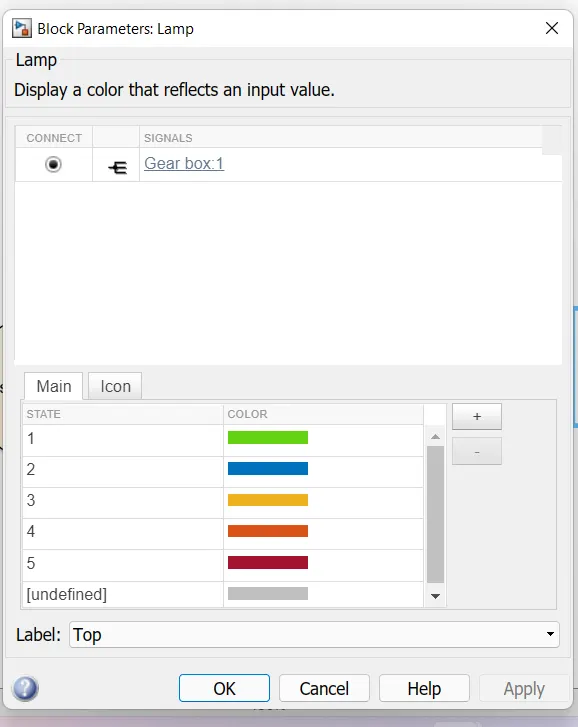
here we give 5 different colors for 5 gear shifts
Speed Range(kmph) Gear Color
0 to 15 1 Green
16 to 25 2 Blue
26 to 40 3 Yellow
41 to 60 4 Orange
Above 61 5 Red
after this we need to run the simulation for differnt value of speed
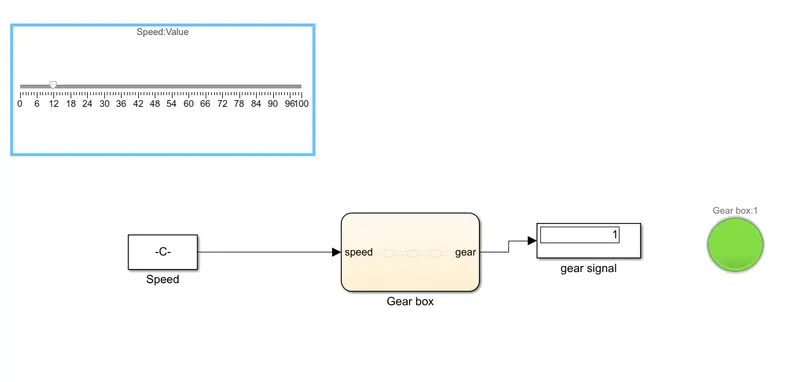
here i give teh below 15 speed it shows "gear1".
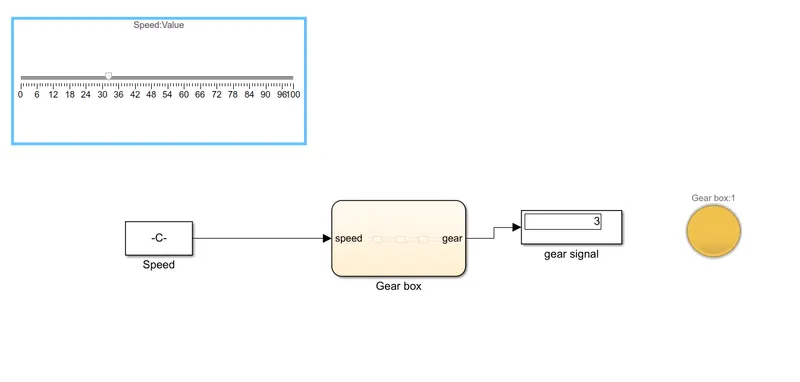
we assign differnt value its shows "gear3" then it is value above 25
we need to set the slider at 90 speed then
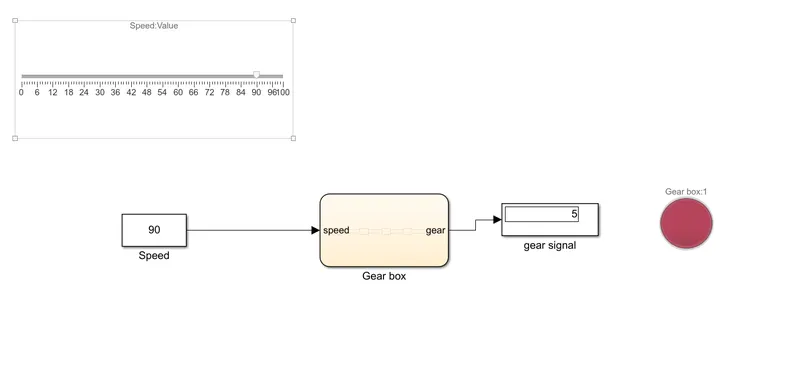
it shows the gear 5 because the gear 5 speed is above 61
and also we need use the knob block to assign the speed to chart
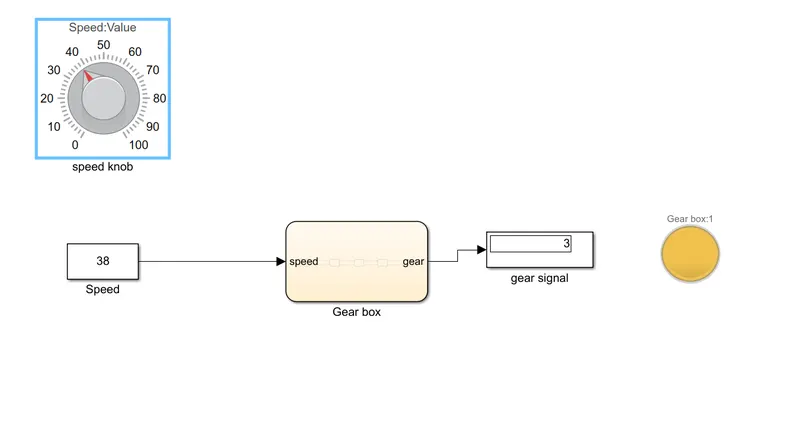
FOR THE GEAR SHIFT SIMULATION CHECK THE BELOW FILE "week_4_2".