Week - 4
>> Q1: Implement control logic of a “washing machine” using Stateflow as per given sequence:
- If the power supply is available, the system gets activated
- If the Water supply is not available, stop the process & indicate through LED
- Soaking time should be 200s followed by Washing time of 100s.
- Then rinsing happens for next 20s & dryer runs for 50s
After all the processes have completed turn on the finished LED
Solution:
The model explanation:
- To implement a control logic of a washing machine using state flow as in above asked sequence, the below blocks are used
- Slider switch block
- Constant block
- Chart block
- Display block
- Lamp block
- Slider block is used to turn on and turn off the power and water supply.
- Constatnt block is used to give the inputs(Power and Water) to the system.
- Chart block is used to to implement the state flow logic of a washing machine.
- Display block is to visualize the state’s output.
- Lamp block is to indicate "the process completed" signal through LED.
Model
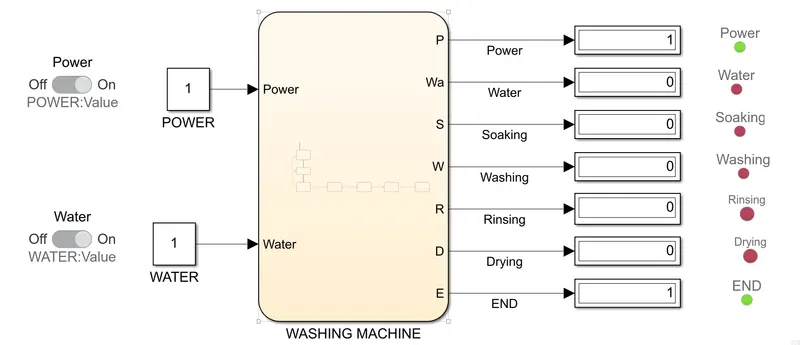
Inside the chart mode, I have implemented the control logic of a washing machine with the help of state blocks 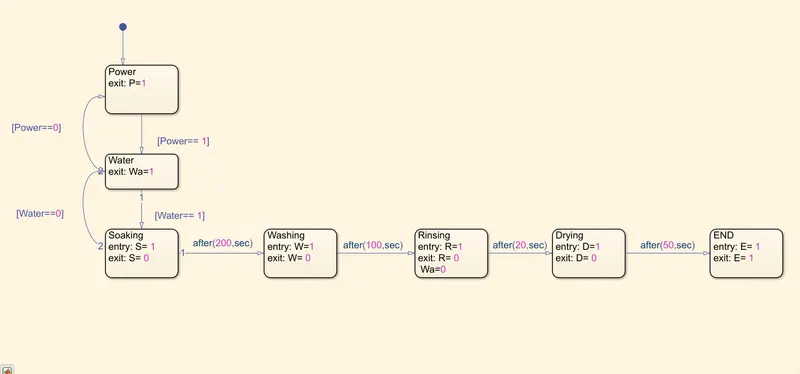
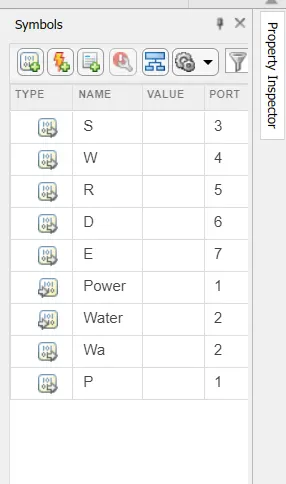
- Here, the power and water are given as input data.
- D, R, S, W and E are given as output data.
- The POWER input is given to the chart with the help of slider switch and constant blocks, the power input is connected to the POWER State, if Power==1 (power supply in ON) the power lamp shows the green LED, the power state is connected to the WATER block. If Power==0(Power supply is OFF) the process will not move further.
- The WATER input is given to the chart with the help of slider switch and constant blocks, the water input is connected to the WATER state, if Water==1(Water supply is ON) the water lamp shows the green LED, it moves to the next stage. If Water==0(Water supply is OFF) it will not allows the process to move further.
- After successfully completion of the above 2 process WATER state will be connected to SOAKING state, ‘S’ (soaking) is given as 1 for entry and 0 for exit. After 200 seconds the process moves to WASHING state.
- In the WASHING state, ‘W’(washing) is given as 1 for entry and 0 for exit. After 100 seconds of washing state, the process moves to next state.
- The next state of WASHING state is RINSING state, ‘R’(rinsing) is given as 1 for entry and 0 for exit. After 20 seconds washinbg state the process moves to the next state.
- The next state of RINSING state is DRYING state, ‘D’(drying) is given as 1 for entry and 0 for exit. After 50 seconds the process moves to the next state.
- The next state of DRYING state is END, ‘E’(end) is given as 1 for entry and the exit is also given as 1.
- Each and every state block (Power, Water, Soaking, Washing, Rinsing, Drying and End) are connected to individual Lamp block to indicate the output signal in the form of LED light.
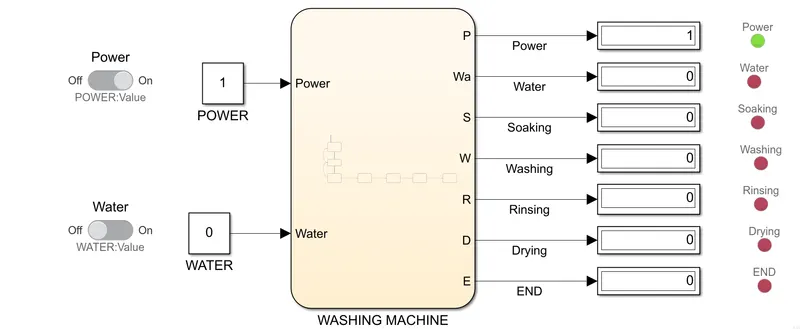
- When the power supply is 'on' and the water supply is 'off', only the power lamp shows the green LED, remaining all the lamps shows the red LED, because the process is not running.
- When the power and water supply is 'on' only the Power and END lamps will show the green LED, that means all the processes are completed successfully.
(we can visualize the green colour only when the process is running, if the process is not running or completed the lamp shows red LED)
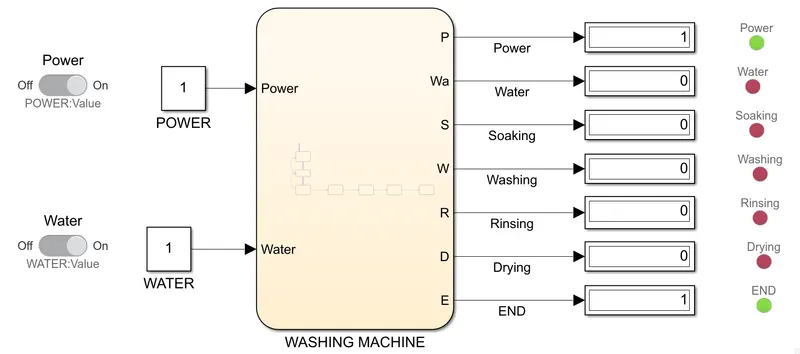
In the above image the Power and END lamps are showing green colour because the power supply is 'on'.
-------------------------------------------------------------------------------------------------------------------------------------------
>> Q2. Make a Simulink chart for the “Gear shift” logic as per below conditions:
Speed Range(kmph) Gear
0 to 15 1
16 to 25 2
26 to 40 3
41 to 60 4
Above 61 5
Give speed input while the simulation is running & display the gear number.
solution:
The model explanation:
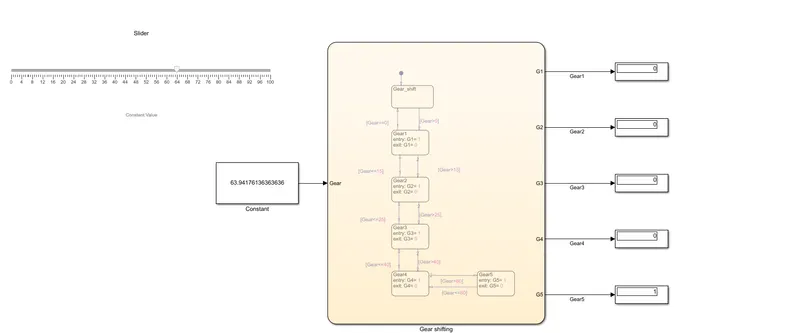
-To make the simulink chart for the gear shift logic as per the above conditions, I have used below blocks
- Slider block
- Constant block
- Chart block
- Display block
Model
Symbols pane
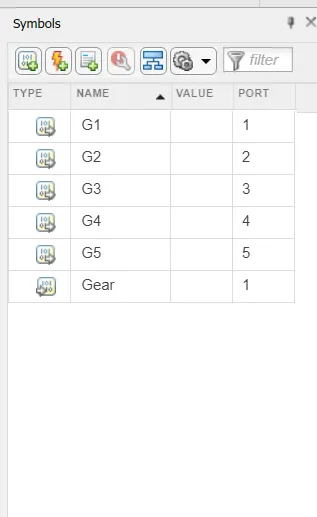
- The Gear is given as input data.
- G1, G2, G3, G4 and G5 are given as output data.
- I have used the Slider block to give the input (speed) to Constant block, here the slider speed is varies, by changing the slider position manully to put the required input.
- With the help of Constant block the slider block input values are given to the Chart.
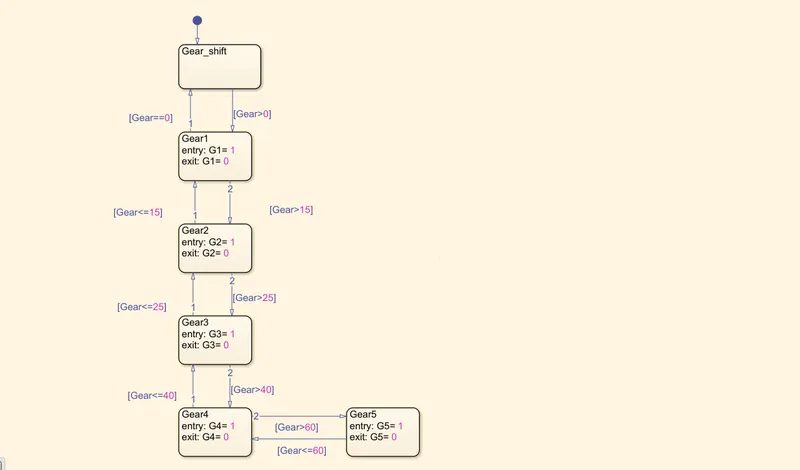
- The State blocks are used inside the chart to implement the conditioned state flow'
- First, the input values are given to the GEAR_SHIFT state, according to the condition, 'Gear>0', it proceeds to the next state or else 'Gear==0' it ends process(it doesn't change shift's to the next gear).
- If 'Gear>0' it moves to the GEAR1 and when the input value crosses 15kmph, it moves to the next state (GEAR2) otherwise it will remains at GEAR1 state.
- If the 'Gear>15' it moves to GEAR2 and it will remains at GEAR2 till the speed is less than 25kmph, if the speed exceeds 25kmph it moves to GEAR3.
- If the speed lies between 25kmph to 40kmph the gear will be at GEAR3 state, once the speed exceed 40kmph it will moves to GEART4.
- If the speed lies between 40kmph to 60kmph the gear will be at GEAR4, if the speed exceeds 60kmph it moves to GEAR5.
- The Display blocks are connected to the chart outputs(G1, G2, G3, G4 and G5) to show the gear position, if the display block of G1 shows 1 means the gear is at GEAR1 position and the remaining display blocks shows 0. In same manner each display block shows 1 for respective gear position.