Week - 4
#Implement control logic of a washing machine using state flow using given sequence.
- If the power supply is available the system gets activated.
- If the water supply is not available, stop the process and indicate through LED.
- Soaking time should be 200s followed by washing time of 100s.
- Then rinsing happens for next 20s and dryer runs for 50s.
After all the process have completed turn on the finished LED.
Ans:
The washing machine consists of 4 processes such as
- Soaking
- Washing
- Rinsing
- Drying
The blocks used to implement control logic of a washing machine using state flow are given below
Toggle switch: This switch is used as power supply switch and water supply switch as shown in the fig. This switch toggle between 1 and 0 state i.e when switch is ON it is at state 1 and when it is OFF it is at state 0 which is given as a input to the chart.
Constant: This is connected with toggle switch when the switch is ON it shows 1 and when switch is OFF it shows 0. We can change the switch state by entering 0 or 1 in the constant block since they are interconnected.
Stateflow chart: A Stateflow chart is a graphical representation of a finite state machine. We can use Stateflow chart to control a physical plant in response to events such as a temperature, time etc . A Stateflow chart can use MATLAB or C as the action language to implement control logic.
Stateflow chart for Washing machine model:
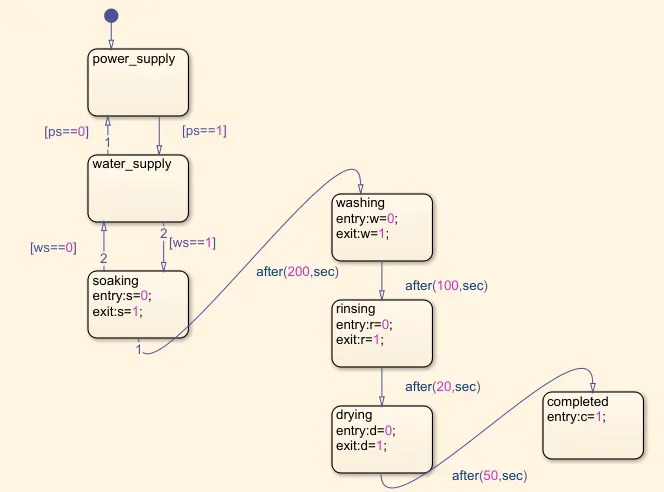
According to the conditions given in the question the stateflow chart is made i.e
- When the power supply (ps) is ON then only the process will continue and same condition is applicable for the water supply (ws). If either of the condition is not satisfied the process will not start. So only the positive conditions were given to the further block.
- As given in the question Soaking process should run for 200secs so we mention it as after (200, sec). It is given with entry value as 0 and exit value as 1.
- So in the same way the time is differ for remaining process such as washing=100sec, Rinsing=20sec and drying =50sec remaining will be same.
- After completion of all the process the last block i.e completed block given with an entry value of 1.
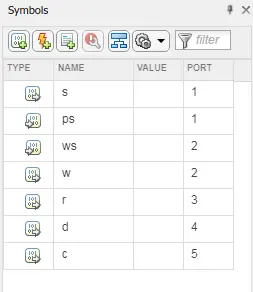
Symbols pane: Here ps and ws are input. S (soaking), w (washing), r (rinsing), d (drying) and c (completed) are output.
Display: Each display is connected to the respective outputs. It shows the output value as 1 or 0. If it shows 1 then that process is completed if it shows o then the process is not completed.
Lamp: Each lamp is connected to the respective input and output. It shows green light when the value is 1 and shows red light when the value is 0.
The simulink model for washing machine:
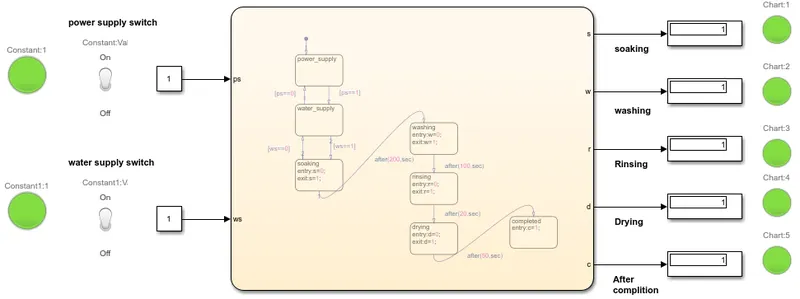
As shown above 2 constant blocks are given as input to the chart which are controlled by toggle switch (1=ON, 0=OFF). According to the input conditions the stateflow chart produces its output when both the switch is ON the washing process will start, followed by soaking for 200sec, washing for 100secs,rinsing 20secs and drying for 50secs finally completed block shows completion of operation.
Each input and output is assigned with a lamp block. This glows green light when input is 1 and glows red light when input is 0.
Result:
- When power supply switch is ON and water supply switch is OFF it is also indicated by LED and simulation run for t=400secs
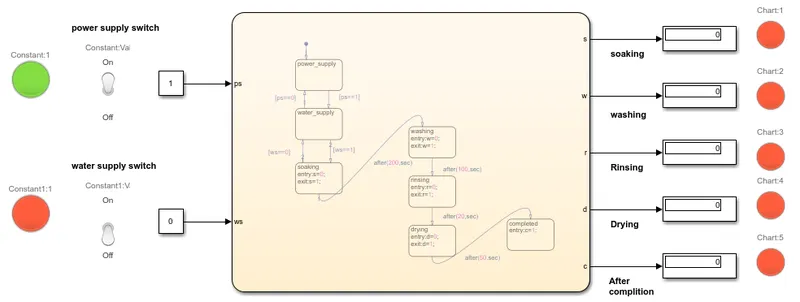
Hence as per the 1& 2 conditions i.e. power supply is ON but the water supply is not available the further process will not continue which can be observed in the above simulation output.
- When both the switches are ON and the simulation run for 350secs the simulation output is shown below
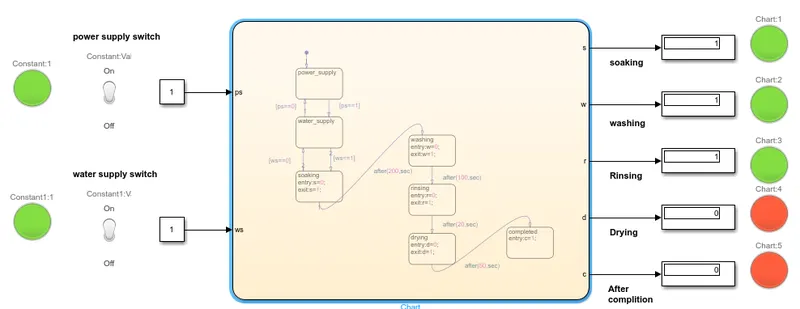
Hence depending on the time delay given the simulation runs to produce the respective output.
- When both the switches are on and simulation runs for 400secs the output is shown below.
Hence all the process in the washing machine is completed and is also indicated in the LED.
#2Make a simulink chart for the gear shift logic as for below conditions:
Speed in kmph Gear
0-15 1
16-25 2
26-40 3
41-60 4
Above 61 5
Give speed input while the simulation is running and display the gear number.
Ans:
The blocks used in simulink model are.
Constant: This block is used to assign the numerical value which is given as an input to the slider gain block.
Slider gain: This block produces the output which is the product of its input and a constant gain value. We can vary the gain value of the block even when the simulation is running.
Stateflow chart: A finite state machine is a representation of an event-driven system. In an event-driven system, the system responds to an event by making a transition from one state to another. This transition occurs if the condition defining the change is true.
Stateflow chart for Gear shift model:
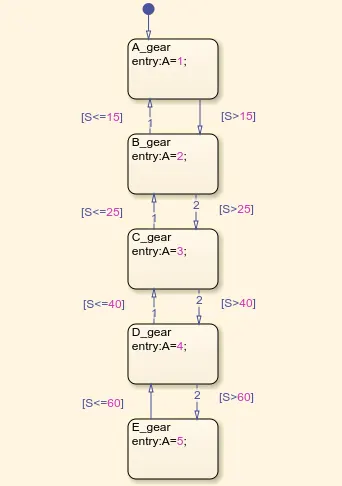
As per the conditions given in the question the gear number (A) is assigned according to the speed range i.e.
- Speed from 0-15kmph comes under gear 1
- Speed from 16-25kmph comes under gear 2
- Speed from 26-40kmph comes under gear 3
- Speed from 41-60kmph comes under gear 4
- Speed from above 61kmph comes under gear 5
Symbols pane: Here S (speed) is input and A (Gear) is output.
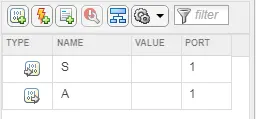
Display: It shows numerical data. The display connected in the input side shows the speed and the output side shows the Gear.
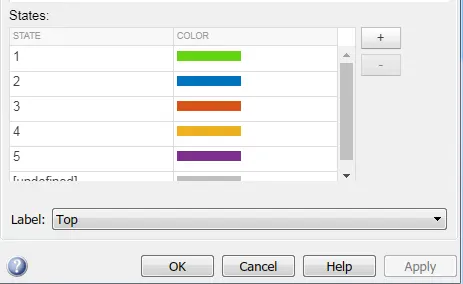
Lamp: This is connected to the output of the chart. It is assigned with different colors for each gear as shown below
Simulink model for Gear shift logic:
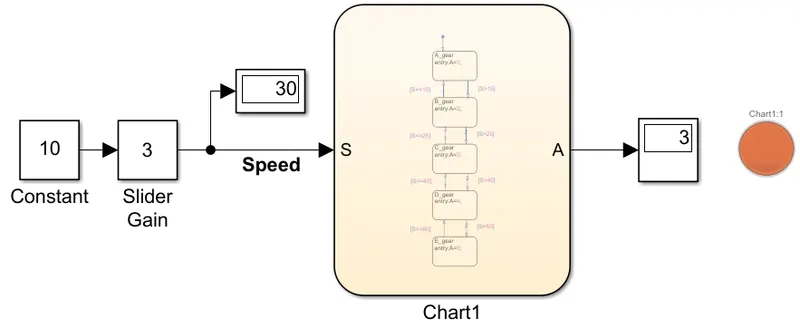
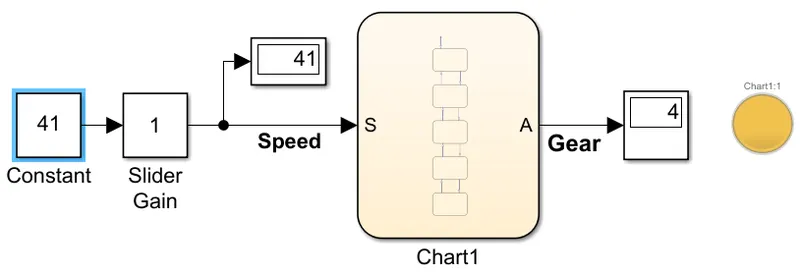
As shown above it as 2 inputs block which are constant and slider gain block whose value can be varied during the simulation is running to get the different speed values . The product of these blocks is given as input (speed) to the chart. The input value is shown in the display. According to input speed range, chart block produces its output i.e. gear value which is shown in the display. For each gear value the lamp block shows different color.
Since speed is 30kmph which is in between 26-40 range the gear is 3rd.
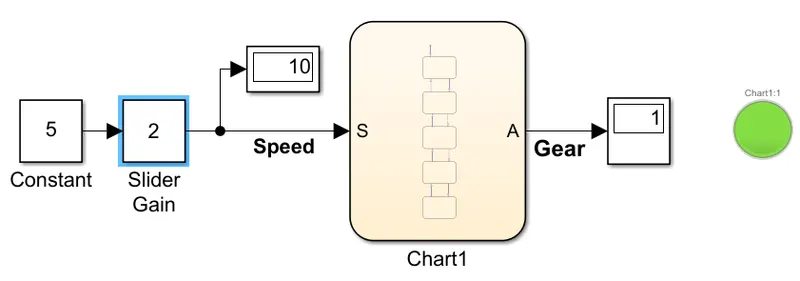
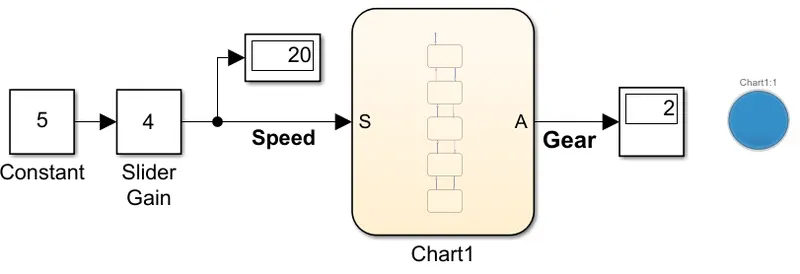
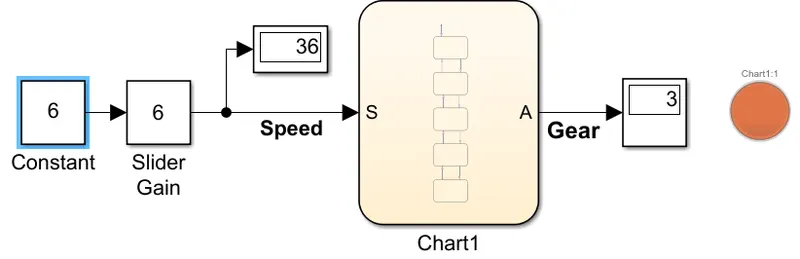
Result: The simulink models in different speed range are
- 1St gear, speed=10kmph
- 2nd gear, Speed=20kmph
- 3rd gear ,speed=36kmph
- 4th gear, speed=41kmph
- 5th gear, speed=70kmph
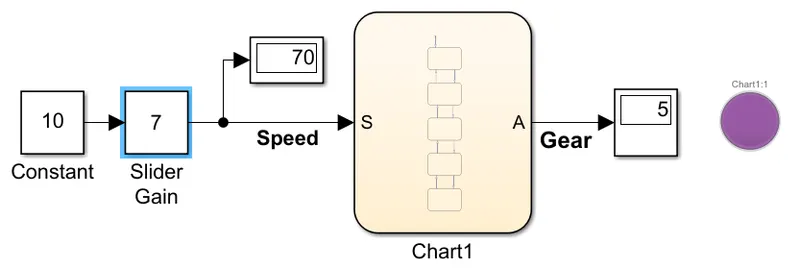
Hence for different speed ranges from 0-100 the assigned gears from 1-5 are displayed.