Week - 4
Aim:-To make a Simulink model using State flow for control logic of washing machine.
Theory :-
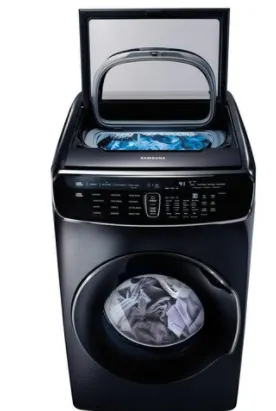
- A washing machine is a home appliance used to wash laundry. The term is mostly applied to machines that use water as opposed to dry cleaning or ultrasonic cleaners. The user adds laundry detergent either in liquid form or powder form to the wash water.
- The requirements to run the machine are power supply and water supply, and it performs cleaning process of clothes by soaking ,washing rinsing and drying ,and many more process.
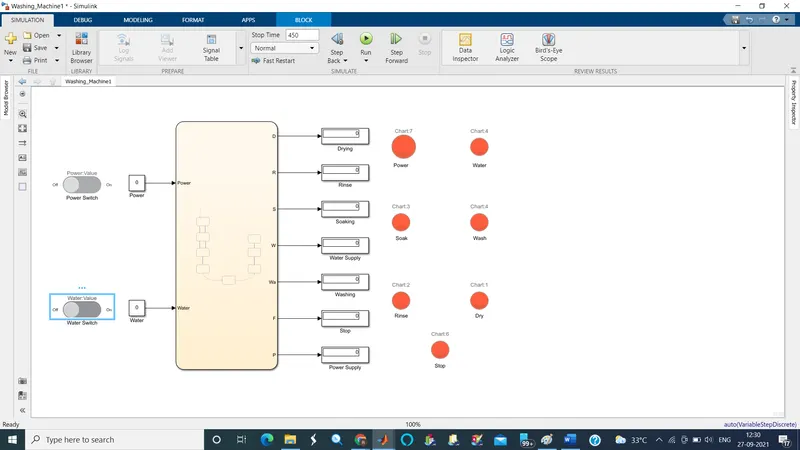
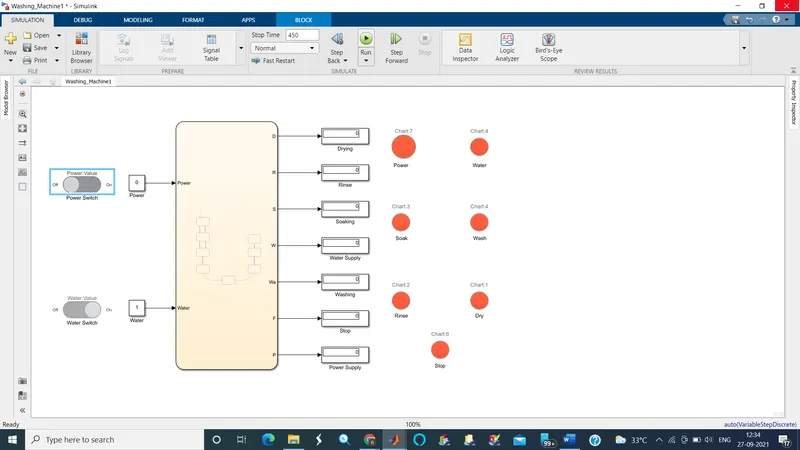
Following are the simulation model for washing machine applying a given control logic.
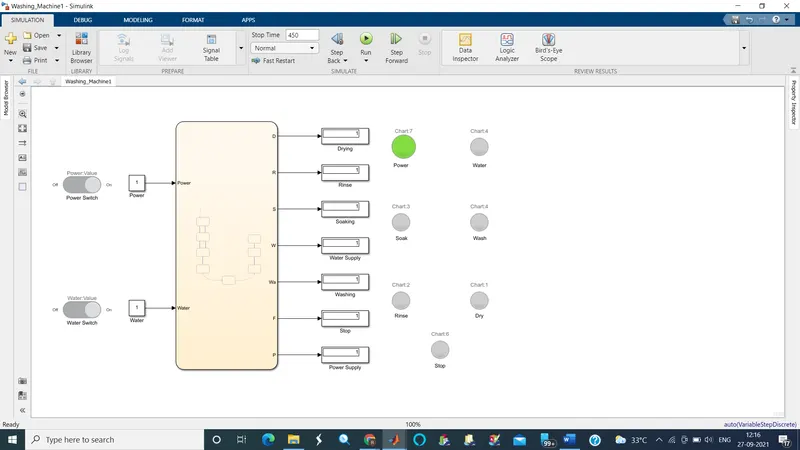
In the above model the simulation blocks used and their purpose are as follows:-
- Constant- The Constant block generates a real or complex constant value signal.
- State flow chart- State flow provides a graphical language that includes state transition diagram , flow charts, state transition tables and truth tables. You can use state flow to describe how MATLAB algorithms and Simulink models react to input signals, events and time-based conditions.
- Scope- Display signals generated during simulation.
- Lamp- Display a colour that reflects an input value.
- Rocker Switch- Set on/off value to tune parameters or variables.
Working Model:-
- According to the given control logic , we need two inputs and five output to complete the control logic.
- The input signal are required to Power & Water supply and the output port is required to know the machine status.
- Using constant block we provide the input signal , since they are user interface the input signals are provided using the rocker switch block which is power supply switch & water supply switch.
- The for the machine to work according to the control logic sequence we use the state flow chart block , where we built the control logic of the given sequence which acts upon the given inputs.
- Now depending upon the input, the control logic takes to transition from one state to another.
- The control logic is created in state flow chart as shown below and works according to the given sequence.
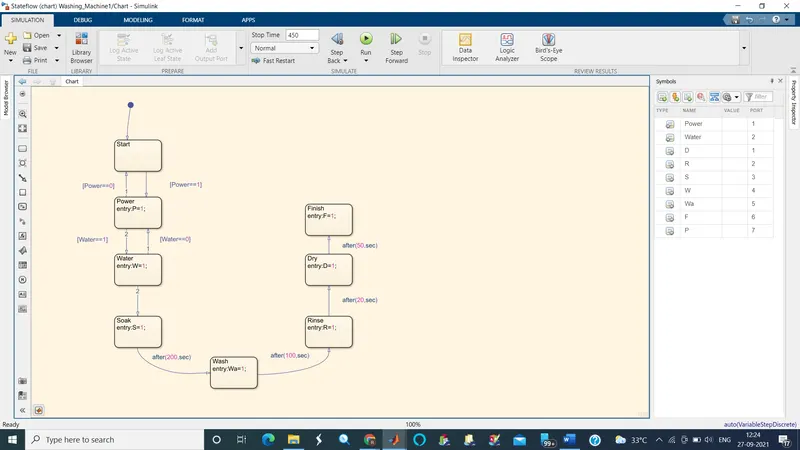
The control logic built accordingly:-
-
- From the control logic state flowchart , we collect the machine status as output.
- And according to output we display its process on the display.
- After finishing the complete process, we check it using the rational operator and th
- In the scope , we record the input and the machine status with time.
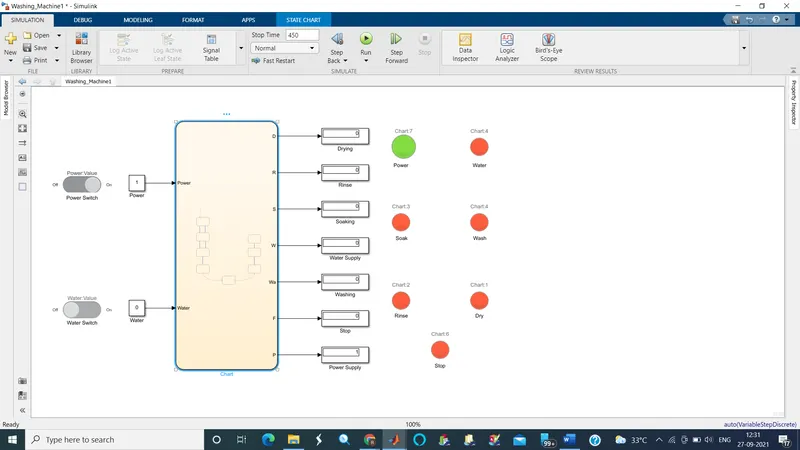
- First, we check the input of the power supply and display the signal according to the input.
- Then after getting the power supply , we move to the next state and check the water supply.
- After getting the power supply and water supply we make the transition from the state soaking
- After the soaking process is completed of 200 sec it moves towards the washing process.
- Then all the following states are achieved according to the given sequence and for each state transition power & water supply are checked.
Results:-
-
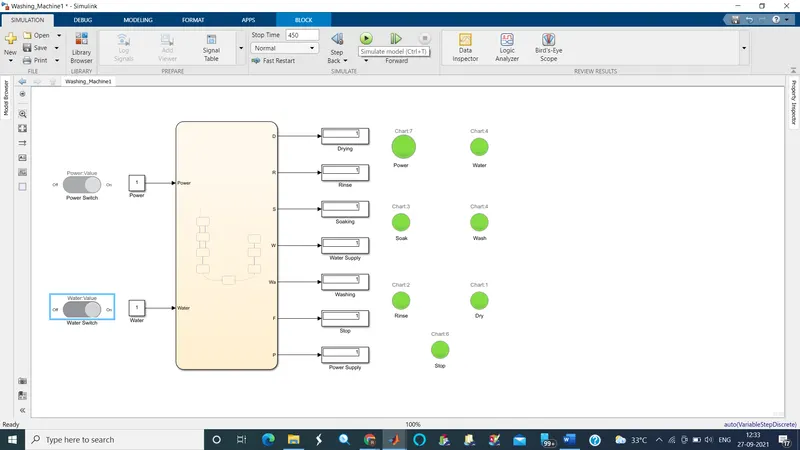
Following are the results of simulation sequentially with time.
- Power supply
- Water supply
- Soaking
- Washing
- Rinsing
- Drying
- Finish
Solution_2
According to the question we need to make a Simulink chart for the "Gear Shift " logic as per below conditions:
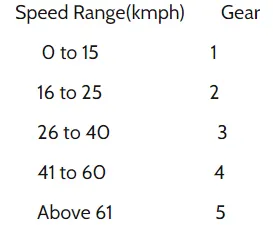
Give speed input while the simulation is running & display the Gear number.
Theory:-
A transmission is a machine in a power transmission system, which provides a controlled application os power. Often the power term 5-Speed transmission refers simply to the gearbox, that uses gears and gear trains to provide speed and torque conversion from a rotating power source to another device.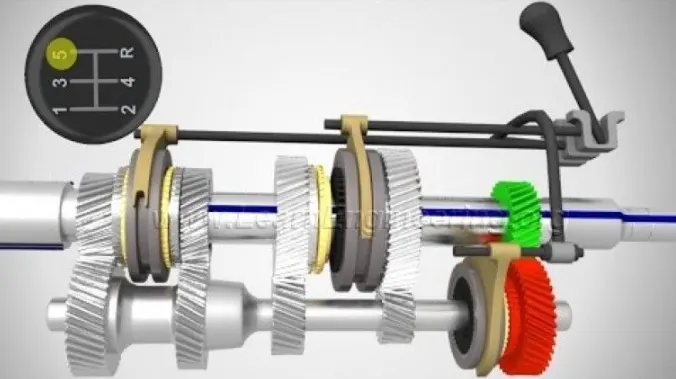
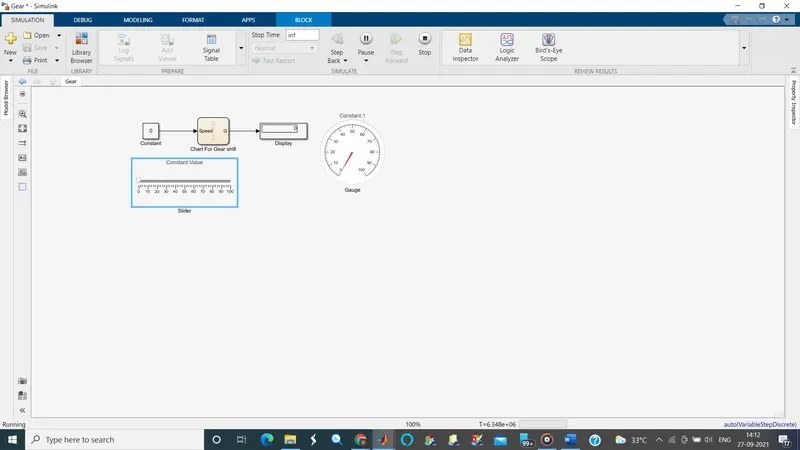
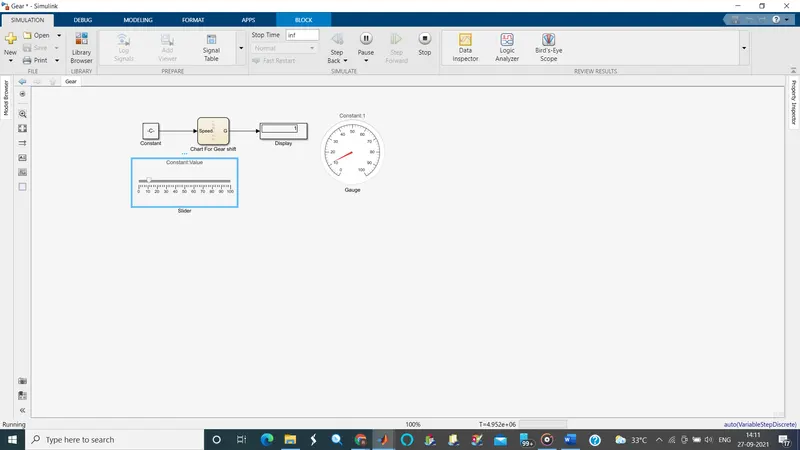
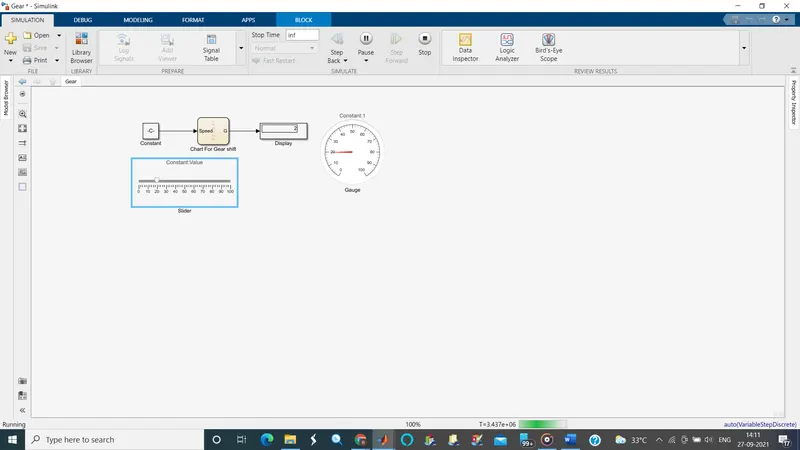
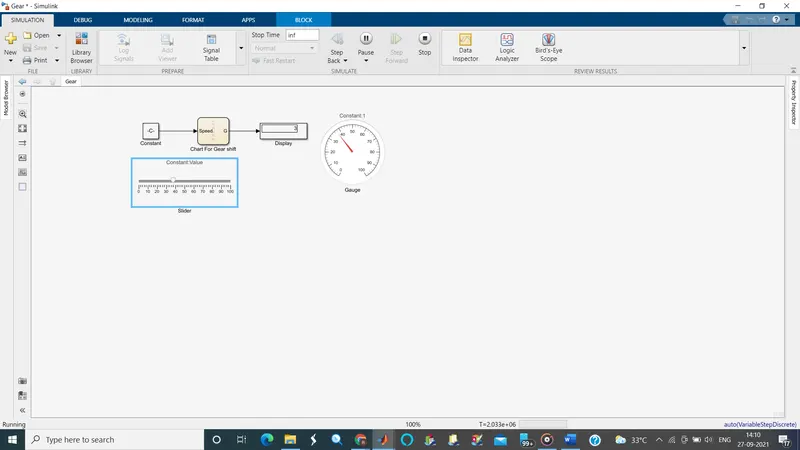
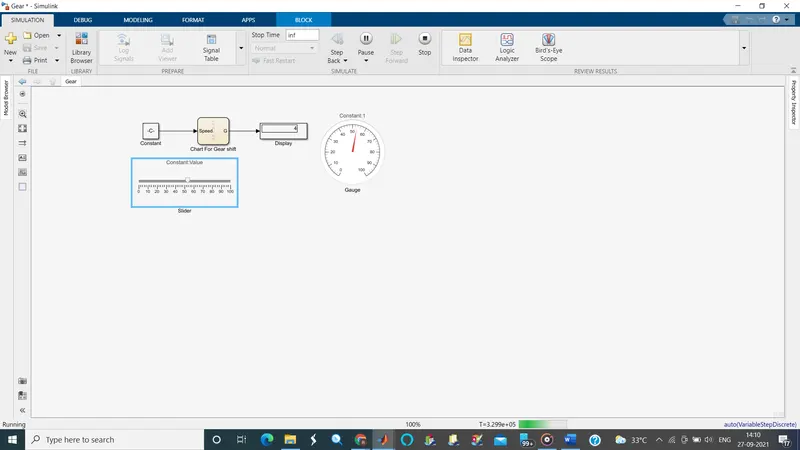
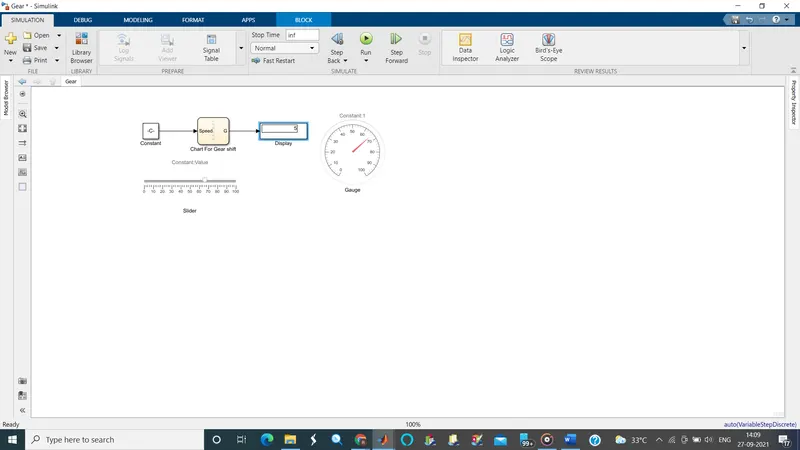
Following is the simulation model solving the given question.
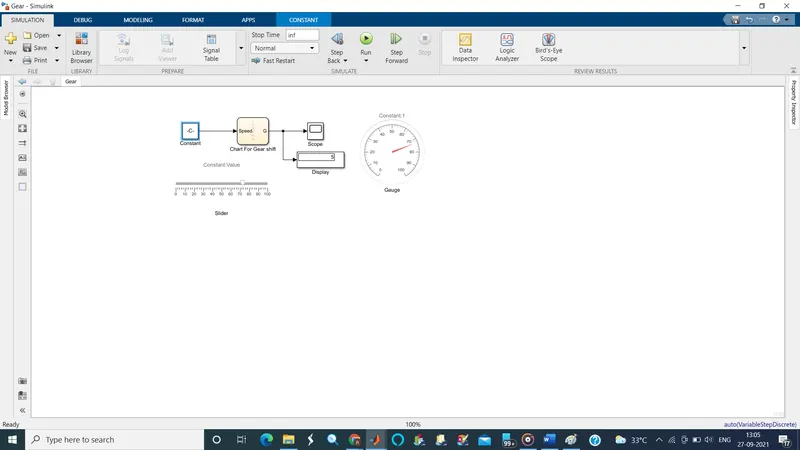
In the above model the simulation blocks used & their purpose are as follows:
- Constant- The constant block generates a real or complex constant value signal.
- Slider- The slider block performs a input that you can modify during simulation.
- State Flowchart- State Flowchart provides a graphical language that includes state transition diagrams , flow charts , state transition tables and truth table. You can use Stateflow to describe how MATLAB algorithm and Simulink models react to input signals , events and time-based conditions.
- Scope- Display signals generated during simulation.
- Circular Gauge- Display an input value on a customized gauge.
- Display- The display block shows the signal value as text.
Working of Sub-system model
- The model is just a simple program of the control logic with the simple arithmetic equation.
- We have a 5-Speed range & 5 gear system.
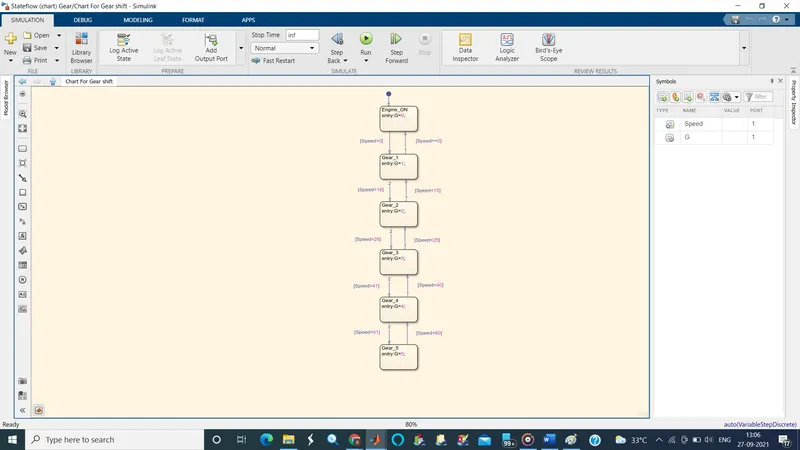
- According to the given system requirement, we have built the control logic where it checks the speed and changes the gear according to it.
- Following is the State flow chart for provided gear system.
- Here we give the input speed while the simulation is running , the state flowchart runs the control logic and changes the gear according to the given speed input.
- We collect the output value from the chart.
- The two blocks circular gauge and display blocks represent the input speed the gear value according to it.
- After running the simulation we change the speed values using slider , and then check its respective gear.
- We also use the scope block to record the speed input and then the gear output for the entire simulation.
Results:-
Following is the video of simulation for the gear change according to the speed and the graph of it.