Project 1 - Parsing NASA thermodynamic data
AIM:-to write a code in MATLAB to parse the NASA thermodynamic data file and then calculate the thermodynamic properties of various gas species.
OBJECTIVE:-
- Write a function that extracts the 14 co-efficients and calculate the Enthalpy(H), Entropy(S), Molecular weight and Specific heats(CP) for the species in the data file.
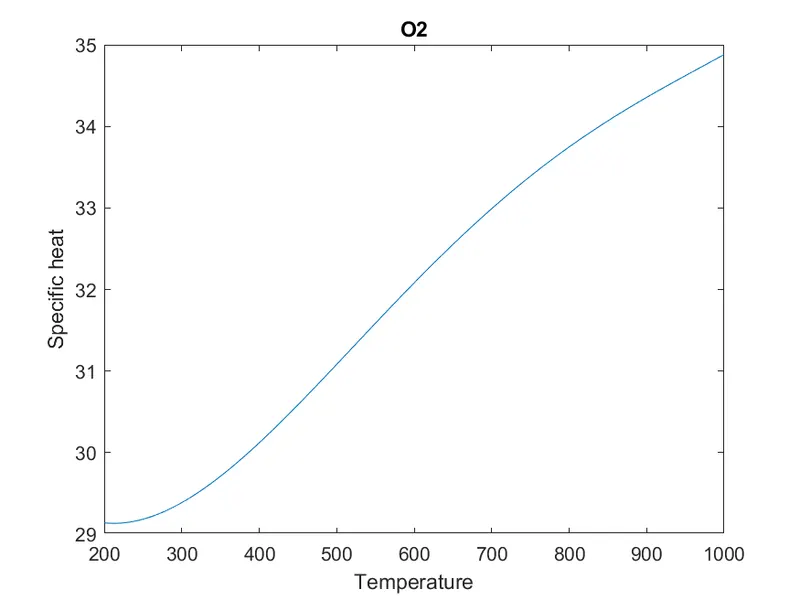
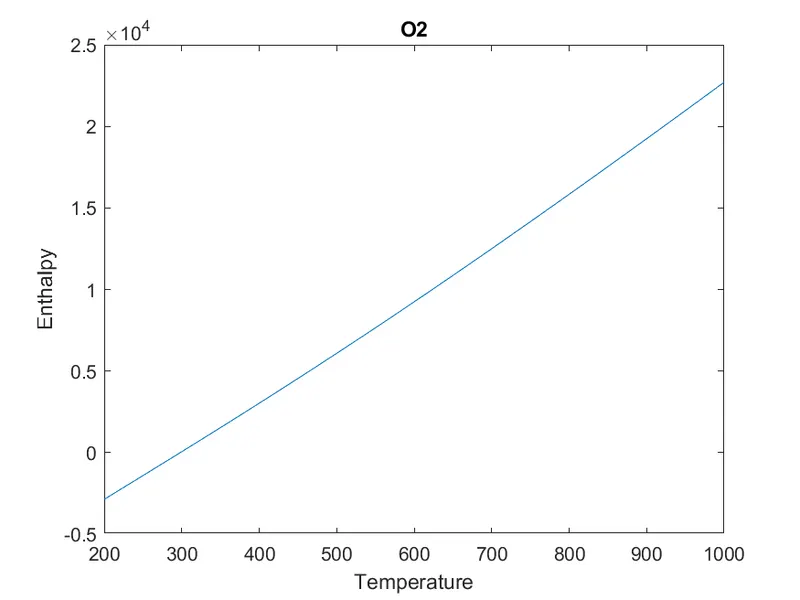
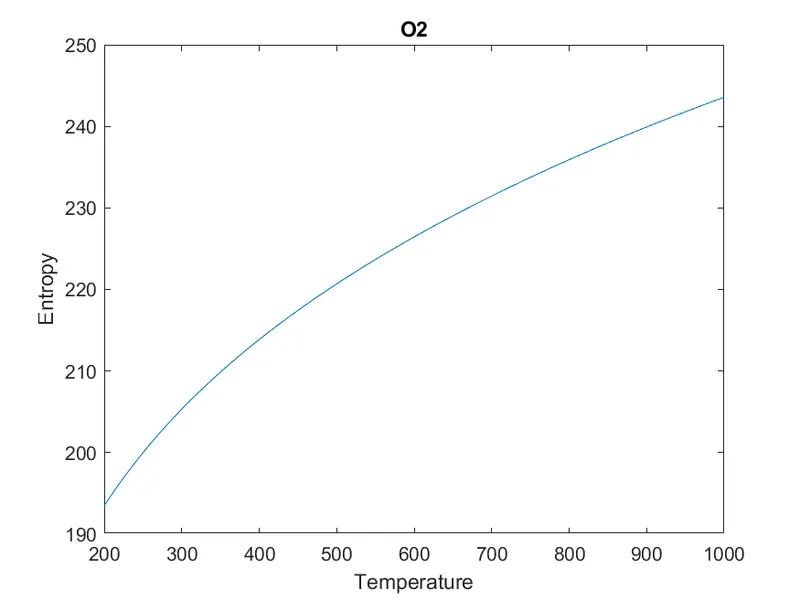
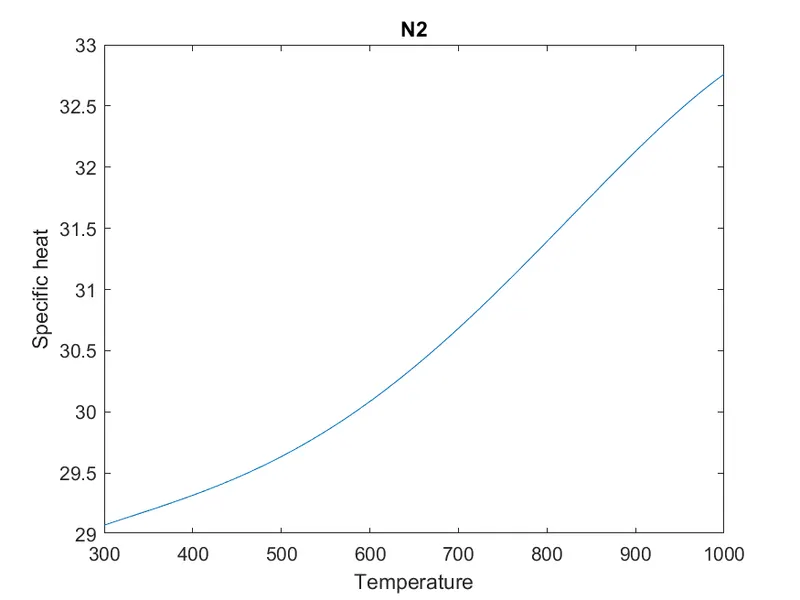
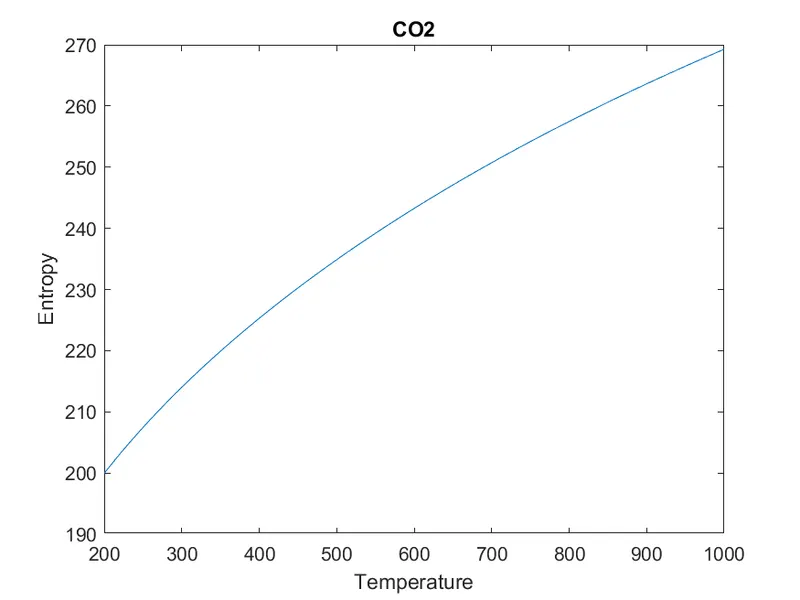
- Plot Specific heat , Enthalpy and Entropy for the local temperature range (low temperature, high temperature) specific for each species.
- Save the plots as images with appropriate names and dump them in separate folders for each species with suitable name. All these should be generated automatically.
- The main program that you will submit will just take the “THERMO.dat” file as an input and generate CP,H and S plots.
- Screenshots of the window where all the folders are saved.
- Plots for O2,N2,CO2 species.
File Parsing:-
Parsing , syntax analysis or syntactic analysis is the process of analysing a string of symbols, either in natural language , computer languages or data structures , conforming to the rules of a formal grammer. The term comes from the latin word pars(orationis), meaning part (of speech). Within computational linguistic term is used to refer to the formal analysis by a computer of a sentence or other string of words into its constituents, resulting in a parse tree showing their syntactic relation to each other, which may also contain semantic and other information. Some parsing algorithm may generate a parse forest or list of parse trees for a syntactically ambitious input.
Parsing a file means reading in a data stream of some sort and building an in memory model of the semantic content of that data. This aims at facilitating performing some kind of transportation on the data.
NASA Thermodynamic File:-
NASA thermodynamics file which is THERMO.dat file in which there are temperature range and 53 species are given in these data and each species contains 14 coefficients and temperature ranges and we have to parse these 14 coefficients to find Specific heat , Enthalpy and Entropy using formulas as:-
Where,
R=Universal gas constant
T=Temperature
CP=Specific heat(KJ)
S=Entropy(KJ/mol-K)
H=Enthalpy(KJ/mol)
a(i)=Coefficients ,i= to14
Specific Heat:-
The specific heat is the amount of heat per unit mass required to raise the temperature by one degree Celsius. The relationship between heat and temperature change is usually expressed in the form shown below where cis the specific heat
CP=R*(a1+(a2*T)+(a3*(T)^2)+(a4*(T)^3)+(a5*(T)^4))
ENTROPY:-
Entropy ,the measure of a system’s thermal energy per unit temperature that is unavailable for doing useful work. Because work is obtained from ordered molecular motion , the amount of entropy is also a measure of the molecular disorder , or randomness of a system.
S=R(a1*log(T)+(a2*T)+((a3*(T)^2)/2)+(a4*(T)^3)/3)+((a5*(T)^4)/4)+a7)
ENTHALPY:-
Enthalpy , a property of thermodynamic system , is equal to the system’s internal energy plus the product of its pressure and volume . In a system contained so as to prevent mass transfer , for processes at constant pressure , the heat absorbed or released equals the change in enthalpy.
H=R*T*(a1+((a2*T)/2)+((a3(T)^2)/3+((a4*(T)^3)/4)+((a5*(T)^4)/5)+((a6/T)))
MATLAB code:-
clear all
close all
clc
%reading data file - NASA Thermodynamic
%open  a file & 'r' open the file for reading
f1=fopen('THERMO.dat','r');
%checking for the sign of file identifier
if f1<0
fprintf('there is an error, fid can''t be negative. end./n')
end

%Reading the file header
Header=fgetl(f1);
% getting the global low, mid, and high temperatures as a string
temp=fgetl(f1); %reading the second line temperature line
fgetl(f1);   % ignorning the comment line1
fgetl(f1);   % ignorning the comment line2
fgetl(f1);   % ignorning the comment line3

%getting tht global low, med and high as numbers
A=strsplit(temp,' ')  %spliting the string to access global low,mid & high temoerature value
global_low_temp=str2num(A{2}); %converting the splitted string temp value to number low temperature value
global_mid_temp=str2num(A{3}); %converting the splitted string temp value to number mid temperature value
global_high_temp=str2num(A{4}); %converting the splitted string temp value to number high temperature value

% for loop to find values of coefficients
for i=1:53
%getting the first line of a species as a string

l1=fgetl(f1);
x=strsplit(l1,' ');
species_name=x{1};%getting species names
z=length(x);
%calculte molecular weight
%M_weight = weight(species_name);
%storing the temp values as numbers
local_low_temp=str2double(x{z-3});
local_mid_temp=str2double(x{z-2});
local_high_temp=str2double(x{z-1});

t1=local_low_temp;
t2=local_mid_temp;
t3=local_high_temp;

%getting a1-a5 coeff

l2=fgetl(f1); %getting the second line of the species
Y=findstr(l2,'E'); % creating a vector of 'E' index and stored to a variable'Y'

a1=l2(1:Y(1)+3); %using 1st position of 'E' to get full coefficient to a1 as string
a1=str2num(a1); %converting a1 to num and storing it back in a1

a2=l2(Y(1)+4:Y(2)+3); %using 1st position of 'E',Y(1) & 2nd position of 'E',Y(2) to get a2 as string
a2=str2num(a2); %converting a2 to num and storing it back in a2

a3=l2(Y(2)+4:Y(3)+3); %using 2nd position of 'E',Y(2) & 3rd position of 'E',Y(3) to get a3 as string
a3=str2num(a3); %converting a3 to num and storing it back in a3

a4=l2(Y(3)+4:Y(4)+3); %using 3rd position of 'E',Y(3) & 4th position of 'E',Y(4) to get a4 as string
a4=str2num(a4); %converting a4 to num and storing it back in a4

a5=l2(Y(4)+4:Y(5)+3); %using 4th position of 'E',Y(4) & 5th position of 'E',Y(5) to get a5 as string
a5=str2num(a5); %converting a5 to num and storing it back in a5

%getting a6-a10

l3=fgetl(f1);   % same as a1-a5 except now it is line 3 and coeff a6-a10
Y=findstr(l3,'E');

a6=l3(1:Y(1)+3); %using 1st position of 'E' to get full coefficient to a6 as string
a6=str2num(a6); %converting a6 to num and storing it back in a6

a7=l3(Y(1)+4:Y(2)+3); %using 1st position of 'E',Y(1) & 2nd position of 'E',Y(2) to get a7 as string
a7=str2num(a7); %converting a7 to num and storing it back in a7

a8=l3(Y(2)+4:Y(3)+3); %using 2nd position of 'E',Y(2) & 3rd position of 'E',Y(3) to get a8 as string
a8=str2num(a8); %converting a8 to num and storing it back in a8

a9=l3(Y(3)+4:Y(4)+3); %using 3rd position of 'E',Y(3) & 4th position of 'E',Y(4) to get a9 as string
a9=str2num(a9); %converting a9 to num and storing it back in a9

a10=l3(Y(4)+4:Y(5)+3); %using 4th position of 'E',Y(4) & 5th position of 'E',Y(5) to get a10 as string
a10=str2num(a10); %converting a10 to num and storing it back in a10

%getting a11-a14 coeff

l4=fgetl(f1) ;
Y=findstr(l4,'E');

a11=l4(1:Y(1)+3); %using 1st position of 'E' to get full coefficient to a11 as string
a11=str2num(a11); %converting a11 to num and storing it back in a11

a12=l4(Y(1)+4:Y(2)+3); %using 1st position of 'E',Y(1) & 2nd position of 'E',Y(2) to get a12 as string
a12=str2num(a12); %converting a12 to num and storing it back in a12

a13=l4(Y(2)+4:Y(3)+3); %using 2nd position of 'E',Y(2) & 3rd position of 'E',Y(3) to get a13 as string
a13=str2num(a13); %converting a13 to num and storing it back in a13

a14=l4(Y(3)+4:Y(4)+3); %using 3rd position of 'E',Y(3) & 4th position of 'E',Y(4) to get a14 as string
a14=str2num(a14); %converting a14 to num and storing it back in a14
% creaing a new folder with species name to store its plots
mkdir(species_name)
cd(species_name)

%Define temperature range
T = linspace(t1,t3,1000);
%Define the value of universal gas constant in (J/mol.k)
R=8.314;

%for loop for calculation of specific heat(Cp), enthalpy(H),entropy(S)
for j=1:length(T)
    % a1-a7 ---> high temp coeff
    if T(j)>t2  %comparison with mid temp

    Cp=(a1+a2.*T+a3.*T.^2+a4.*T.^3+a5.*T.^4)*R;     % calc of Cp, h and s
    H=(a1+(a2.*T)/2+(a3.*T.^2)/3+(a4.*T.^3)/4+(a5.*T.^4)/5+(a6./T))*R.*T;
    S=(a1.*log(T)+a2.*T+(a3.*T.^2)/2+(a4.*T.^3)/3+(a5.*T.^4)/4+a7)*R;

    else  % low temp coeff
        Cp=(a8+a9.*T+a10.*T.^2+a11.*T.^3+a12.*T.^4)*R;     % calc of Cp, h and s
    H=(a8+(a9.*T)/2+(a10.*T.^2)/3+(a11.*T.^3)/4+(a12.*T.^4)/5+(a13./T))*R.*T;
    S=(a8.*log(T)+a9.*T+(a10.*T.^2)/2+(a11.*T.^3)/3+(a12.*T.^4)/4+a14)*R;
    end
end

%plot between temperature & specific heat
figure(1)
plot(T,Cp);
xlabel('Temperature');
ylabel('Specific heat');
title('Species Name');


%plot between temperature & enthalpy
figure(2)
plot(T,H);
xlabel('Temperature');
ylabel('Enthalpy');
title('Species Name');


%plot between temperature & entropy
figure(3)
plot(T,S);
xlabel('Temperature');
ylabel('Entropy');
title('Species Name');

saveas(1,'Specific_heat.png')
saveas(2,'Enthalpy.png')
saveas(3,'Entropy.png')
cd ..

%mol wt calc
    elements=['H','C','O','N','A']; % element names for comparison
    atomic_wt=[1 12 16 14 40]; % weight assigned for each element
    mol_wt=0;
    for k=1:length(species_name)
        for l=1:length(elements)
            if strcmp(species_name(k),elements(l))
%comparison of the chracters, and proceed if yes
                mol_wt=mol_wt+atomic_wt(l);
                position=l; %storing the position for reference outside loop
            end
        end
    end

    n=str2double(species_name(k));
    if n>1
        mol_wt(k)= mol_wt+atomic_wt(position)*(n-1); % adding the extra atoms' weights
    end


   mol=sprintf('Molecular weight of %s: %f ',species_name,mol_wt)

  % to display all the molecular weights in cammand window
end
Explanation of the code:-
- Clear all command clears all the previous data
- Close all closes all the previously opened data
- Clc clears the command window
- Now in line-6 Start with fopen command which takes file name and mode as its parameter, ’r’ is for read mode and store under the variable name f1.
- Now the f1 value is checked if the value is -ve , if loop is executed and show the error message.
- Line-13 ,Read the header with fgetl command. Fgetl command reads new line, if we use it again.
- Now read the next line with the same getl command , This string line has temperature values. We have to convert it into numerical line by using str2num command.
- Now line 16 to 18are comment line which are to be ignored by fgetl command.
- Line-21 , the string collected in line-13 are splitted by ‘ ‘
- Now from line 22 to 24 , global temperature range by converting string to numerical by str2num command.
- Now in line -27 , for loop is started , which will run from 1 to 53 because there are 53 species.
- Now in line-30 ,read the next line and store the string in l1 variable , from the l1 species_name by using strsplit command ,which splits the string.
- Now the local temperature ranges are to be extracted from the string and converted and stored in the t1,t2,t3 variables.
- Now read the next line ,store it under a variable and find E in the line using strfind command. We will get the index of E .
- Using proper indexing to store all coefficient values under variable name(a1-a14) with converting them to numerical values using str2num command simultaneously.
- Now in line-103 use mkdir command to create a directory. It takes parent directory name as parameter i.e species_name.
- Now set the remote directory with cd command.
- Now line-107 define temperature range from t1 to t3 with 1000 intervals and store the array in the variable T.
- Define the universal gas constant value R.
- Apply if-else statement to calculate Cp,H,S for different values of temperature by using for loop.
- Now plot the Cp , H , S vs temperature with suitable labels and titles.
- Now use saveas command to save all the plots. Saveas command takes graphic object and file name with graphic format as its parameter.
- Again set remote directory using ‘cd..’
- Now calculate molecular weight of different species.
- In line-156 elements to be assigned for comparision.
- Line-157 , atomic weight of each element ware assigned.
- Initially the molecular weight is 0 and 2 for loops executed to calculate molecular weight of the species. First loop will run from 1 to the end of the species name and second will run from 1 to the end of the element.
- Apply a if statement and apply strcmp command to compare species name & elements. And calculate the molecular weight. And store the position to 1.
- End the if statement and use str2dounle command to convert string elements to double numerical element and store in a variable ‘n’.
- Apply if statement if n>0 then the molecular weight is calculated.
- Now all loops to be terminated by the key word end.
Output:-
we got plots and molecular weight for all species and saved each into a folder automatically.
Plots of O2
Plots of N2
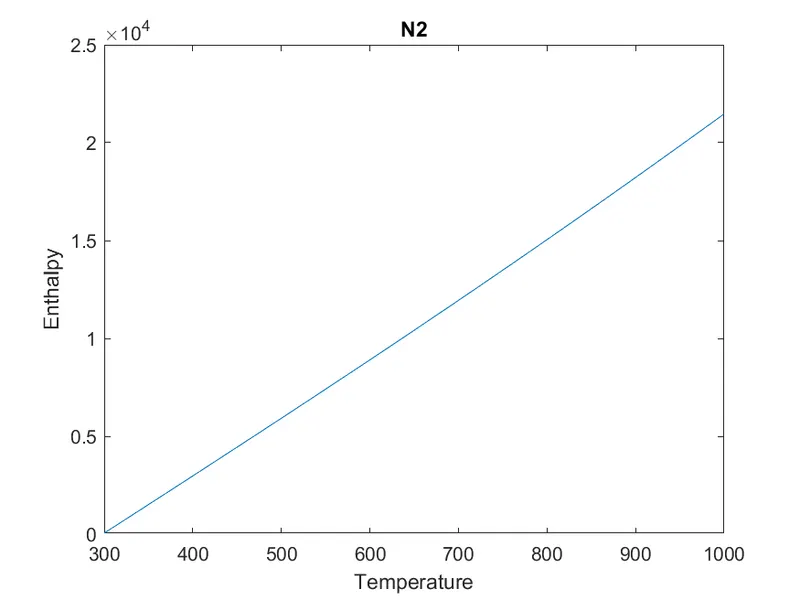
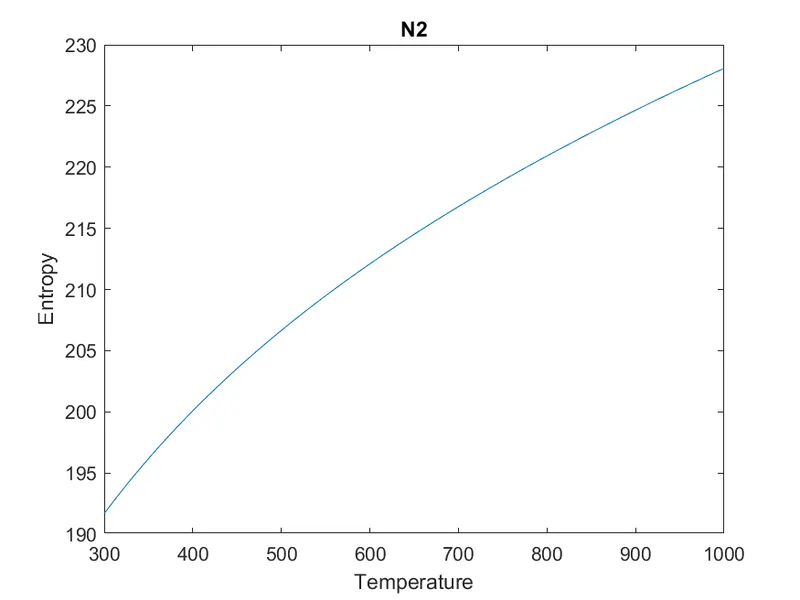
plots of CO2
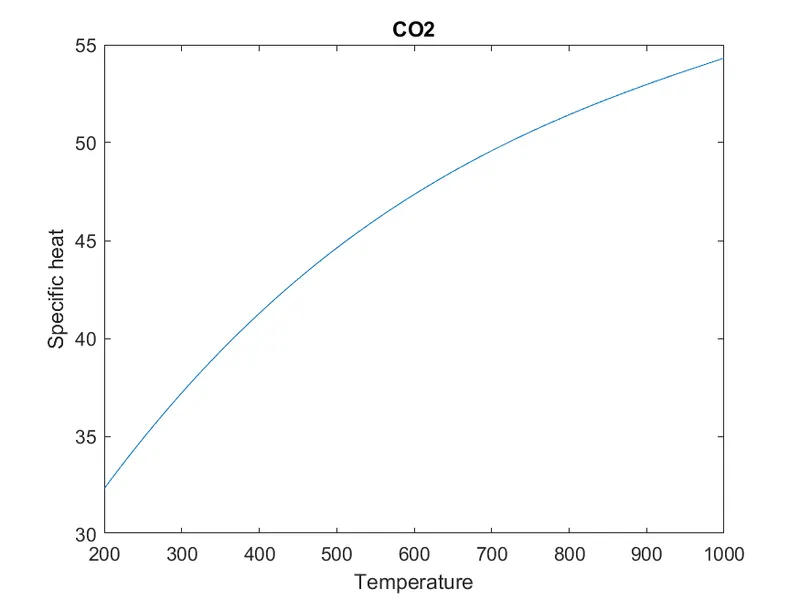
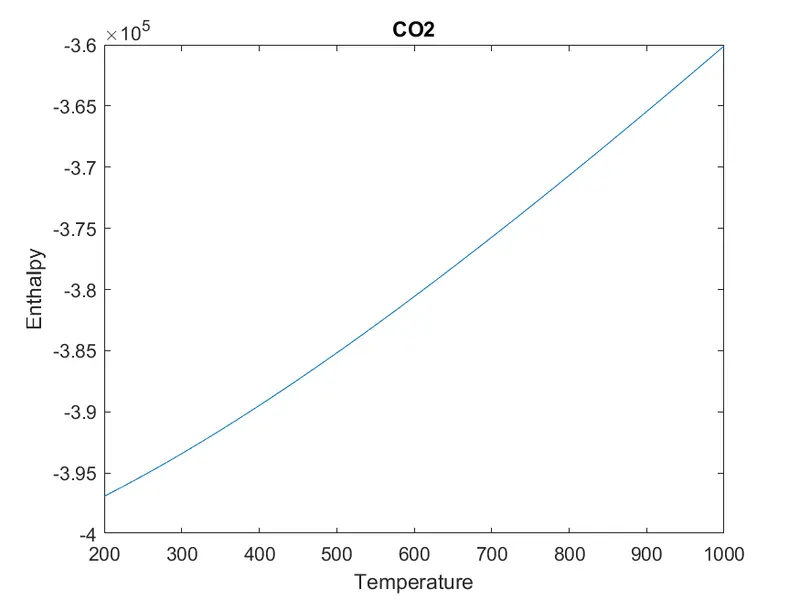
Molecular Weight of each species:-
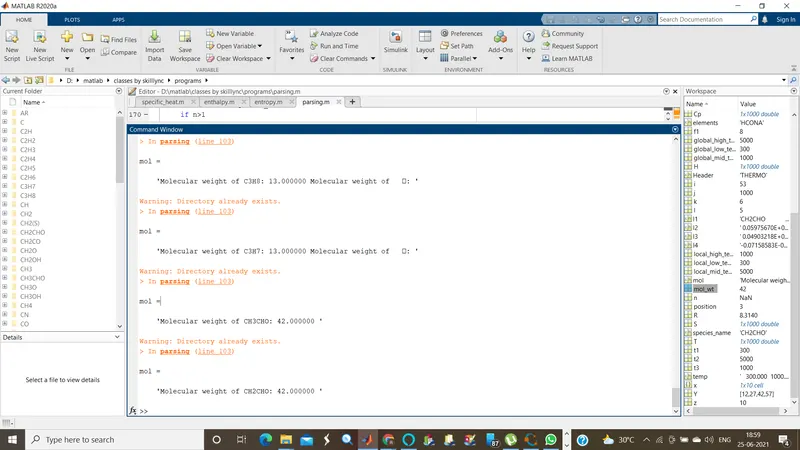
rest molecular weight of species are attached in the video file.
Screenshot of folder containing plots of each species.

Errors faced:-
no major errors faced.
Reference:-
https://en.wikipedia.org/wiki/Parsing