Week - 4
Question 1:
Implement control logic of a “washing machine” using Stateflow as per given sequence:
- If the power supply is available, the system gets activated
- If the Water supply is not available, stop the process & indicate through LED
- Soaking time should be 200s followed by Washing time of 100s.
- Then rinsing happens for next 20s & dryer runs for 50s
After all the processes have completed turn on the finished LED
Solution:
Aim
To Implement control logic of a “washing machine” using Stateflow as per given sequence.
Conditions
- If the power supply is available, the system gets activated
- If the Water supply is not available, stop the process & indicate through LED
- Soaking time should be 200s followed by Washing time of 100s.
- Then rinsing happens for next 20s & dryer runs for 50s
- After all the processes have completed turn on the finished LED
Fundamental Simulink Blocks Required
1.Constant
This block output the constant specified by the 'Constant value' parameter
2.Chart
A Stateflow chart is a graphical representation of a finite state machine. States and transitions form the basic elements of the system.
3.Display
This block displays the input values.
4.Lamp
This block displays a color that reflects an input value.
Procedure
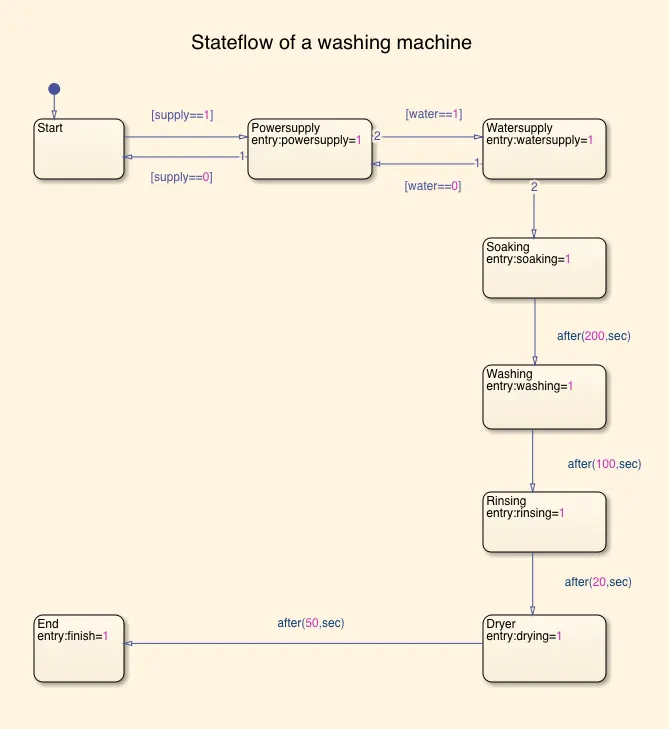
Create a state flow chart block to provide the control logic of washing machine. In that, create the states that the logic goes from start to end by the given conditions. i.e.Powersupply, Watersupply, Soaking, Washing, Rinsing, Dryer, End. And also set the delay time of the states.
After that assign the created variables as input and output data according to the control logic and leave the chart block.
In the input side, connect constant blocks to provide powersupply and watersupply as inputs.
In the output side, connect displays and lamps to check the state of the washing machine.
Set the stop time to 500s.
Then, set the inputs according to different cases of the supply and run the model to see the results.
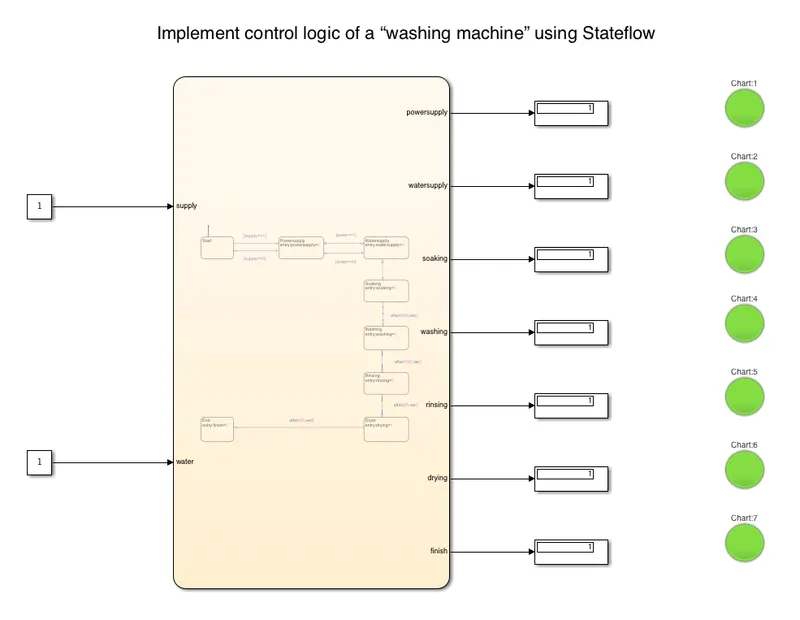
Simulink Model
Stateflow Chart
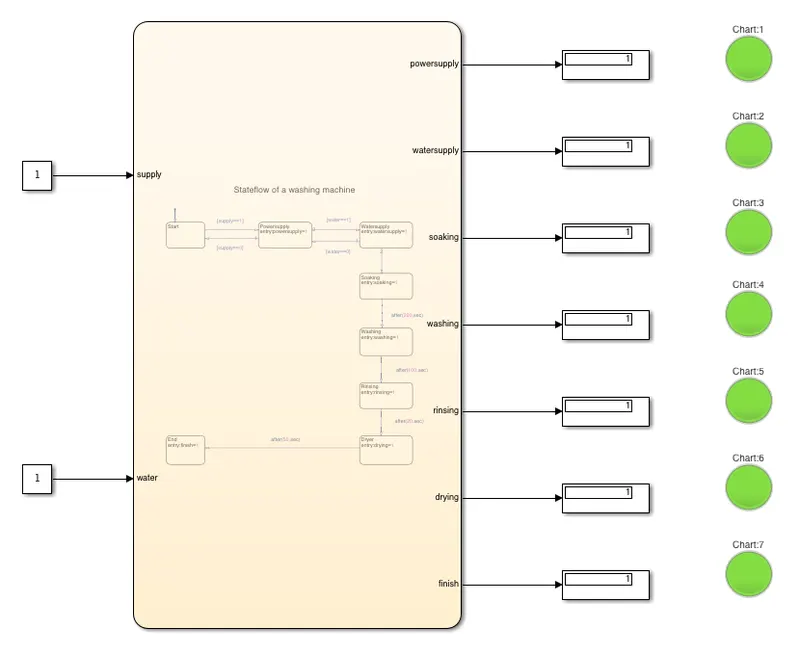
Output
When power supply and water supply are given.
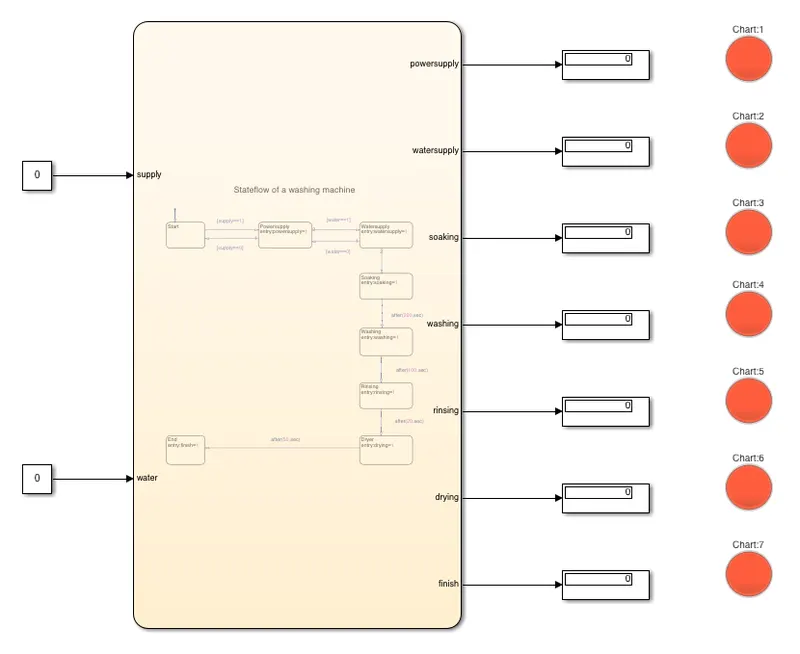
When power supply and water supply are not given.
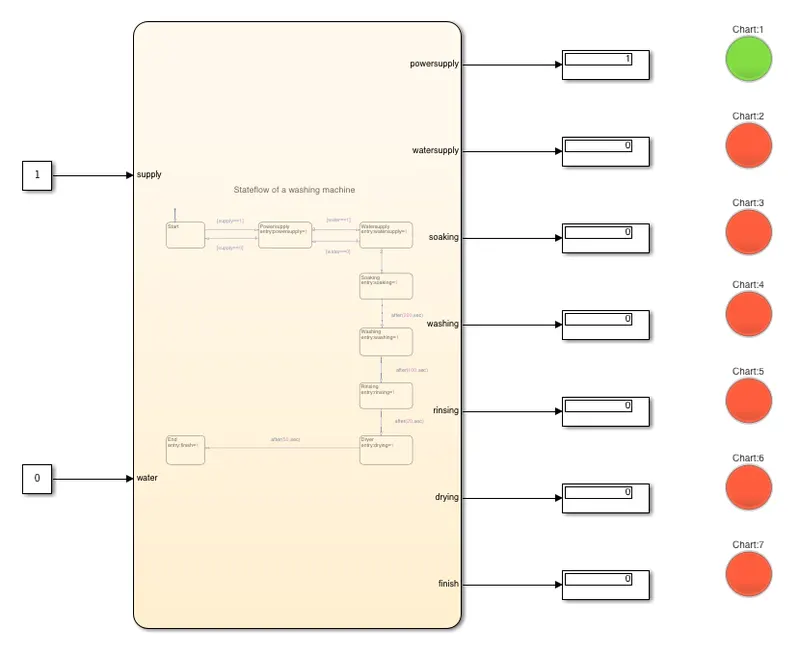
When power supply is given and water supply is not given.
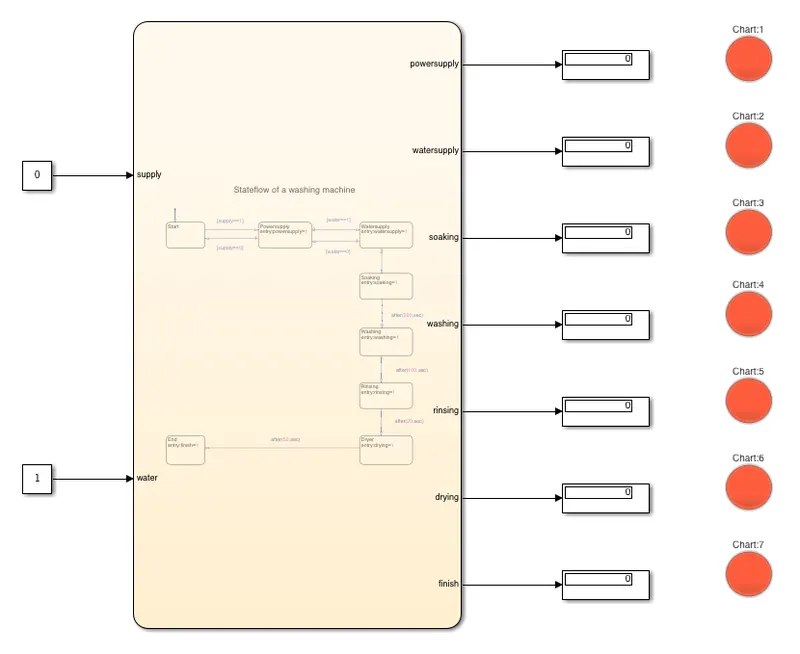
When power supply is not given and water supply is given.
Result
Thus the control logic of the washing machine using stateflow as per given sequence was created and simulated successfully.
From the output,
When power supply and water supply are given, the system operates from start to end.
When power supply and water supply are not given, the system doesn't start.
When power supply is given and water supply is not given, the system starts but no operation is done since there is no watersupply.
When power supply is not given and water supply is given, the system won't starts and no operation is done.
Question 2:
Make a Simulink chart for the “Gear shift” logic as per below conditions:
Speed Range(kmph) Gear
0 to 15 1
16 to 25 2
26 to 40 3
41 to 60 4
Above 61 5
Give speed input while the simulation is running & display the gear number.
Solution:
Aim
To Make a Simulink chart for the “Gear shift” logic as per given conditions and to give speed input while the simulation is running & display the gear number.
Conditions
Speed Range(kmph) Gear
0 to 15 1
16 to 25 2
26 to 40 3
41 to 60 4
Above 61 5
Fundamental Simulink Blocks Required
1.Slider
This block set value to tune parameters or variables.
2.Constant
This block output the constant specified by the 'Constant value' parameter
3.Chart
A Stateflow chart is a graphical representation of a finite state machine. States and transitions form the basic elements of the system.
4.Display
This block displays the input values.
5.Lamp
This block displays a color that reflects an input value.
Procedure
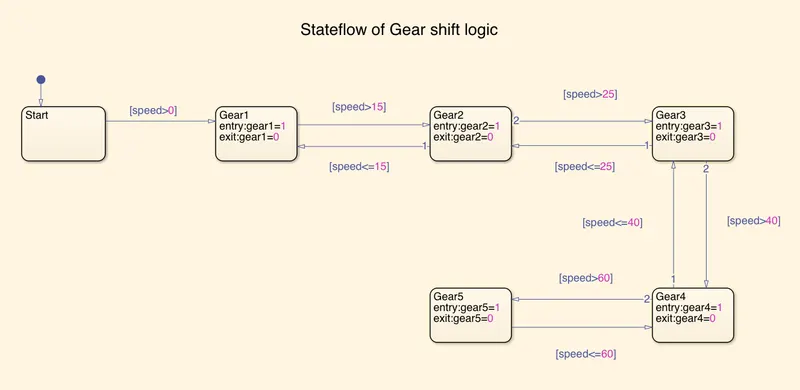
Create a state flow chart block to provide gear shift logic. In that, create the states that the logic goes from start to end. i.e.Start, Gear1, Gear2,... Gear5.
After that assign the created variables as input and output data according to the control logic.
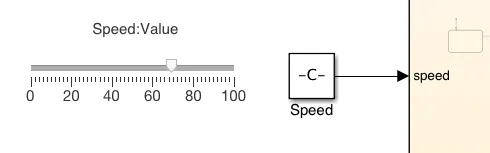
Then leave the chart block and connect a slider and constant block at the input side to vary the speed.
In the output side, connect displays and lamps to check which gear is operated.
Set the stop time to infinite (inf).
Then the run the model and vary the slider to see the results.
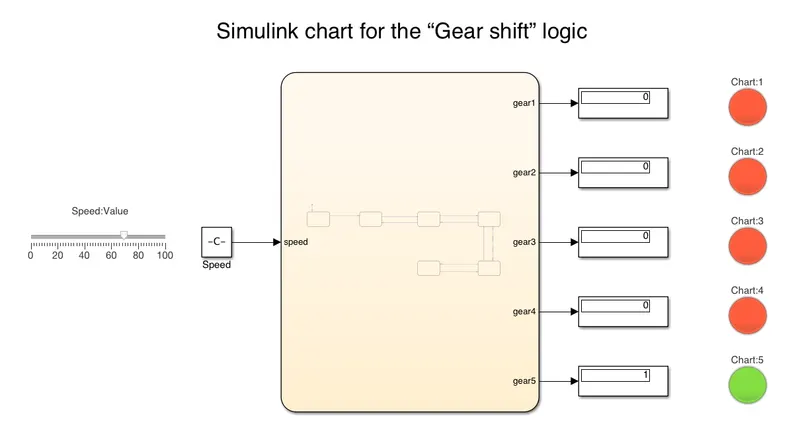
Simulink Model
Stateflow Chart
Input
Output
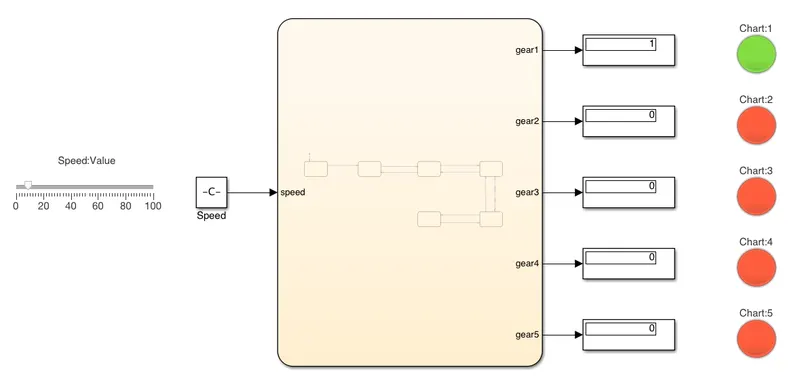
When the speed is between 0-15 kmph
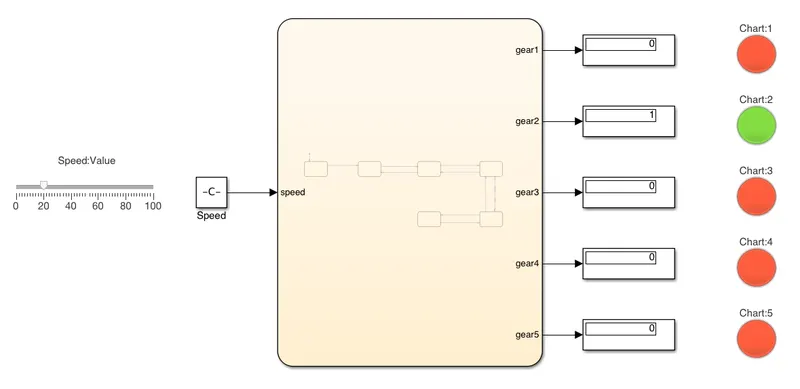
When the speed is between 16-25 kmph
When the speed is between 26-40 kmph
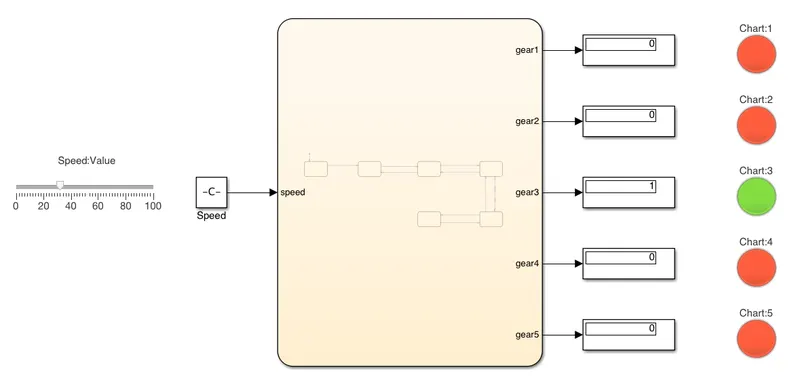
When the speed is between 40-60 kmph
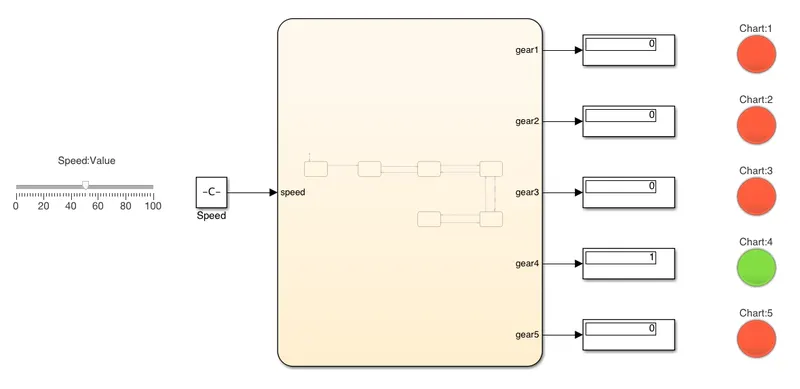
When the speed is above 61 kmph
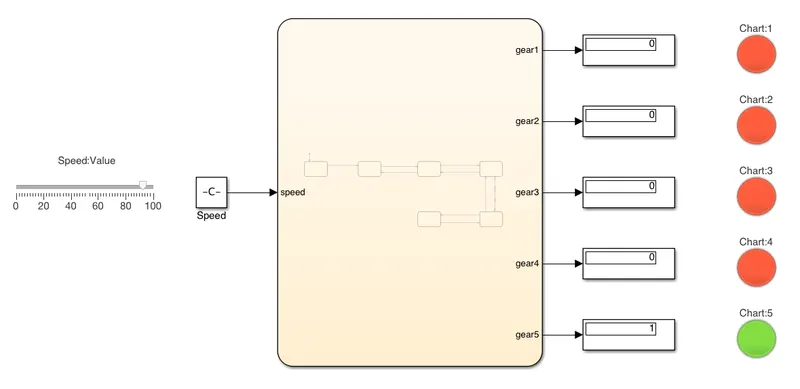
Result
Thus the creation of state flow chart for the gear shift logic as per given conditions and speed range inputs were created and simulated successfully.