Week - 4
1) The control logic for a simple automatic washing machine was made using stateflow. The simulink diagram was made as per the given condition. The simulation runs for a sample period of 600 sec.
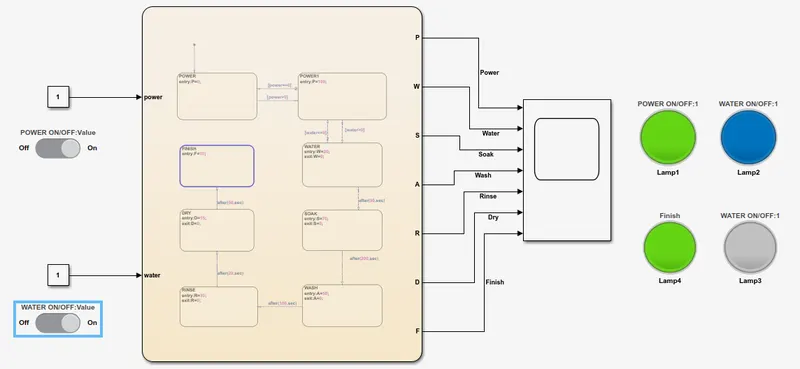
The simulink diagram for the Simple Automatic washing machine:
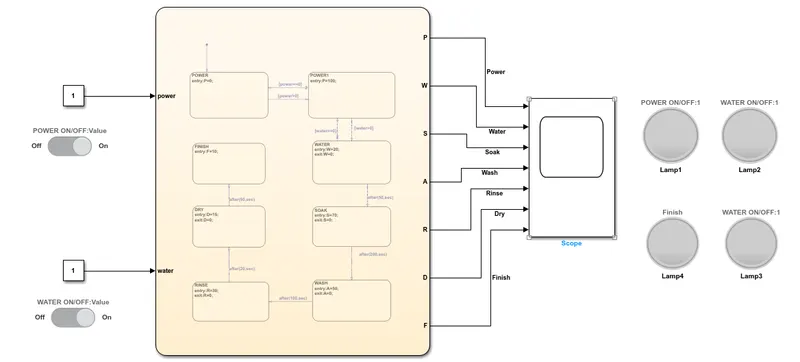
- For a power supply and water supply, 'constant block' is used. The slider switches are connected to both the constant block.
- The Lamp1 and Lamp2 are connected with the respective slider switch inorder to indicate the OFF/ON state.
- The Lamp3 is used to indicate the process is not completed if the water supply is not available.
- The Lamp4 is used to indicate the process is completed once the water supply is available.
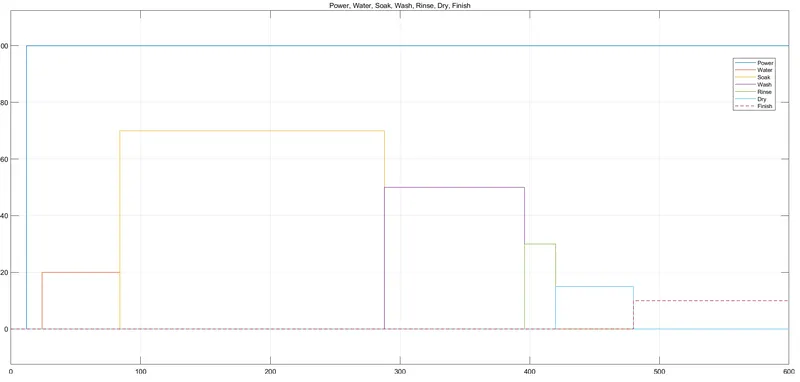
- A scope is used to understand all the process takes place according to the given condition.
The control logic for the Automatic Washing:
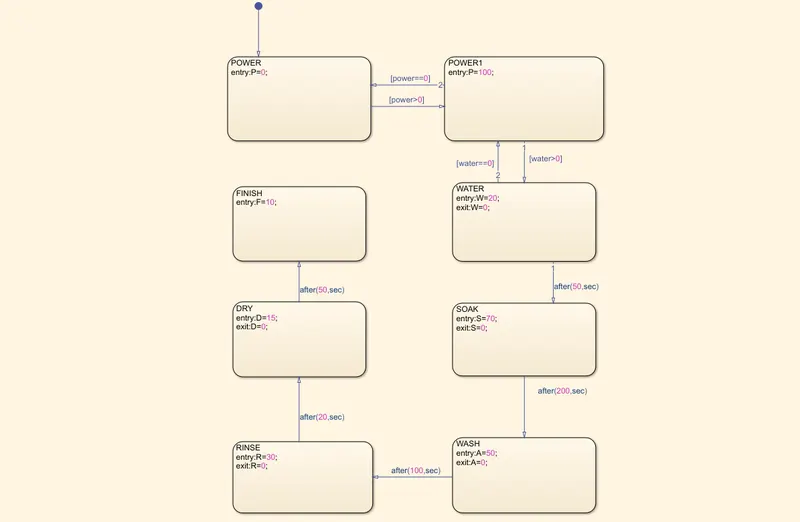
The default input to the system is zero.i.e the intial condition of power switch(i.e.P=0). Inorder to understand the working of all the state, different output values are given to each state. The entire process will start only if the water supply is available.The logic operation behind this chart is:
- When P=0 ----- State 'POWER' is active, gives output value=0
- When P>0 ----- State 'POWER1' is active, gives output value P=100 and check for water>0
- When P>0, W>0 ----- State 'WATER' is active ,gives output value W=20, P=100
- After 50 sec State 'SOAK' will be active, gives output value S=70, W=0, P=100
- After 200 sec State 'WASH' will be active, gives output value A=50, S=0, P=100
- After 100 sec State 'RINSE' will be active, gives output value R=30, A=0, P=100
- After 20 sec State 'DRY' will be active, gives output value D=15, R=0, P=100
- After 50 sec State 'FINISH' will be active, gives output value F=10, P=100
- Process Completed
The Result from the simulation are:
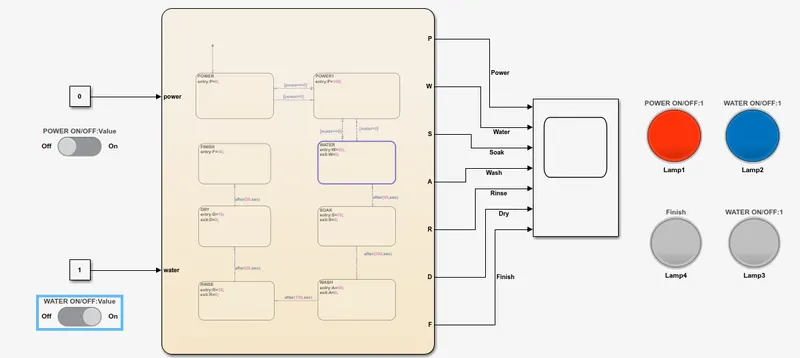
a) When no power supply.i.e P=0 & water supply is ON i.e. W=1 System was not active, Lamp1 shows RED, Lamp2 shows BLUE and Lamp3 shows NO COLOR.
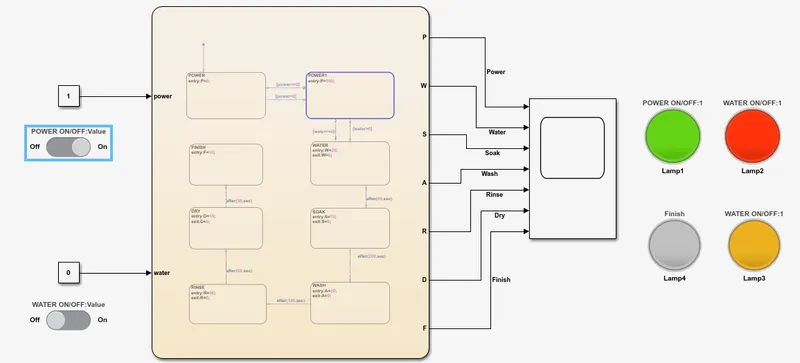
b) When Power Supply is available.i.e P=1 the system was activated: Lamp1 Shows GREEN. Water supply not available W=0: Lamp2 shows RED. Lamp3 Shows Yellow (INDICATING PROCESS STOPS)
c)When Power supply and Water supply are available.i.e.P=1 & W=1, Lamp1 shows GREEN, Lamp2 shows BLUE, Lamp3 shows NO COLOR (INDICATING PROCESS IS WORKING)
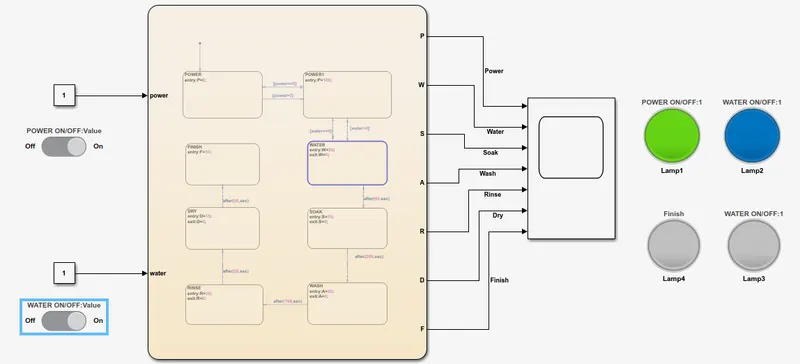
d) After runs according to the given conditions, Lamp4 shows GREEN (INDICATING ENTIRE PROCESS WAS COMPLETED)
The output from the scope according to the given set of time:
2) The control Logic for the Gear shift was made using the stateflow according to the given conditions. The simulink chart was also made:
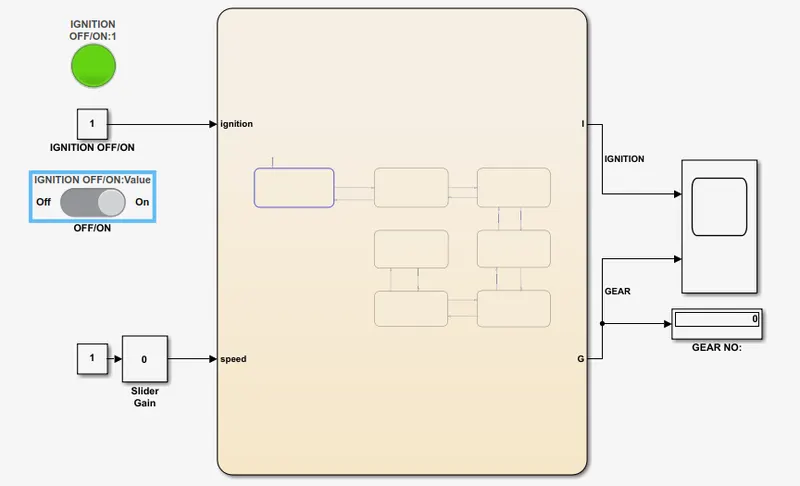
The simulink diagram for the Gear shift:
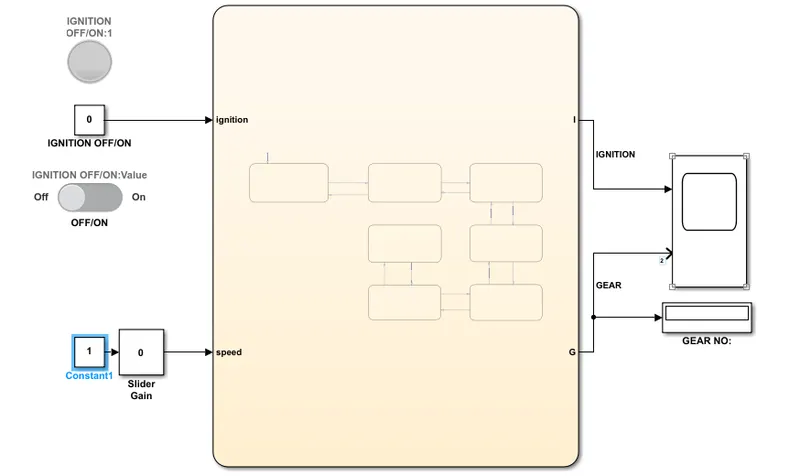
- For Ignition a 'constant block' is used. This 'constant block' is connected with the slider switch for turn on & off the system.
- For speed a 'slider gain block' is provided. it is used for giving variable speed input to the system while the simulation is running.
- The system should give the Gear output while the simulation is running, so the simulation time was set to 'inf' (infinity).
- A Display block is used to indicate the change in gear no w.r.t change in speed.
- A lamp is used to indicate the ignition is ON or OFF
The control logic for the Gear shift is:
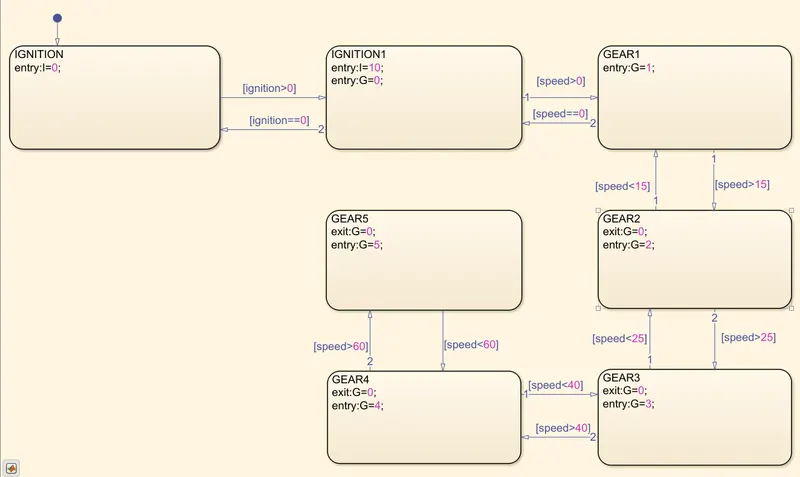
Logic operation behind the Gear shift control is:
When the ignition is ON, the system is activated, Lamp shows Green and check for the speed
- If speed=0, then the output from the gear display G =0
- If 0<speed<15, the output from the gear display G=1
- If 15<speed<25, the output from the gear diplay G=2
- If 25<speed<40, the output from the gear display G=3
- If 40<speed<60, the output from the gear display G=4
- Above 60, the output from the gear display G=5
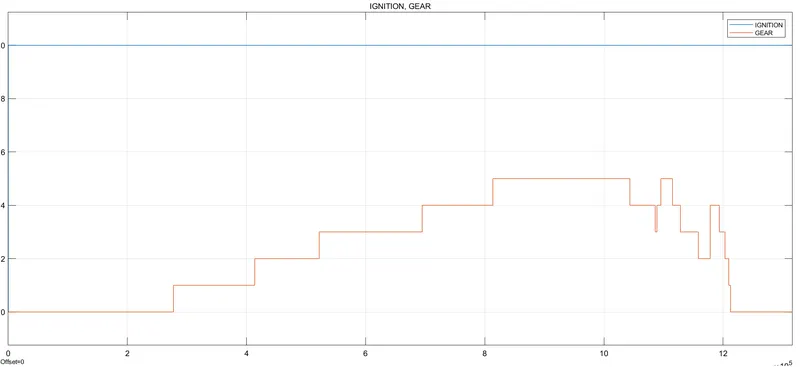
The Gear no will change up and down according to the change in speed.
The Result from the simulation are:
a) Igniton is ON, Lamp shows GREEN. Speed=0, Gear Display=0
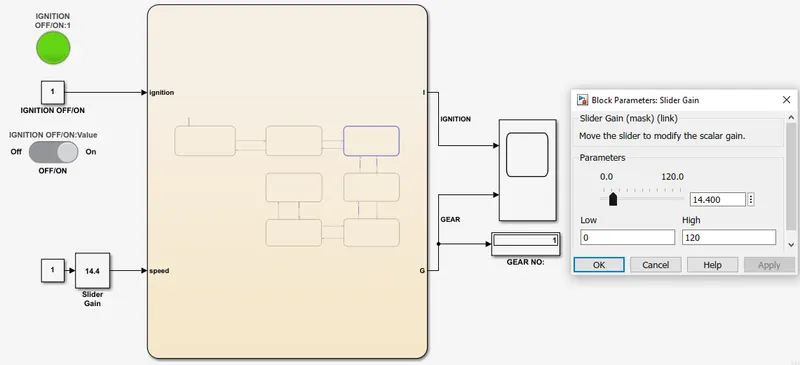
b)When Speed=14.4, Gear= 1
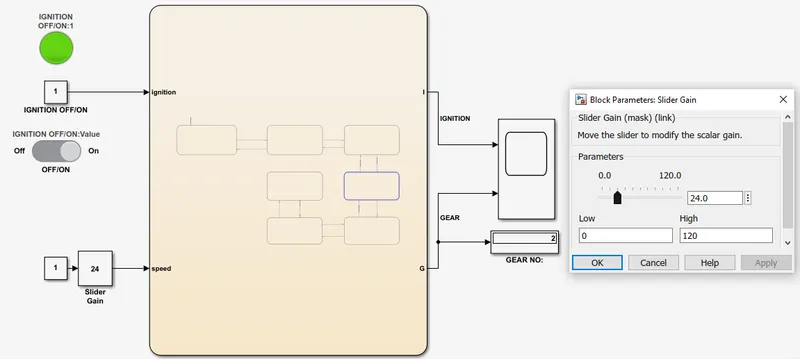
c) When Speed=24, Gear=2
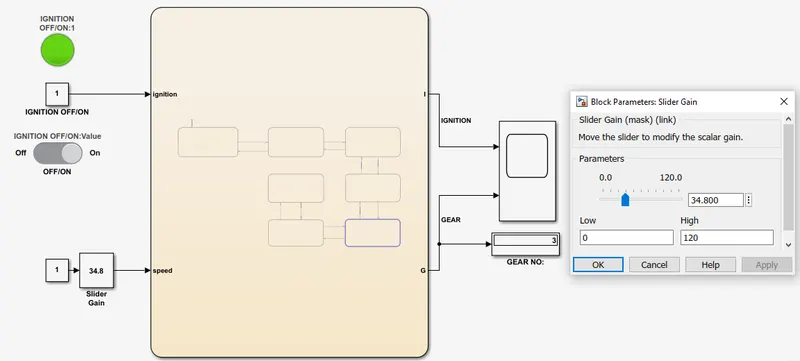
d) When Speed= 34.8, Gear=3
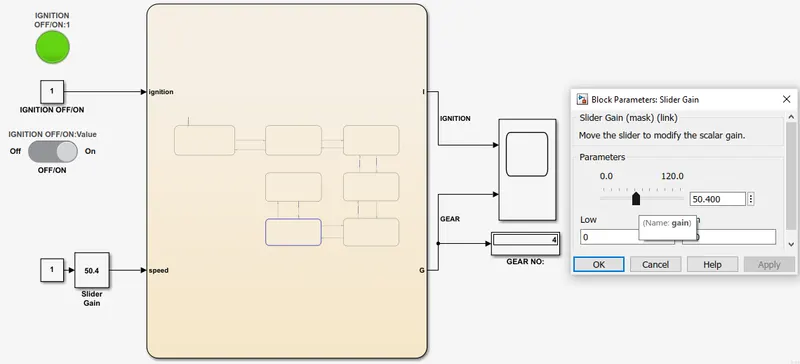
e) When Speed=50.4, Gear=4
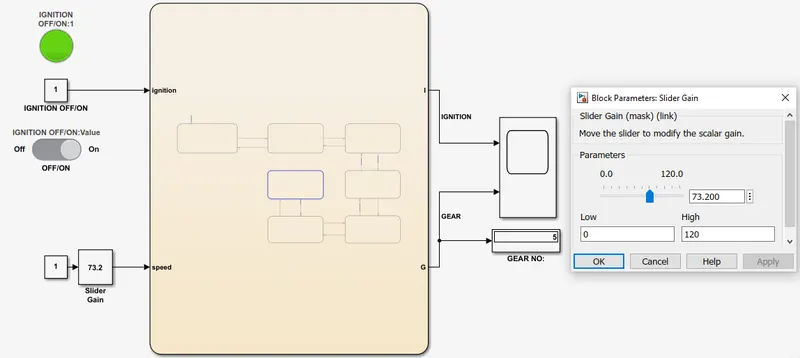
f) When Speed= 73.2, Gear=5
The output from the scope according to the change in speed:
FINAL RESULT:
The Stateflow for both Automatic Washing machine and Gear shift was made using simulink chart. The output obtained from both the system according to the given instructions.