Week 4.2: Project Transient simulation of flow over a throttle body
AIM:
- To analyze the flow over a throttle body, we need to conduct a steady-state simulation. The first step is to set up the simulation and run it. Once we have the results, we can post-process them to obtain pressure and velocity contours.
- To visualize the mesh, we can create a surface with edges. This will help us understand the geometry of the model and any potential issues that may affect the accuracy of the simulation.
- To gain insights into the simulation results, we can create plots for pressure, velocity, mass flow rate, and total cell count. These plots can help us identify any anomalies or trends in the data.
- Finally, to better understand how the throttle body affects the flow, we can create an animation that shows the movement of the throttle. This will help us visualize how the flow changes as the throttle opens and closes.
- By following these steps, we can obtain a comprehensive understanding of the flow over a throttle body and identify ways to optimize its performance.
INTRODUCTION:
Throttle Valve:
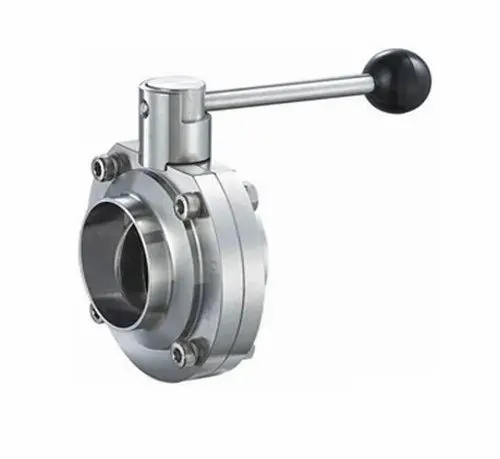
- A throttle valve is a type of valve used to regulate the flow of fluid from one point to another. Typically, there is a significant pressure difference between the upstream and downstream sides of the throttle valve. As the valve's flow restriction increases, the pressure loss also increases.
- In particular, a throttle valve is an essential component of an internal combustion engine. It is typically located in or just outside the carburetor and controls the volume of vaporized fuel charge delivered to the cylinders.
- Throttle valves are designed with an obstacle to control various parameters such as flow rate, temperature, and pressure. The flow is subject to restrictions and friction during the flow. The valve stem can be adjusted to raise or lower the flow path's size through the valve. Moreover, it is possible to stop the flow completely by closing the valve.
PROCEDURE:
- The Throttle geometry is imported to Converge as shown below using the Create Option:
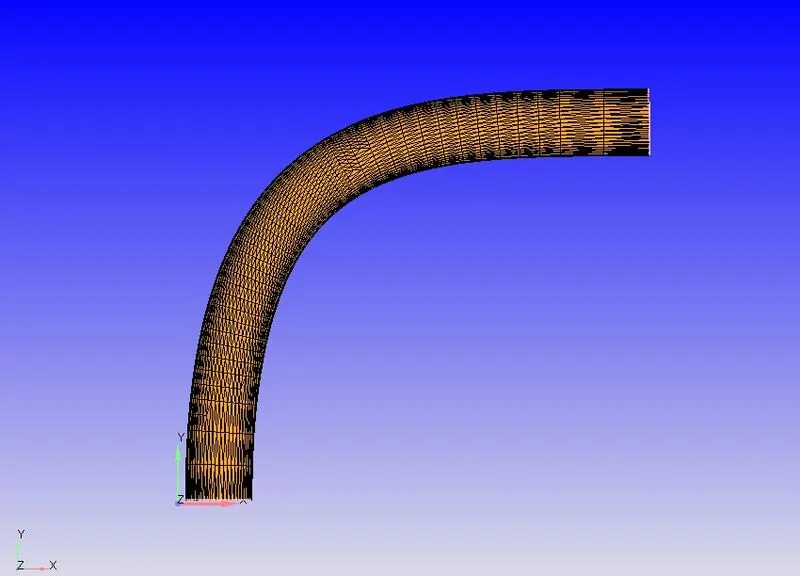
- Geometry is cleaned
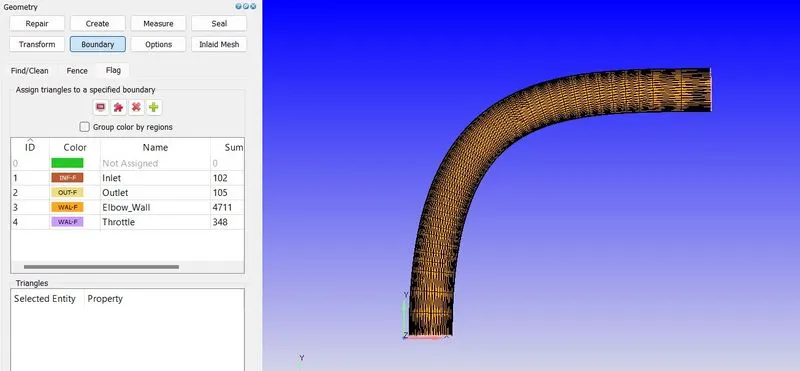
- Boundary is defined for each surface as shown below:
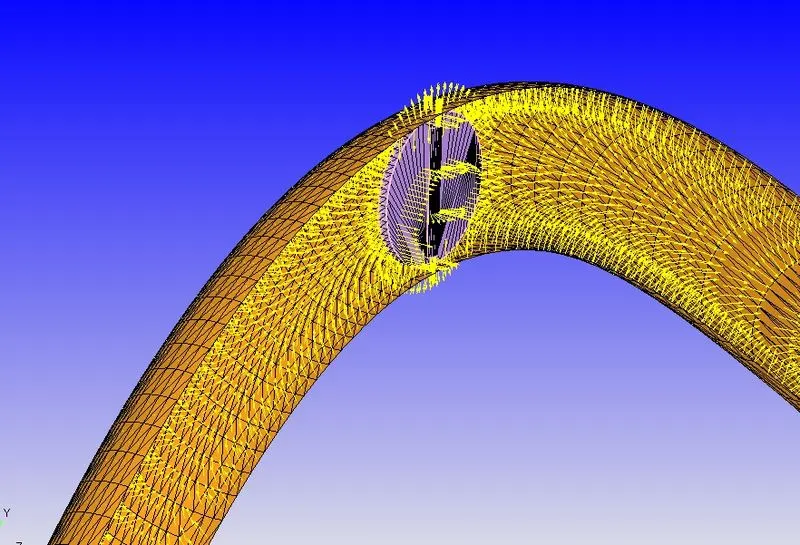
- The normals are defined as the direction inward of the surfaces towards the volume where the fluid exists.
- The Case Setup is Defined as shown below:
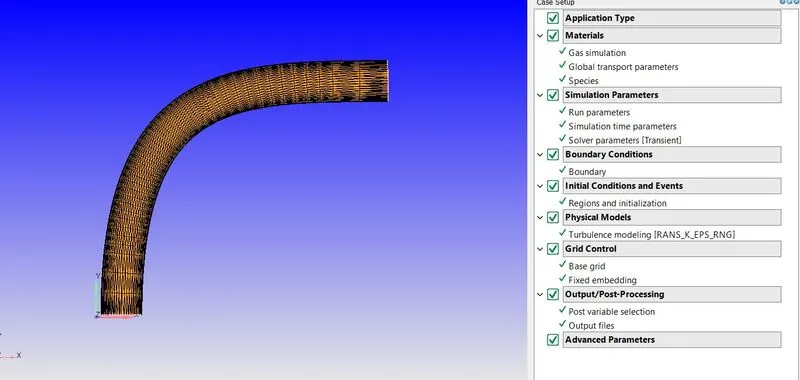
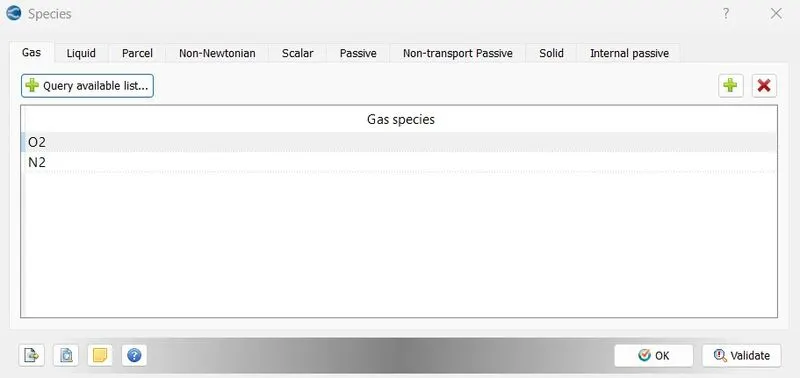
Species:
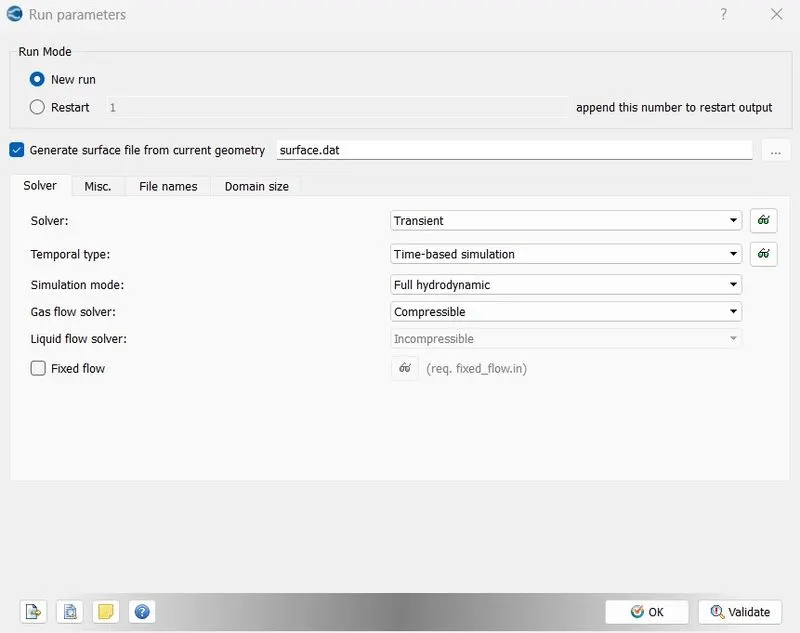
Run parameters:
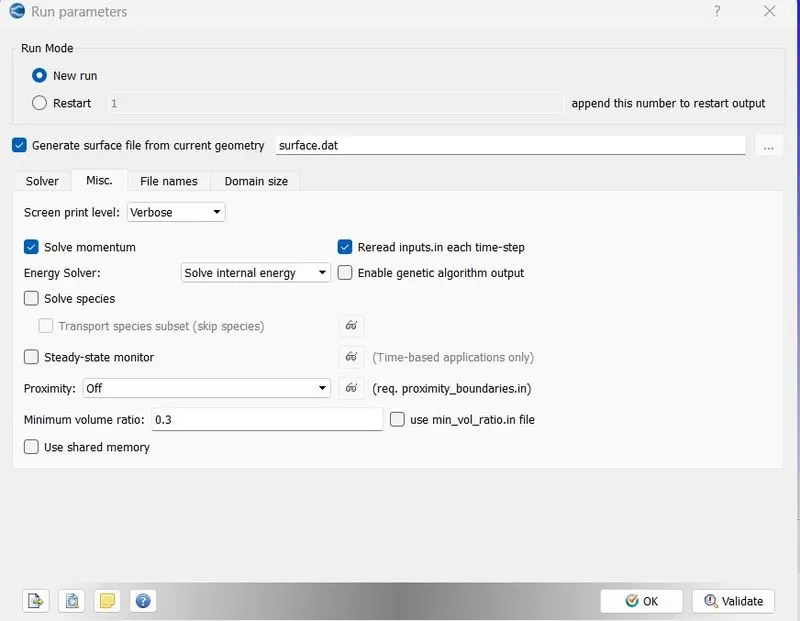
Simulation Time Parameters:
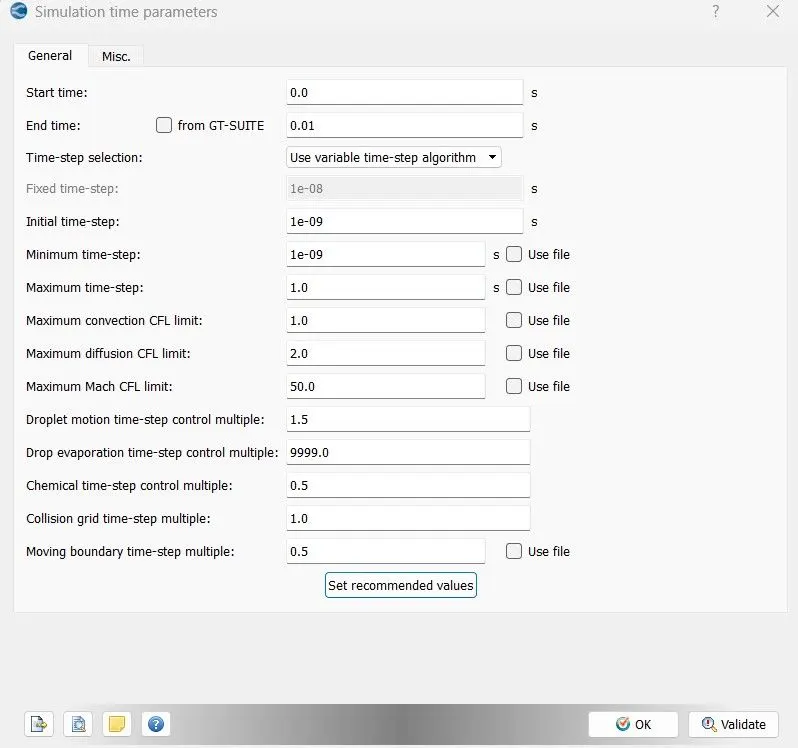
End time Calculation:
- Length of pipe: 0.2m
- Avg. velocity: 190m/s
[Speed=Distance/Time]
Therefore, Time = 0.2/190 = 0.001sec
Here, the cycle is run for 10times,
So (0.001sec)*(10) = 0.01seconds
Hence, End time = 0.01sec.
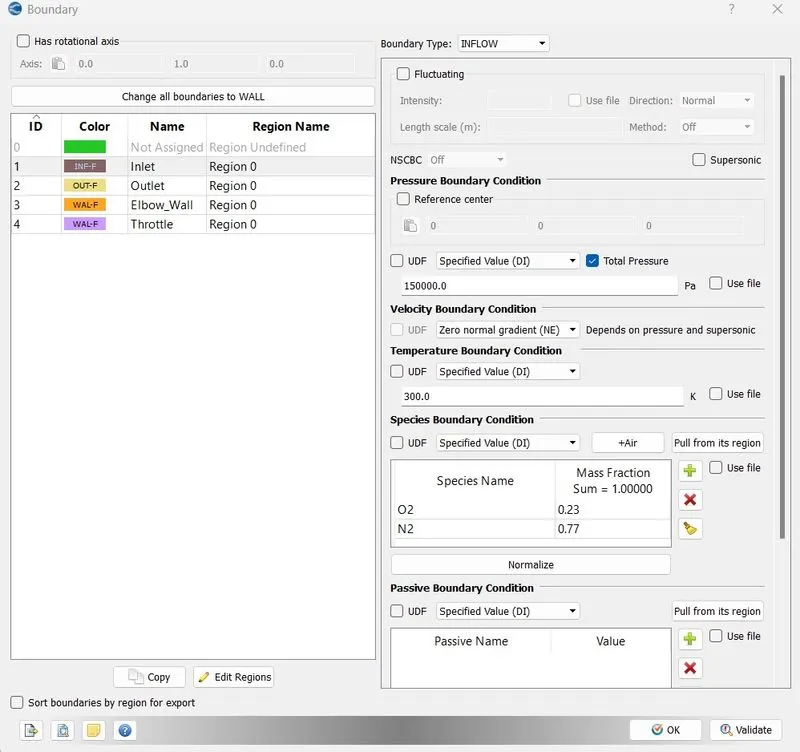
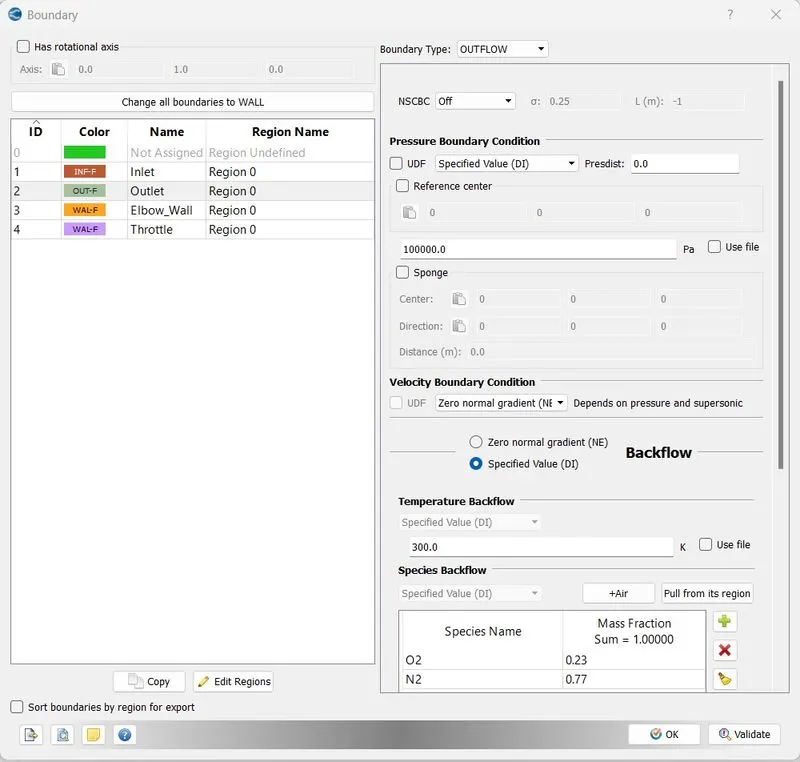
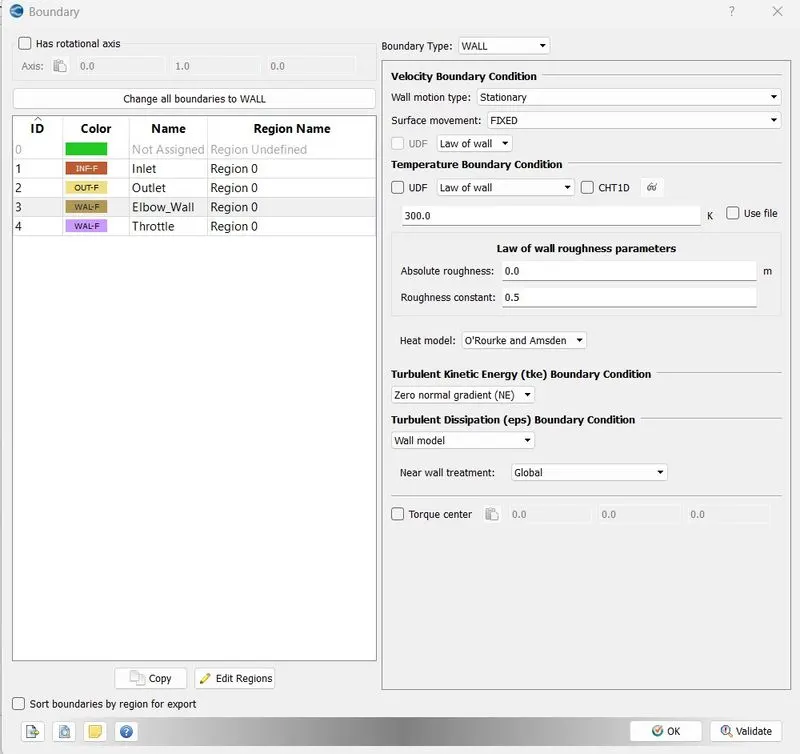
Boundary conditions:
- Inlet:
- Outlet:
- Elbow-Walls:
- Throttle:
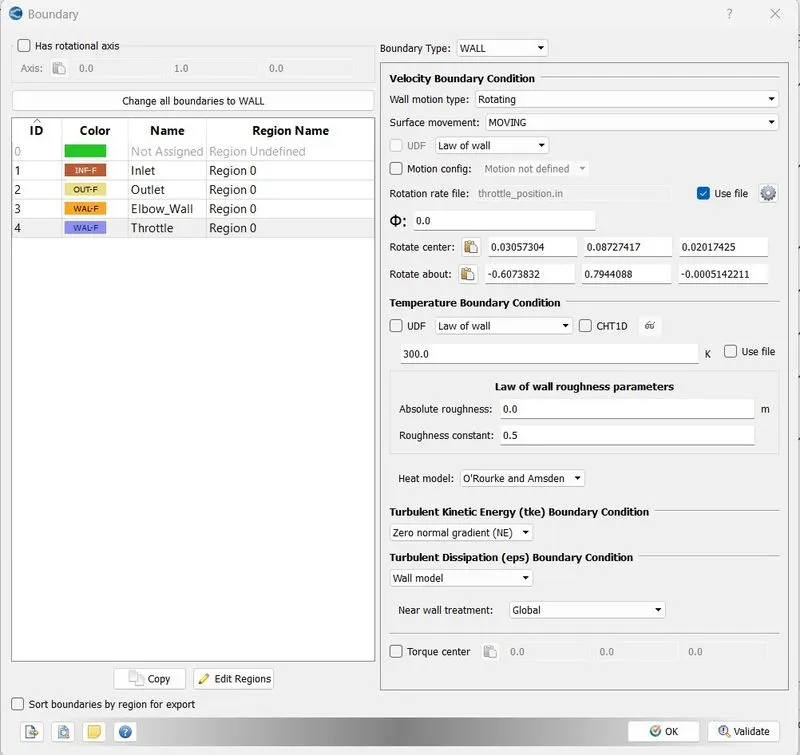
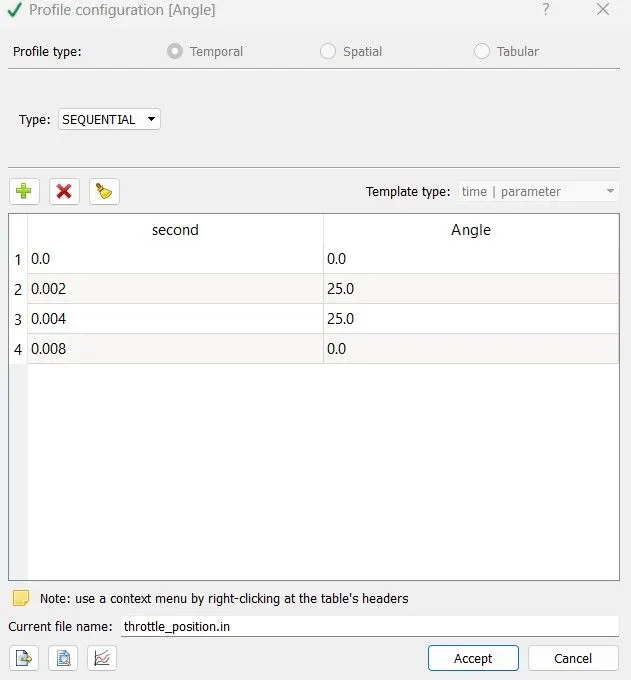
- Throttle Position:
The valve needs to rotate 25 degrees from 0 to 2 ms. It should maintain this position from 2 to 4 ms. Finally, it needs to return to its original position by 8 ms.
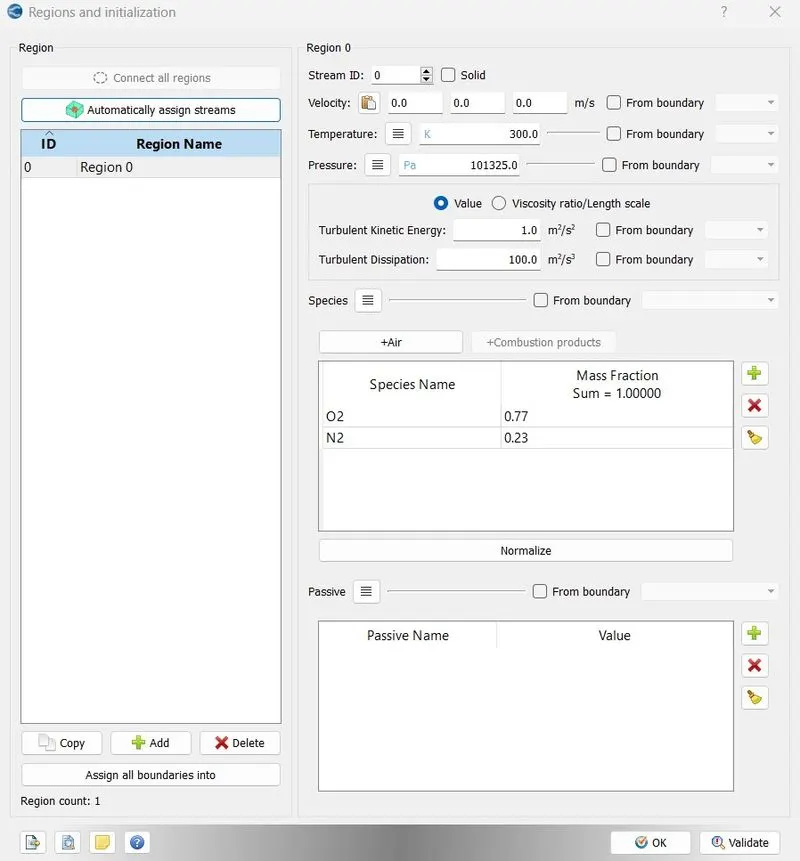
- Regions:
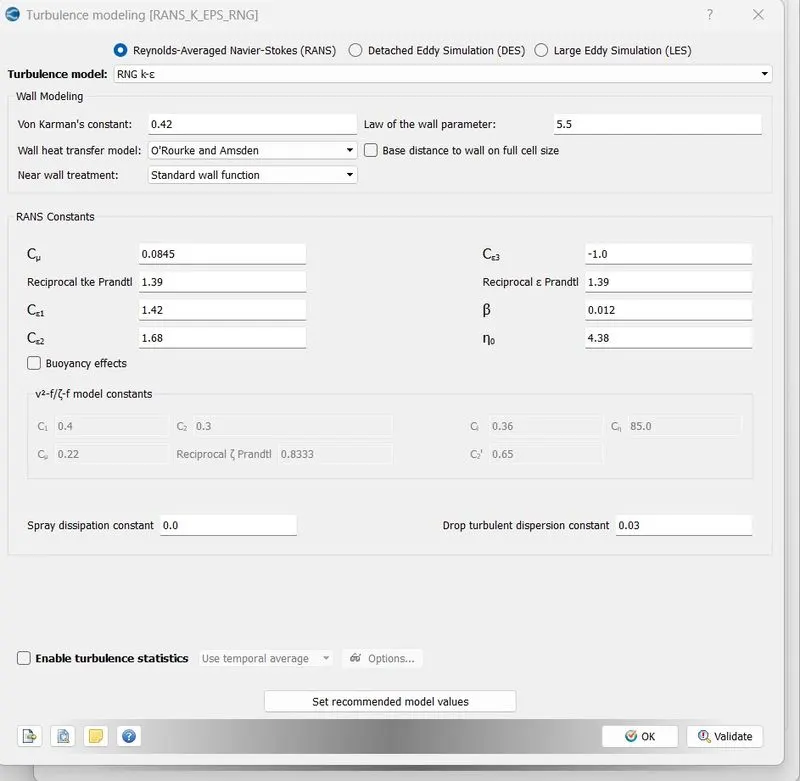
- Turbulence Modeling:
RANS_K_EPS_RNG
- Base grid:
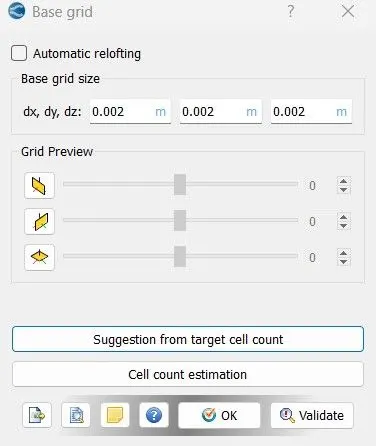
- Fixed Embedding:
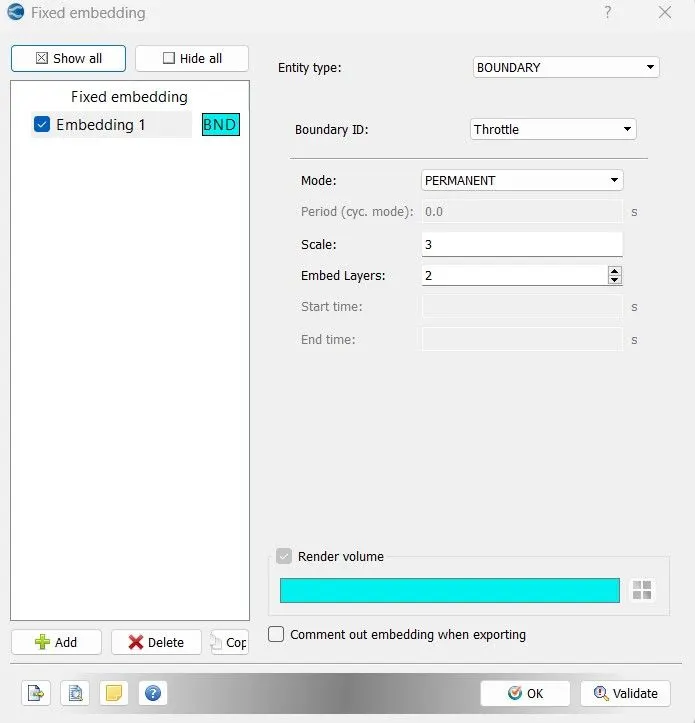
- Outputs:
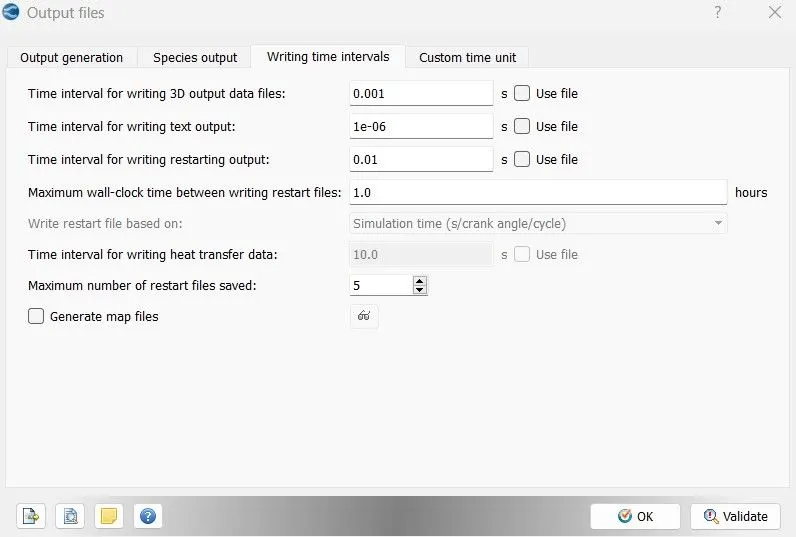
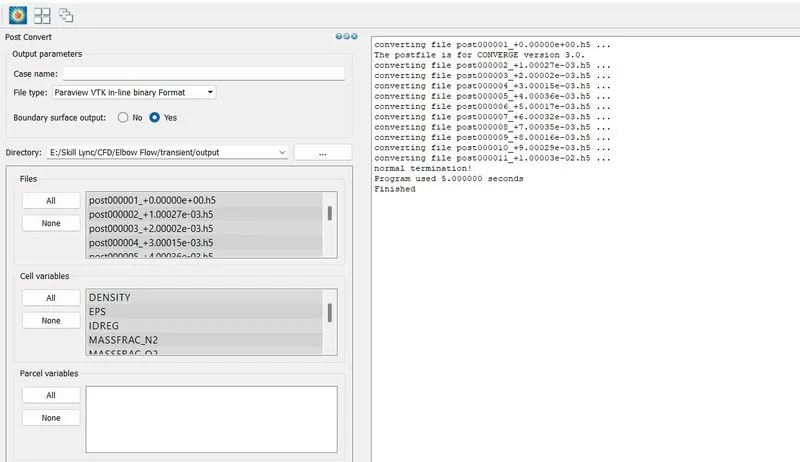
The Output files are now exported to the Simulation Folder as shown below:
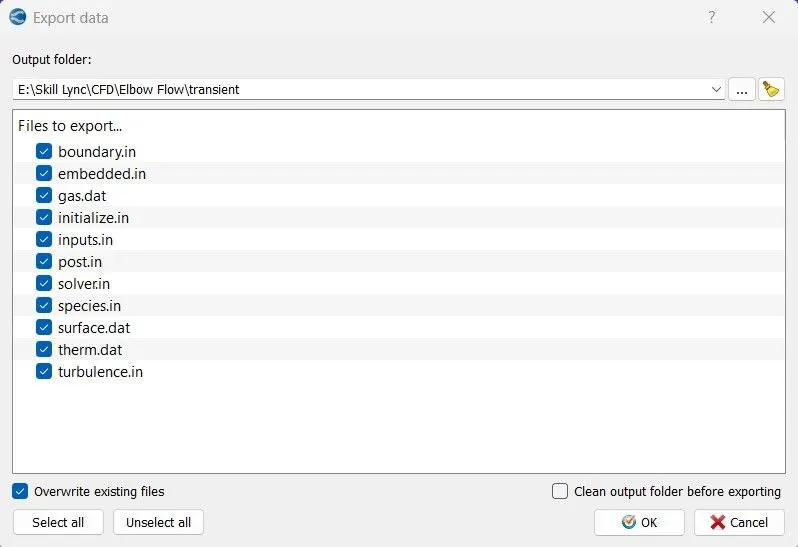
- The Exported Input files are used to simulate Cygwin
- All the Results are Post Processed into 3D Outputs & opened in ParaView
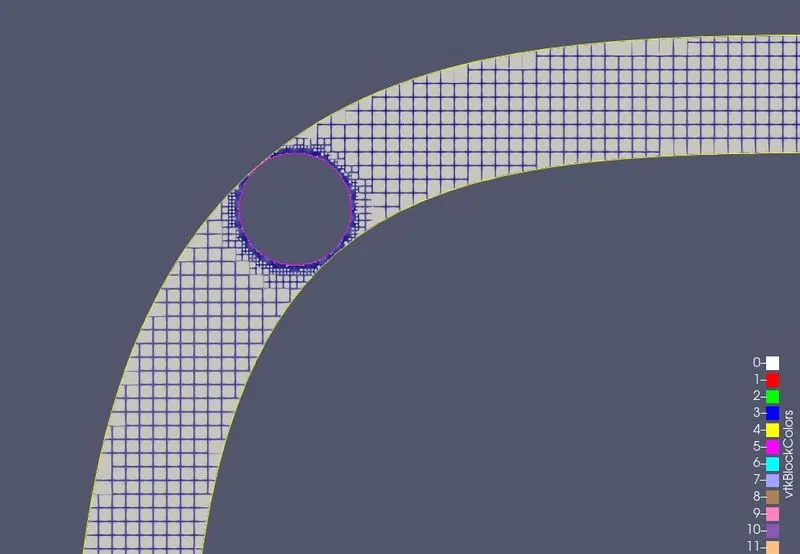
- Mesh Generation on the 2D mid surface is shown below using the slice command in PARAVIEW:
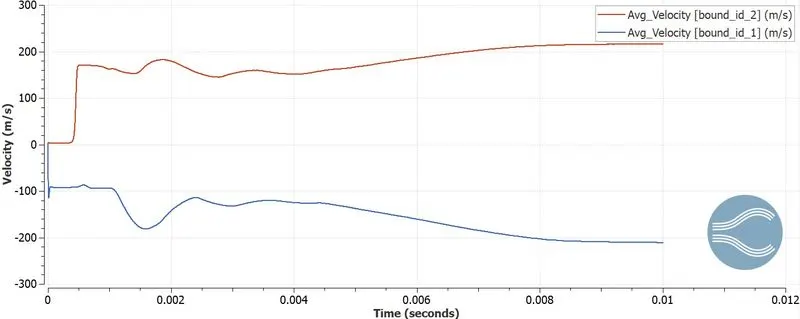
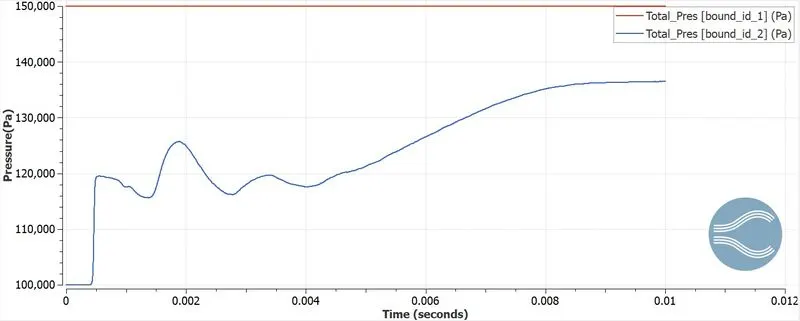
- Converge plot for velocity, pressure, mass flow rate, and the total cell count is plotted:
Velocity:
Pressure:
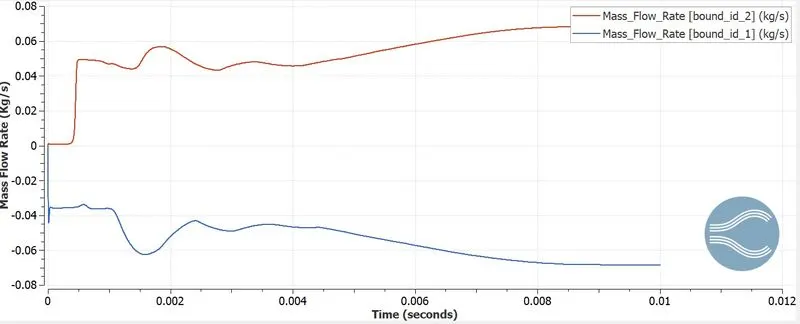
Mass Flow Rate:
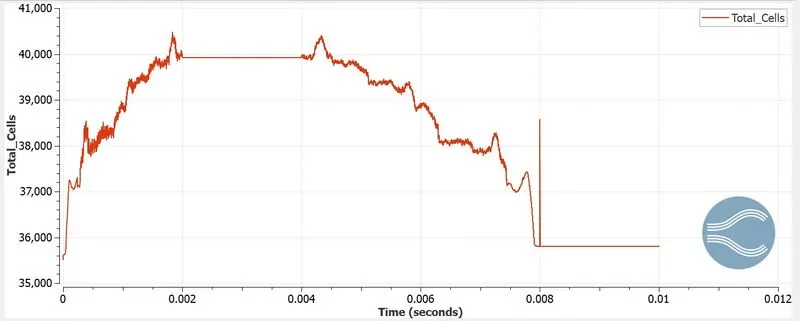
Total Cell Counts:
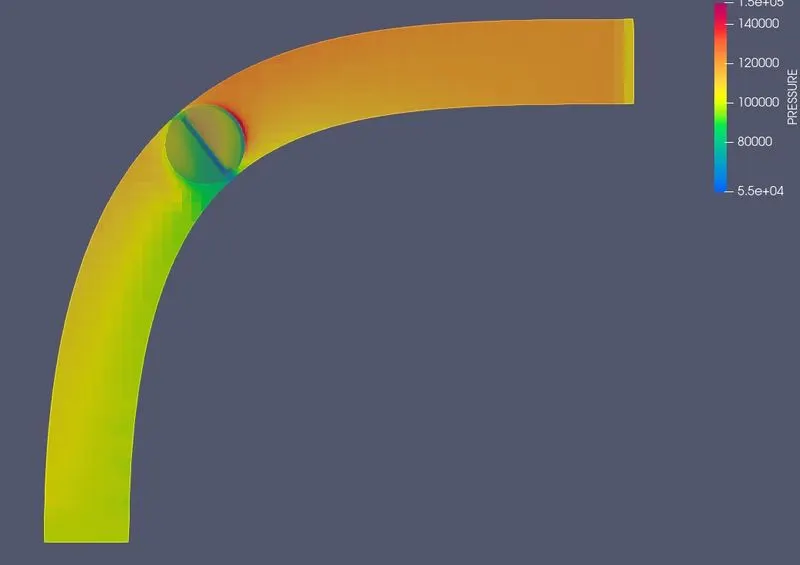
- Velocity and pressure contour are plotted over the sliced surface.
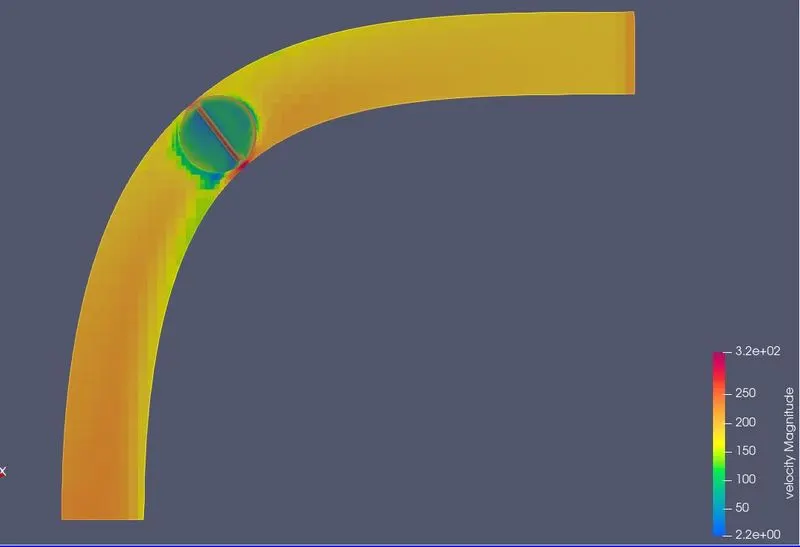
Velocity Contour:
Pressure contour:
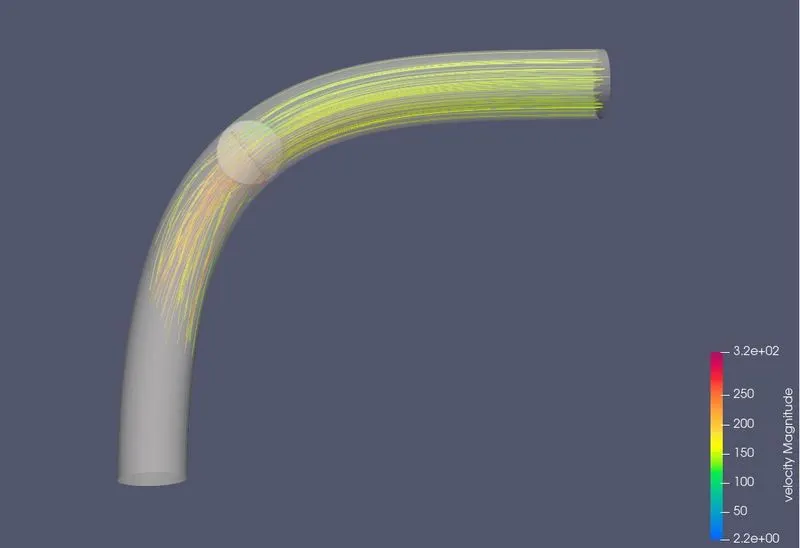
Velocity Streamline:
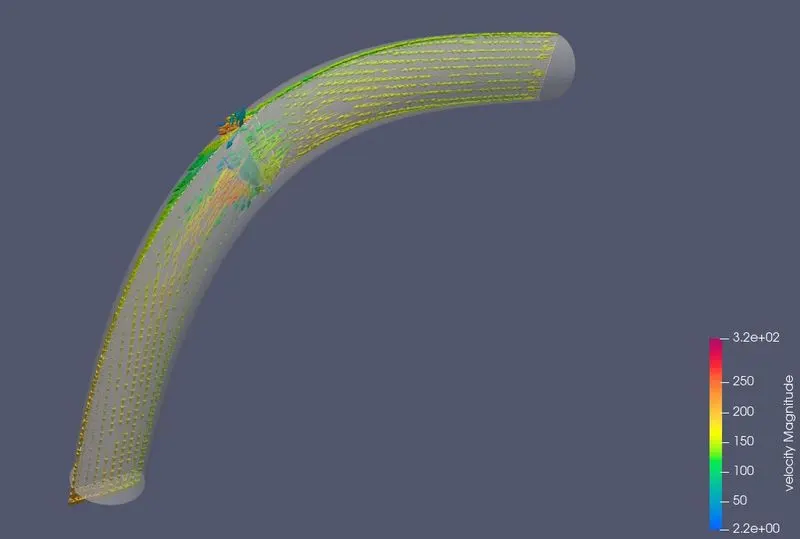
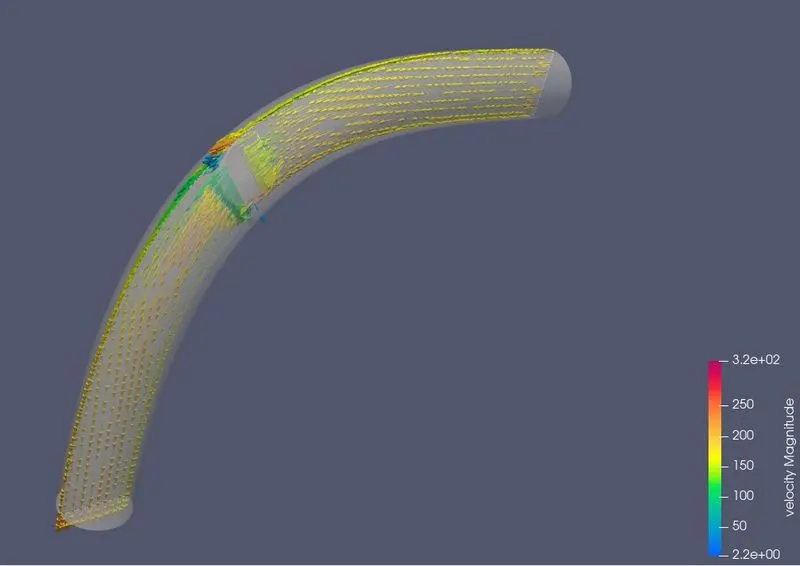
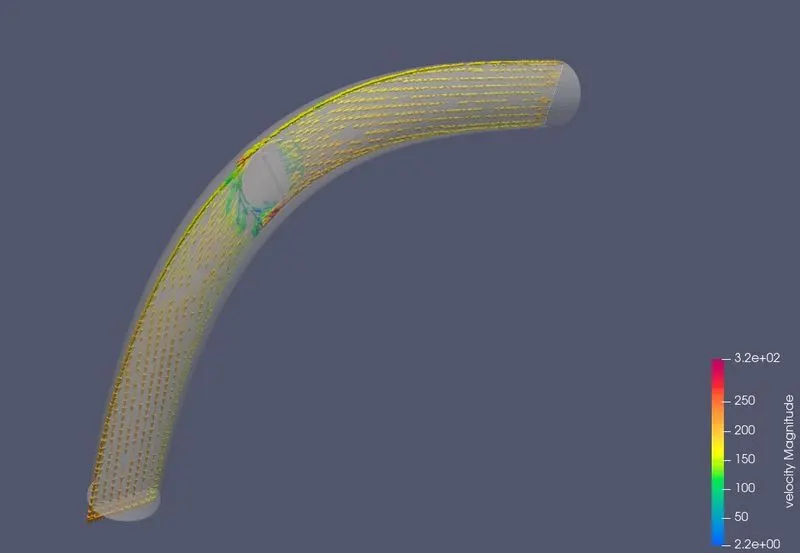
Velocity Vector:
- Create animation in the Paraview to show the flow over the throttle valve.
ANIMATIONS:
Velocity:
- Velocity Vector:
- Velocity Streamline:
Pressure:
RESULTS:
-
The shape of the contours indicates that the intake airflow is limited by the throttle plate, resulting in a restriction. The mass flow rate of incoming air is counterbalanced by the outflow rate.
-
When the flow restriction is reduced, energy loss is minimized, leading to an increase in velocity at the outlet.
-
Due to the implementation of a dynamic mesh, a larger number of cells are generated, resulting in longer simulation times.
CONCLUSION:
Converge CFD is employed to conduct transient simulations of the flow over a throttle body. Increasing the mesh refinement level allows for more precise results. Several plots, contours, and animations are generated to analyze the flow characteristics across the throttle body. The movement of the throttle is also recorded to enhance the comprehension of the flow behavior.