Week - 4
Aim:
State flow for the washing machine and gear shifting.
Objective :
- Implement control logic of a “washing machine” using Stateflow as per given sequence:
- If the power supply is available, the system gets activated
- If the Water supply is not available, stop the process & indicate through LED
- Soaking time should be 200s followed by Washing time of 100s.
- Then rinsing happens for the next 20s & dryer runs for 50s
After all the processes have completed turn on the finished LED
- Make a Simulink chart for the “Gear shift” logic as per the below conditions:
Speed Range(kmph) Gear
0 to 15 1
16 to 25 2
26 to 40 3
41 to 60 4
Above 61 5
Give speed input while the simulation is running & display the gear number.
Introduction:
Control logic is the part of a controller that defines how a reactive system responds to events or conditional changes. Applications for control logic include:
- Supervising how to switch between different modes of operation
- Scheduling a sequence of tasks or steps for a system
- Defining fault detection, isolation, and recovery logic.
Common tasks for modeling control logic include:
- Modeling hierarchical state machines for large-scale systems
- Adding flow charts to define complex control logic
- Defining orthogonal states to represent systems with parallelism
Stateflow provides a graphical language that includes state transition diagrams, flow charts, state transition tables, and truth tables. You can use Stateflow to describe how MATLAB algorithms and Simulink models react to input signals, events, and time-based conditions.
Stateflow enables you to design and develop supervisory control, task scheduling, fault management, communication protocols, user interfaces, and hybrid systems.
With Stateflow, you model combinatorial and sequential decision logic that can be simulated as a block within a Simulink model or executed as an object in MATLAB. Graphical animation enables you to analyze and debug your logic while it is executing. Edit-time and run-time checks ensure design consistency and completeness before implementation.
Procedure :
Washing machine :
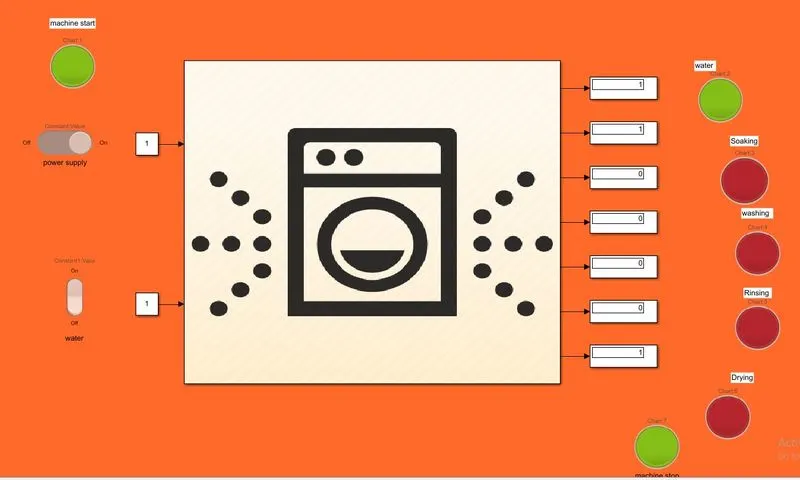
Explanation :
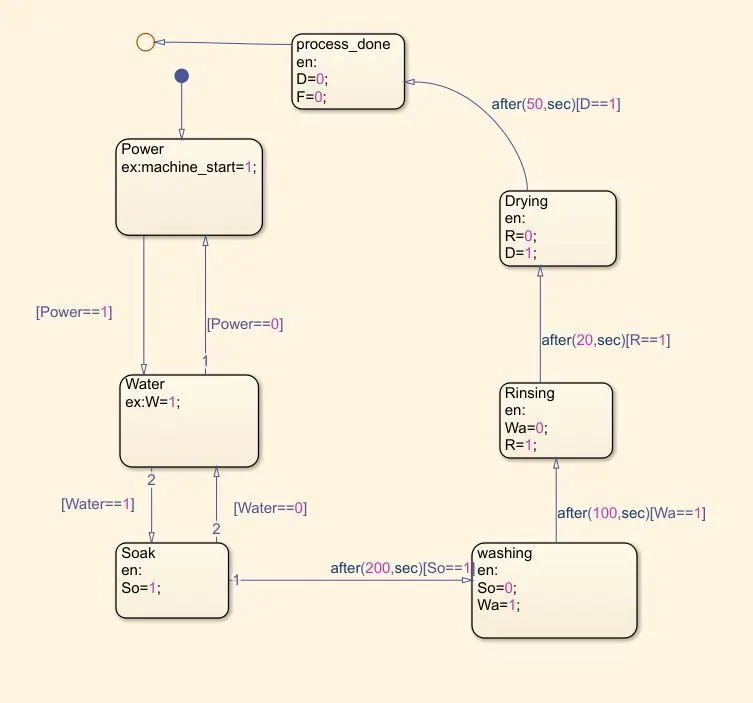
- To start with we have created a chart using ‘CHART BLOCK’ to define the logic of the washing machine.
- Inside this chart, state blocks are called to define the states. The first state is the ‘Power’ state, this is where the program checks whether the power is ON/OFF. If the power is ON the process will go to the next state or else it will not go further. Here we have defined a variable ‘Power’ as it will help us to indicate whether this particular state is going On or not.
- Next, we have the ‘Water’ state where water will be filled, and similar to that of the power state we have defined variable ‘W’ which will help us to see whether is being filled or not. The process between ‘Power State’ and ‘Water State’ is defined as if power is equal to one which means if power is on then only its water state will start, and power equal to zero refers as power is OFF then it will remain in power state only.
- Now the next state is ‘Soak State’, this is where the clothes are soaked once the water is filled. Here we have defined inside this state that when it enters the state the value of variable ‘S’ will 1 which means that this state is going on.
- Now next is the ‘Washing State’, this is where the clothes are washed, here as per the conditions mentioned above after 200s of soaking the washing state takes place. This condition is mentioned from between ‘Soak State’ and ‘Wash State’. Inside the washing state, we have mentioned So=0 and W=1 which means that after the soaking is done the lamp for the soaking will switch off and the washing process will start.
- Then, ‘Rinse State’ takes place where all the water is drained out, here when the state is in this state it will indicate ‘R=1’ once this state is over it will indicate ‘R=0’ and it will move next state. The process between ‘Wash State’ and ‘Rinse State’ is defined as per the condition mentioned above.
- The next stage is the ‘Dry State’ where the clothes are dried inside the machine. Similar conditions are defined in this state as in previous states, and the process is defined as it is mentioned above.
- The last state is the ‘Finish state’, this where the process ends and the power needs to be switched off manually. Here also similar conditions are mentioned.
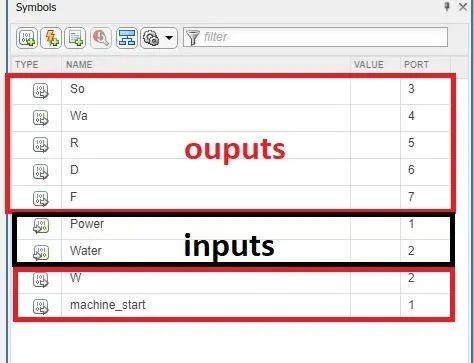
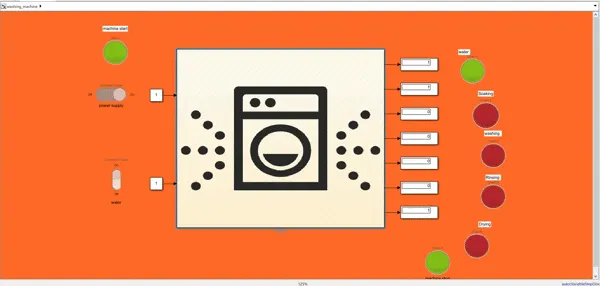
- Now once the machine logic is created we have defined the variables entered as output variables and power and water as inputs as these have to be provided to the machine in real-time.
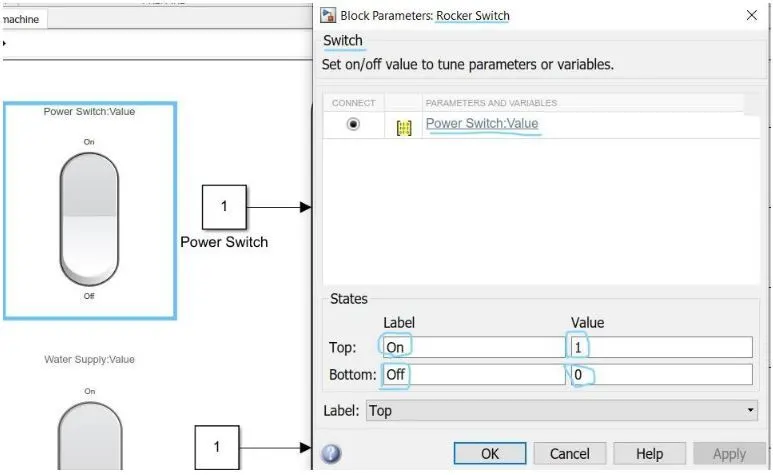
- To give power and water as input we have used a ‘Slider Switch Block’ and ‘Constant Block’ is used. Each slider switch is connected to each constant block. When the slider switch is ON the value in the constant block will be ‘1’ and this constant block is connected to the chart block where the washing machine program is defined.
- If the slider switch is OFF the value in the constant block is ‘0’ which indicated there will no water or power supply. By this way, we have defined the inputs. And for the outputs, we have connected each one with each ‘Display Block’. This display block will show value 1 if the process is currently progressing and 0 if it not happening.
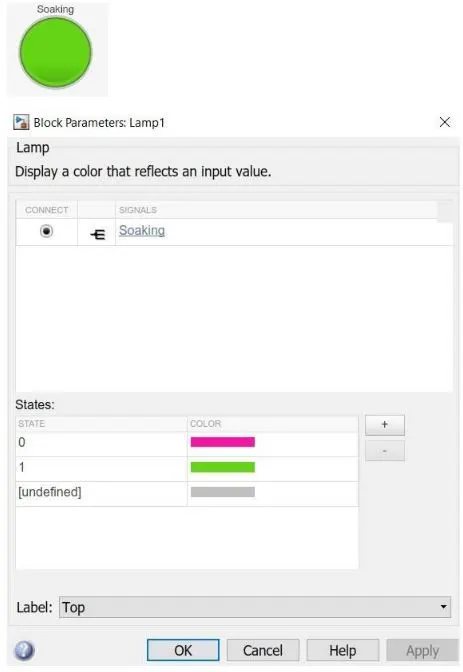
- These display blocks are then connected to ‘Lamp Block’ which will turn green when a particular state is going and it will be red if that particular state is not going on.
- To set conditions for the lamp block, double click on it set the conditions as shown.
- Lastly, the number of outputs can be numbered from the simulation>Symbol pane.
Gear shifting :
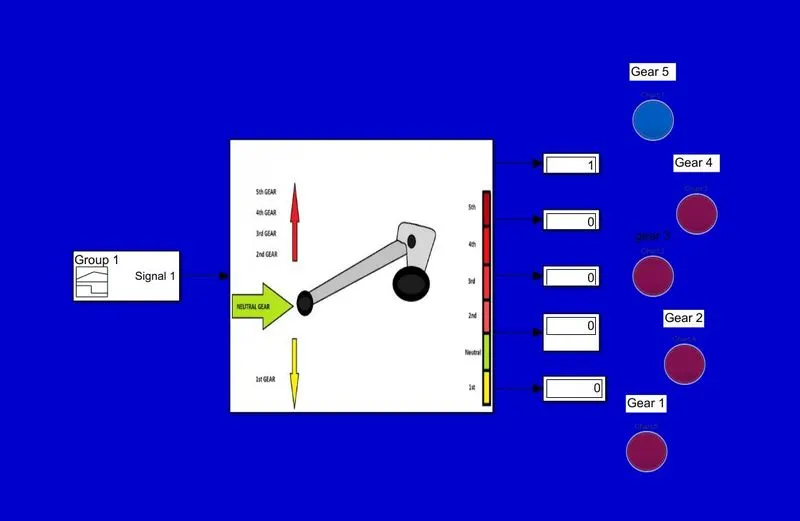
Explanation :
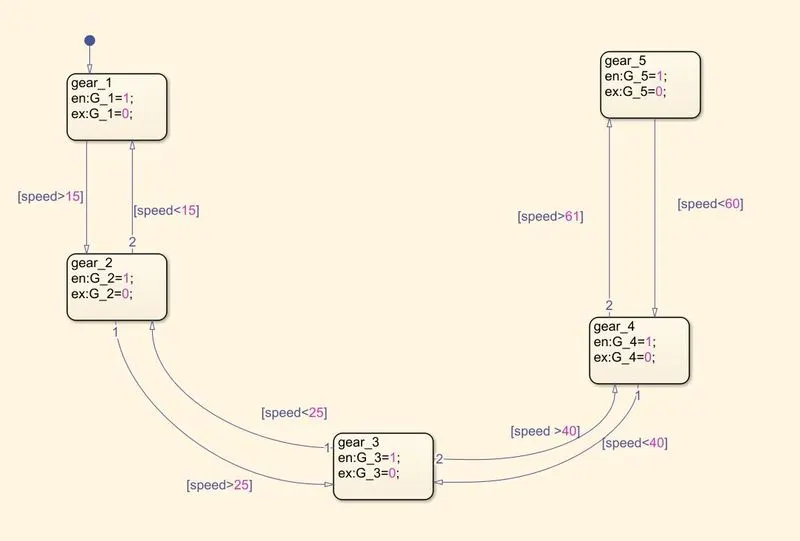
- For the gear shifting, we have used ‘CHART BLOCK’ to dene the gear shift logic for the conditions given above.
- First, we have defined 5 states namely ‘Gear 1’, ‘Gear 2’, ‘Gear 3’, ‘Gear 4’, ‘Gear 5’.
- Now to shift from one state to another we have defined the conditions of the speeds as mentioned above.
- We have also defined values inside the states which represent that when that particular state is going on it will display the value that is defined in it. This will help to see that which is gear is the vehicle when at a particular speed.
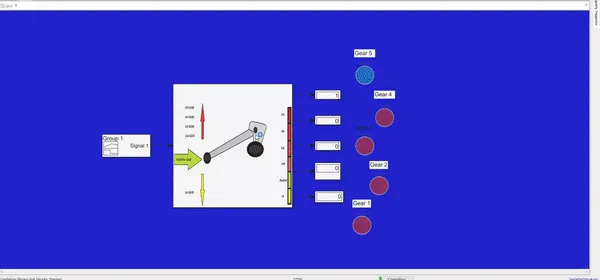
- We have defined speed as input for the chart as the gears change only on basis of speed and variable ‘G1 till 5’ is the defined output of the chart as it tells us, which gear is the vehicle in. That means if the input is matched for each gear it is 1 and if not it 0.
- Now to give speed as input we have used a ‘Signal Builder Block’, where we have defined the different speeds.
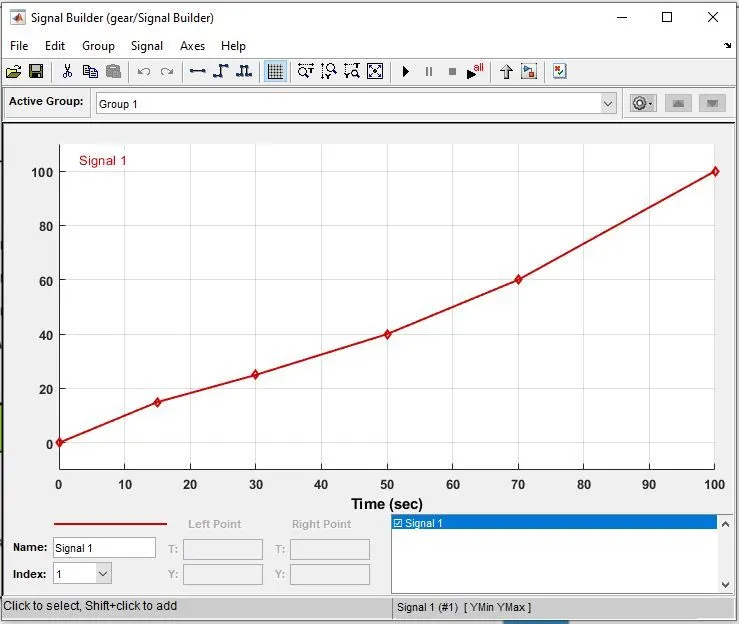
7.Now according to these speeds, the gears in the chart block will change. To indicate this change in gears we have used ‘Lamp Block’. We have set the values of lamp blocks such that when a gear is executed that particular gear lamp will turn Green.
8.Now when we run the model, we get the above results, thus represents the shifts in gears at different speeds.
Blocks Used
- Chart
A finite state machine is a representation of an event-driven (reactive) system. In an event-driven system, the system responds to an event by making a transition from one state (mode) to another. This transition occurs if the condition defining the change is true.
- Display
The Display block shows the value of the input data. You can specify the frequency of the display. For numeric input data, you can also specify the format of the display.
- Constant
The Constant block generates a real or complex constant value signal. Use this block to provide a constant signal input.
- Lamp
The Lamp block displays a color indicating the value of the input signal. You can use the Lamp block with other Dashboard blocks to build an interactive dashboard of controls and indicators for your model. You can specify pairs of input values and colors to provide the information you want during the simulation.
- Rocker Switch:
The Rocker Switch block toggles the value of the connected block parameter between two values during simulation. For example, you can connect the Rocker Switch block to a Switch block in your model and change its state during the simulation.
Results :
Washing machine simulation :
gear shifting simulation:
Conclusion :
Learned about the control logic and how to create the models for some systems like here washing machine and gear shifting using the charts and state flow blocks.