Week - 4
AIM:
1. To implement the control logic of a washing machine using stateflow.
2. To also create a gear shift logic using stateflow.
INTRODUCTION:
1. Control logic is the key part of any model that we create. It is the part which controls the operations of the model. It responds to the input given by the user, and performs automated tasks, which we will structure into the model. We can build our own control logic using the tool STATEFLOW, a built-in graphical software in simulink.
2. Stateflow is a control logic tool available in simulink to create reactive systems. You can create flowcharts, state machines using stateflow within a simulink model. To create a stateflow, use the CHART block available in the SIMULINK library. Let us look at how control logic is implemented using STATEFLOW, for the following problems.
PROCEDURE: (WASHING MACHINE CONTROL LOGIC)
1. We are asked to create a control logic for a washing machine. The operating conditions are given below:
- If the power supply is available, the system gets activated.
- If the Water supply is not available, stop the process & indicate through LED
- Soaking time should be 200s followed by Washing time of 100s.
- Then rinsing happens for next 20s & dryer runs for 50s.
2. Now create a CHART block in the SIMULINK BLANK MODEL. The control logic is built within the chart, and its stateflow is attached below:
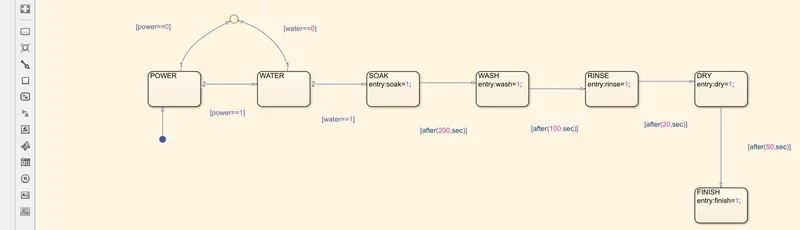
The control logic is explained below.
3. To create a new state window within the chart block, click on the rectangular box available to the left of your screen.You can add titles and the state action (operation that needs to be carried out if the transition condition is satisfied).
4. The first two blocks have no state action. We are asked to proceed to the soaking process, if the water and power supply are available. Consider the binary input for water and power.(1 being available & 0 not available). Create the arrow mark to connect the block with the next state by simply left clicking the border of the state block, and attach them to the successive block. The condition is power==1 & water==1.
5. If water & power supply are not given, we must stop the entire process. Create a junction, preferably above the two initial state blocks and connect them. The condition is power==0 & water ==0.
6. We are asked to indicate every single process of the washing machine through LED's. Hence create binary input & output for all processes.
7. Now the next state is the soaking & washing. We are asked to soak clothes for 200 secs and wash them for 100 secs. Create state blocks in series, connect them with the transition condition as [after(200,secs)] & [after(100,secs)]. The state action must be provide inside the block. Its syntax will be:
entry:(variable name)=(output);
Our state action is given as: entry:soak=1;, & entry:wash=1;
Meaning that if the transiton condition is satisfied, denote the process soak & wash as completed.
8. Then rinsing and drying will follow. We are asked to rinse for 20 secs and dry them for 50 secs. Create two more state blocks and provide the state action and transition conditions. Define them in a manner similar to that of washing and soaking. The state action for rinsing is entry:rinse=1; & drying is entry:dry=1. The condition is [after(20,secs)] & [after(50,secs)].
9. Now we have to create the final state block called the finish block and connect it with the drying state block. Its state action will be entry:finish=1;.
10. After completing the stateflow, we must define the input and output for the chart. This is done with the help of SYMBOLS PANE option, which will create data sets and the type of data sets. The symbols pane for this stateflow is shown below:
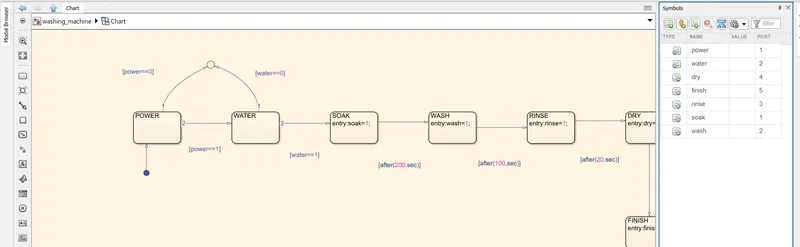
The symbols pane option, when clicked will create a colomn at the right corner of the chart window. It will display the variables used in the state action and transition condition. We used the following variables in the transition condition and state action:
a). Power.(Input)
b). Water.(Input)
c). Soak. (Output)
d). Wash. (Output)
e). Rinse. (Output)
f). Dry. (Output)
g). Finish. (Output)
These varaiables will be displayed in the colomn. We have to decide the type of data, input or output. In the type colomn, we can choose our data type. After choosing, click on apply to make them as input and output ports to the chart. After exiting from the chart window we can see the block as follows:
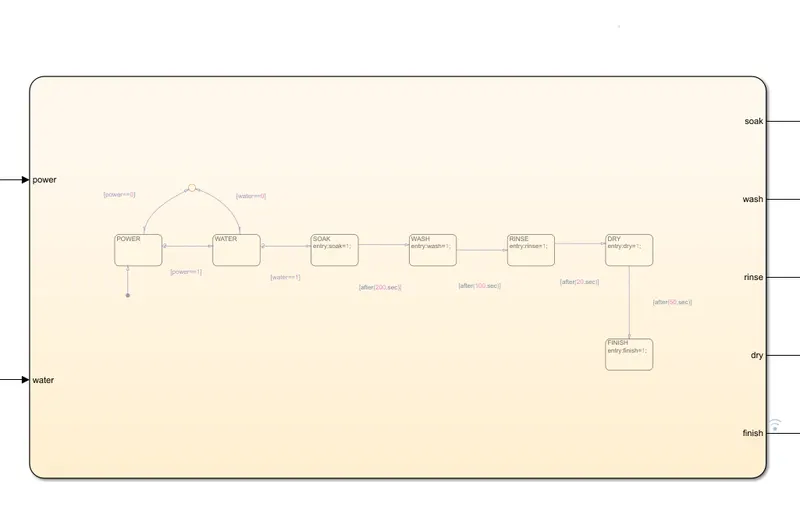
11. Now let us look at the main block diagram.
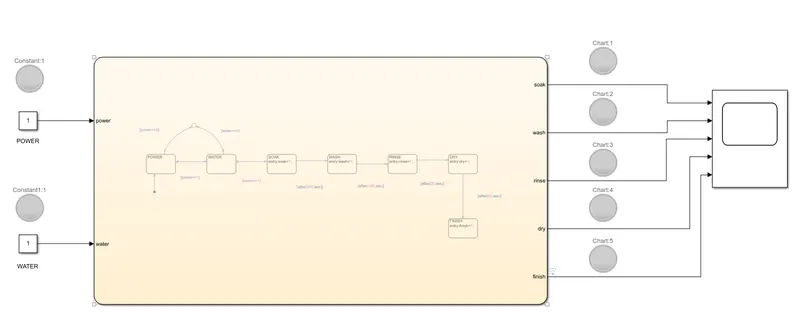
We have connected lamps at all input & output ports of the chart because we are asked to denote all proecsses via LED's. A scope block is also connected. Define the state conditions for the lamps.(1 is green meaning that the process is completed & 0 is red indicating that the process is not completed). Now let us run the logic for different values of stop time and view the results.
RESULTS:
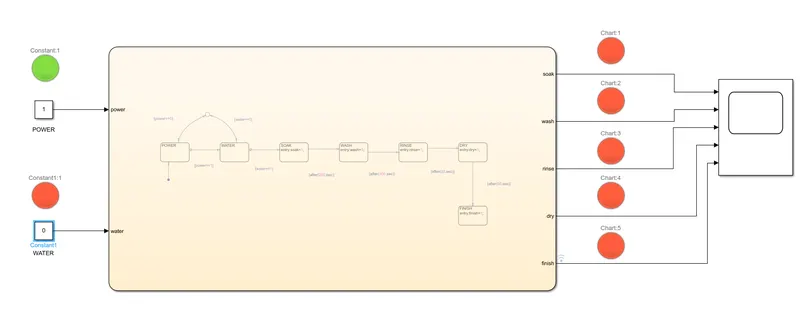
1. Water =0 & Power=1 for t=0 secs.
2. Water=1 & Power =1 for t=300 secs.
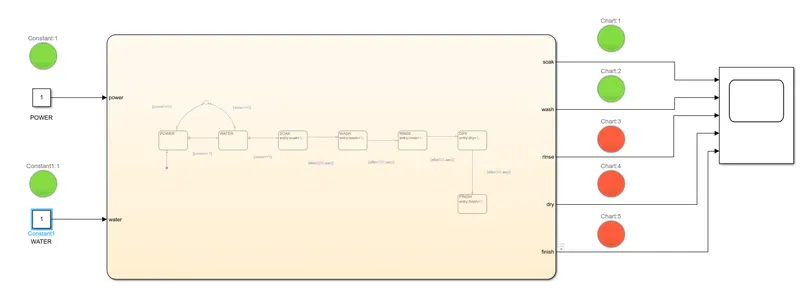
Indicating that soaking and washing are completed but the rest are not completed.
3. water=1 & power=1 for t=500 secs.
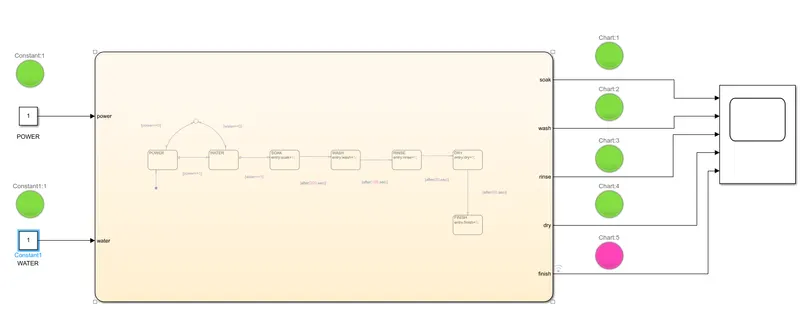
Created a different colour for the finish lamp in order to indicate that the entire cycle is completed.
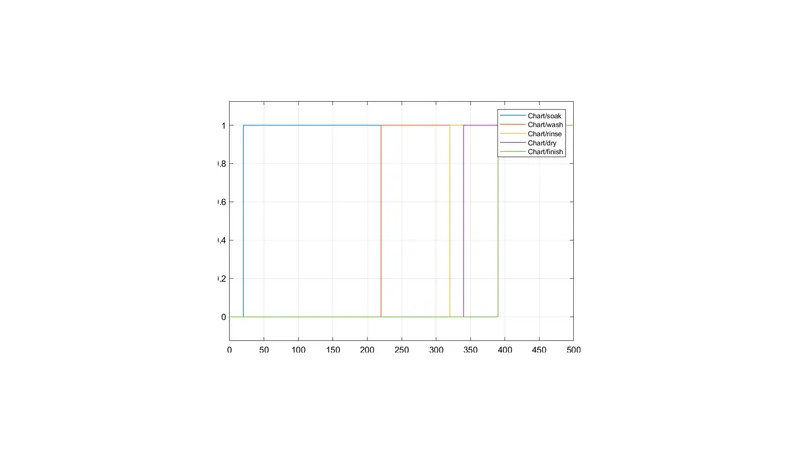
The plot is also attached below.
PROCEDURE: (GEAR SHIFT CONTROL LOGIC)
1. The operating conditions of the problem are given below:
Speed Range(kmph) Gear
0 to 15 1
16 to 25 2
26 to 40 3
41 to 60 4
Above 61 5
Give speed input while the simulation is running & display the gear number.
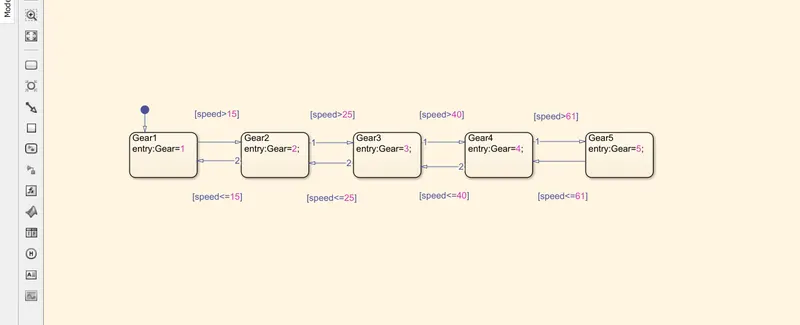
2. First let us create the stateflow chart for the given problem. The stateflow logic is attached below:
3. We have to display the gear number at the end of the system. So the state action must be given appropriately.
4. First create state blocks (5 in total) for the control logic and name them as Gear1, Gear2 , Gear3, Gear4, Gear5 respectively.
5. Now the state action is given for all five blocks. Since we already know the syntax, let us directly look at the state action for all the five different blocks:
Block1 - entry:Gear=1;
Block2 - entry:Gear=2;
Block3 - entry:Gear=3;
Block4 - entry:Gear=4;
Block5 - entry:Gear=5;
6. Now we have to connect the state blocks and create the conditions. Since this is a gear shift logic in a vehicle, we must create forward transitions & reverse transtions, as speed in a vehicle may increase or decrease.
7. The conditions for various state blocks are given below:
Forward transition: Reverse transition:
Block1-2 = speed>15. Block5-4 = speed<=61.
Block2-3 = speed>25. Block4-3 = speed<=41.
Block3-4 = speed>40. Block3-2 = speed<=26.
Block4-5 = speed>60. Block2-1 = speed<=15.
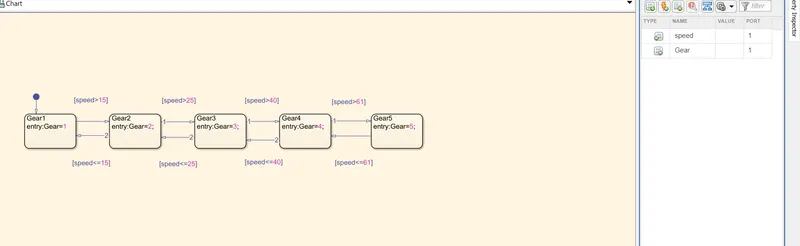
8. Now we must specify the input & output data for the chart using the symbols pane option. Here the speed is the input and gear is the output.
9. Now let us look at the overall block diagram.
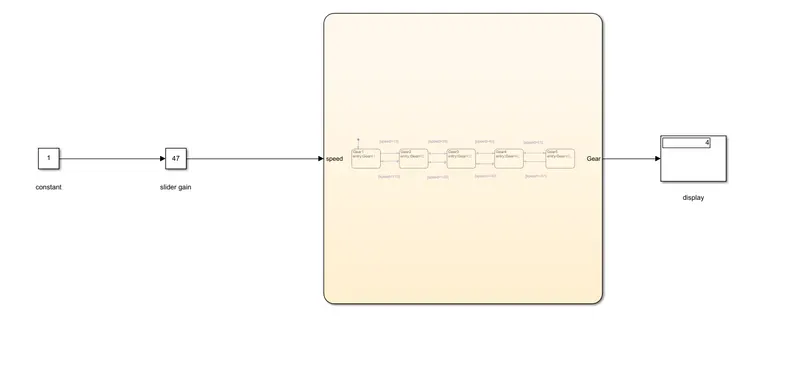
A constant block is connected to a SLIDER GAIN block which is then connected to the speed port.(input of the chart). The slider gain block needs constant scalar input hence the constant block. We can create min. and max.values as a limit to the slider gain. The slider block info is given below:
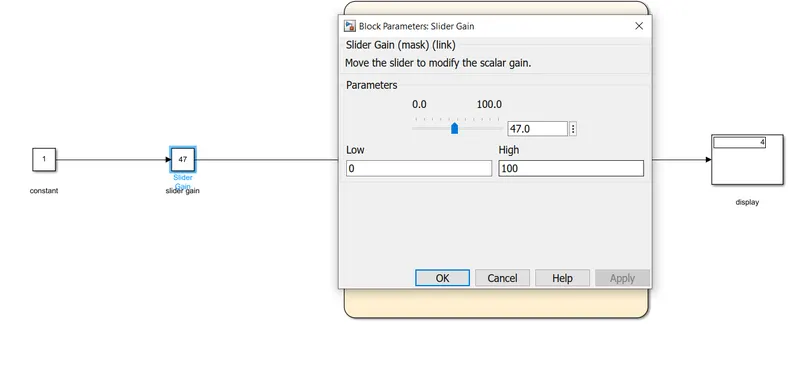
We can use the slider to fluctuate the input. Specify the constant value as 1. Now run the model for different values of slider and infinite values of stop time.
RESULT:
1. When slider input = 25.
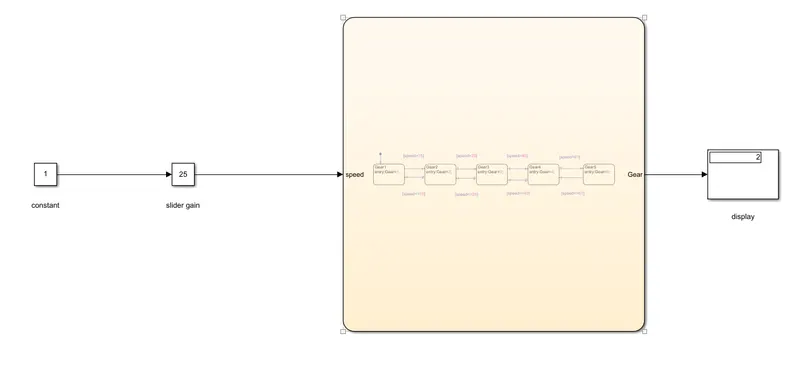
The gear display shows 2 which is correct.
2. When slider input = 65.
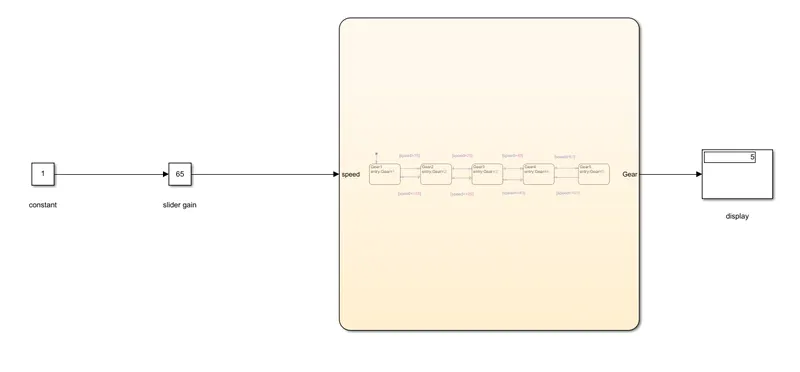
Gear display shows 5 which is correct.
Thus the control logic for washing machine and gear shift has been executed. The results are accurate.