Week 4.1 - Solving second order ODEs
AIM
To solves the ODE which represents the equation of motion of a simple pendulum
OBJECTIVE
In Engineering, ODE is used to describe the transient behavior of a system. A simple example is a pendulum
The way the pendulum moves depends on the Newtons second law. When this law is written down, we get a second order Ordinary Differential Equation that describes the position of the "ball" w.r.t time.
objective is to write a program that solves the following ODE. This ODE represents the equation of motion of a simple pendulum with damping
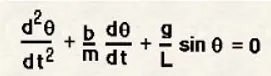
In the above equation,
g = gravity in m/s2,
L = length of the pendulum in m,
m = mass of the ball in kg,
b=damping coefficient.
EXPLAINATION
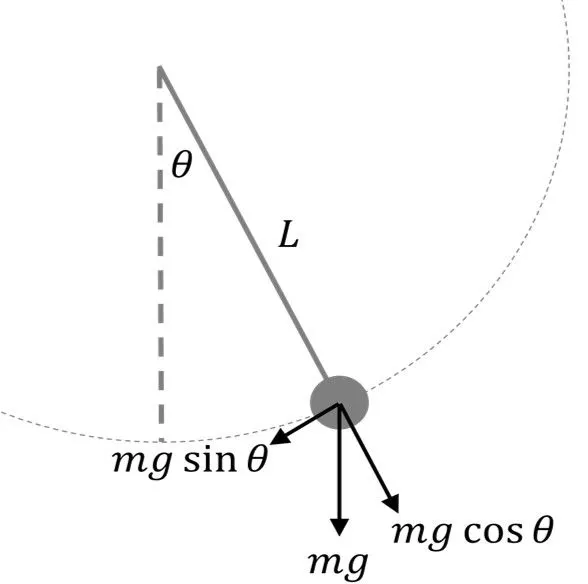
The simple pendulum is another mechanical system that moves in an oscillatory motion. It consists of a point mass ‘m’ suspended by means of light inextensible string of length L from a fixed support as shown in fig. The motion occurs in a vertical plane and is driven by a gravitational force. The forces which are acting on the mass are shown in the figure.
this image is used for reference taken from google.
the given function is in the second-order differential equation converting it into first order to solve the ode.
that is the second order ode is converted into two different first order ode
θ=θ1
dθ1/dt=θ2
dθ^2/dt^2=dθ2/dt
Input
L=1 metre,
m=1 kg,
b=0.05.
g=9.81 m/s2.
Time span= 0-20 sec
angular displacement=0
angular velocity=3 rad/sec at time t=0
code
clear all
close all
clc

%program to simulate the transient behaviour of a simple pendulum
%inputs
b = 0.05;
g = 9.81;
l = 1;
m = 0.1;

% initial condition
theta_0 = [0;3];

% time points
t_span = linspace(0,20,500);

% solve ODE
[t, results] = ode45(@(t,theta) ode_func(t,theta,b,g,l,m),t_span, theta_0);

% ploting
plot(t,results(:,1))
hold on
plot(t,results(:,2))
ylabel('Plot')
xlabel('Time')
code for the function program
function [dtheta_dt] = ode_func(t,theta,b,g,l,m)

         theta1 = theta(1);
         theta2 = theta(2);
         dtheta1_dt = theta2;
         dtheta2_dt = -(b/m)*theta2 - (g/l)*sin(theta1);
         dtheta_dt = [dtheta1_dt; dtheta2_dt];
code for iteration using for loop to create animation of simple pendulum
% Iteration using for loop to create animation of simple pendulum
ct=1;
theta_1 = results(:,1);

for i= 1:length(results(:,1))

    % initial value

    x_start= 0;
    y_start= 0;
    theta_2 = theta_1(i);

    % final value

    x_end = 1*sin(theta_2);
    y_end = -1*cos(theta_2);

    % ploting for animation

    figure(2)

    % base of pendulum

    plot([-1,1],[0,0], 'linewidth',4,'color','black')
    hold on

    % string of pendulum

    line([x_start x_end],[y_start y_end],'linewidth',6,'color','b')
    hold on

    % bob of pendulum

    plot(x_end,y_end,'marker','o','markersize', 28,'markerfacecolor','r')
    axis([-2 2 -2 2])
    pause(0.03)
    hold off
    M(ct)=getframe(gcf);
    ct=ct+1;
end

% creating movie from captured frames
 movie(M)
 videofile = VideoWriter('simple_pendulum.avi','uncompressed AVI');
 open(videofile);
 writeVideo(videofile,M);
 close(videofile);
EXPLAINATION
starting with clear close clc the code is started
the second order differential equation is converted to first order ode
b,g,l,m,time ,angular displacement, angular velocity are taken into consideration
the time span is taken as 0 to 20 with 500different variables
ode45 is an inbuilt function taken which leads to t and results
plot command is used to plot the variables which represent the displacement and velocity
next is the iteration using for loop to creat animation of simple pendulum
initial coordinates and final coordinates of the pendulum are taken as x-start y-start x-end y-end
with the value of theta using sine and cos function the values for x-end and y-end is calculated
next the base of the pendulum and string of the pendulum is plotted
using marker the pendulum bob is taken in consideration
at last vide file of the pendulum is generated as the output as shown below
output
represents the displacement and velocity
Angular Displacement and Angular Velocity plots were generated
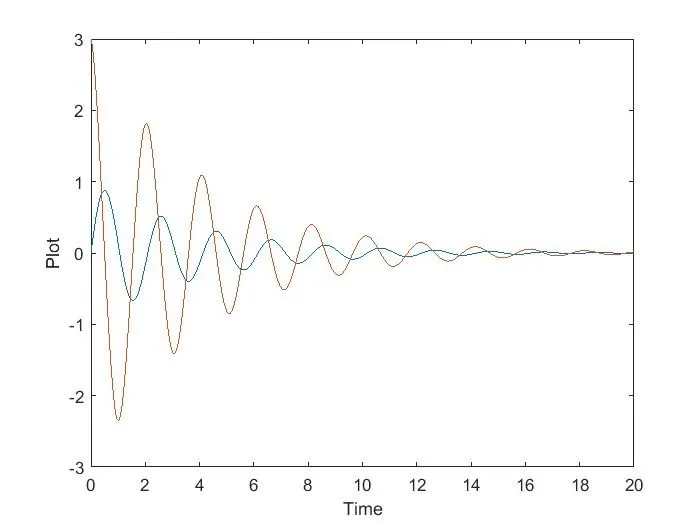
video file of the pendulum
file link-
https://www.youtube.com/watch?v=yrF1iaTlBoo
Result
The simulation of the transient behavior of a simple pendulum is successfully created by using a program in MATLAB.
i have attached the matlab file for further verification.