Week 4.1 - Genetic Algorithm
Aim:
- Write a code in MATLAB to optimise the stalagmite function and find the global maxima of the function.
- Clearly expalin the concept of genetic algorithm in your own words and also explain the syntax for ga in MATLAB in your report.
- Make sure that your code gives the same output, even if it is made to run several times.
- Plot graphs for all 3 studies and for F maximum vs no. of iterations. Title and axes labels are a must, legends could be shown if necessary.
Theory:
Introduction:
Genetic Algorithm (GA) is a search-based optimization technique based on the principles of Genetics and Natural Selection. It is frequently used to find optimal or near-optimal solutions to difficult problems which otherwise would take a lifetime to solve. It is frequently used to solve optimization problems, in research, and in machine learning.
Optimization:
Optimization is the process of making something better. In any process, we have a set of inputs and a set of outputs as shown in the following figure.
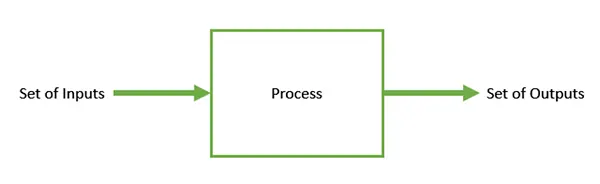
Optimization refers to finding the values of inputs in such a way that we get the “best” output values. The definition of “best” varies from problem to problem, but in mathematical terms, it refers to maximizing or minimizing one or more objective functions, by varying the input parameters.
The set of all possible solutions or values which the inputs can take make up the search space. In this search space, lies a point or a set of points which gives the optimal solution. The aim of optimization is to find that point or set of points in the search space.
What are Genetic Algorithms?
Nature has always been a great source of inspiration to all mankind. Genetic Algorithms (GAs) are search based algorithms based on the concepts of natural selection and genetics. GAs are a subset of a much larger branch of computation known as Evolutionary Computation.
GAs were developed by John Holland and his students and colleagues at the University of Michigan, most notably David E. Goldberg and has since been tried on various optimization problems with a high degree of success.
In GAs, we have a pool or a population of possible solutions to the given problem. These solutions then undergo recombination and mutation (like in natural genetics), producing new children, and the process is repeated over various generations. Each individual (or candidate solution) is assigned a fitness value (based on its objective function value) and the fitter individuals are given a higher chance to mate and yield more “fitter” individuals. This is in line with the Darwinian Theory of “Survival of the Fittest”.
In this way we keep “evolving” better individuals or solutions over generations, till we reach a stopping criterion.
Genetic Algorithms are sufficiently randomized in nature, but they perform much better than random local search (in which we just try various random solutions, keeping track of the best so far), as they exploit historical information as well.
Advantages of GAs
GAs have various advantages which have made them immensely popular. These include −
-
Does not require any derivative information (which may not be available for many real-world problems).
-
Is faster and more efficient as compared to the traditional methods.
-
Has very good parallel capabilities.
-
Optimizes both continuous and discrete functions and also multi-objective problems.
-
Provides a list of “good” solutions and not just a single solution.
-
Always gets an answer to the problem, which gets better over the time.
-
Useful when the search space is very large and there are a large number of parameters involved.
Limitations of GAs
Like any technique, GAs also suffer from a few limitations. These include −
-
GAs are not suited for all problems, especially problems which are simple and for which derivative information is available.
-
Fitness value is calculated repeatedly which might be computationally expensive for some problems.
-
Being stochastic, there are no guarantees on the optimality or the quality of the solution.
-
If not implemented properly, the GA may not converge to the optimal solution.
Phases in Genetic Algoritham-
- Initialization of Population (Coding)
The code generates its random population of defined size and from that population the code evaluates the fitness of the members of the population according to which it forms new population based on no. of iterations performed.
1.Fitness Function
It is that function which we have to optimize and its optimization is done with the help of number of generations which have been formed by the code accordance with the fitness value of each member generated, these fitness values are used for the reproduction of the children.
- Selection
The idea of the selection phase is to select the fittest individuals and let them pass their genes to the next generation. The main goal of this phase is to find the region where the chances of getting the best solution are more.
Inspiration for this is from the survival of the fittest.
It should be a balance between exploration and exploitation of search space.
GA tries to move the genotype to higher fitness in the search space.
Too strong fitness selection bias can lead to sub-optimal solutions.
Too little fitness bias selection results in unfocused search.
- Reproduction
Generation of offspring happen in 2 way:
Crossover
Mutation
1. A) Crossover
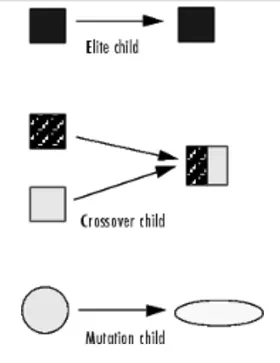
Crossover is the most significant stage in the genetic algorithm. During crossover, a random point is selected while mating a pair of parents to generate offspring.
There are 3 major types of crossover.
Single Point Crossover:
A point on both parents’ chromosomes is picked randomly, and designated a ‘crossover point’.
Two-Point Crossover: Two crossover points are picked randomly from the parent chromosomes.
Unifofm Crossover: In a uniform crossover, typically, each bit is chosen from either parent with equal probability.
- B) Mutation
In a few new offspring formed, some of their genes can be subjected to a mutation with a low random probability. This indicates that some of the bits in the bit chromosome can be flipped. Mutation happens to take care of diversity among the population and stop premature convergence.
Syntax
x = ga(fun,nvars,A,b,Aeq,beq,lb,ub)
x = ga(fun,nvars,A,b,Aeq,beq,lb,ub,nonlcon)
x = ga(fun,nvars,A,b,Aeq,beq,lb,ub,nonlcon,options)
x = ga(fun,nvars,A,b,[],[],lb,ub,nonlcon,IntCon)
x = ga(fun,nvars,A,b,[],[],lb,ub,nonlcon,IntCon,options)
[x,fval,exitflag,output] = ga(___)
[x,fval,exitflag,output,population,scores] = ga(___)
Description
x = ga(fun,nvars) finds a local unconstrained minimum, x, to the objective function, fun. nvars is the dimension (number of design variables) of fun.
x = ga(fun,nvars,A,b) finds a local minimum x to fun, subject to the linear inequalities A*x ≤ b. ga evaluates the matrix product A*x as if x is transposed (A*x').
x = ga(fun,nvars,A,b,Aeq,beq) finds a local minimum x to fun, subject to the linear equalities Aeq*x = beq and A*x ≤ b. (Set A=[] and b=[] if no linear inequalities exist.) ga evaluates the matrix product Aeq*x as if x is transposed (Aeq*x').
x = ga(fun,nvars,A,b,Aeq,beq,lb,ub) defines a set of lower and upper bounds on the design variables, x, so that a solution is found in the range lb ≤ x ≤ ub. (Set Aeq=[] and beq=[] if no linear equalities exist.)
x = ga(fun,nvars,A,b,Aeq,beq,lb,ub,nonlcon) subjects the minimization to the constraints defined in nonlcon. The function nonlcon accepts x and returns vectors C and Ceq, representing the nonlinear inequalities and equalities respectively. ga minimizes the fun such that C(x) ≤ 0 and Ceq(x) = 0. (Set lb=[] and ub=[] if no bounds exist.)
x = ga(fun,nvars,A,b,Aeq,beq,lb,ub,nonlcon,options) minimizes with the default optimization parameters replaced by values in options. (Set nonlcon=[] if no nonlinear constraints exist.) Create options using optimoptions.
x = ga(fun,nvars,A,b,[],[],lb,ub,nonlcon,IntCon) or x = ga(fun,nvars,A,b,[],[],lb,ub,nonlcon,IntCon,options) requires that the variables listed in IntCon take integer values.
x = ga(problem) finds the minimum for problem, a structure described in problem.
[x,fval] = ga(___), for any previous input arguments, also returns fval, the value of the fitness function at x.
[x,fval,exitflag,output] = ga(___) also returns exitflag, an integer identifying the reason the algorithm terminated, and output, a structure that contains output from each generation and other information about the performance of the algorithm.
[x,fval,exitflag,output,population,scores] = ga(___) also returns a matrix population, whose rows are the final population, and a vector scores, the scores of the final population.
BODY OF THE CONTANT:
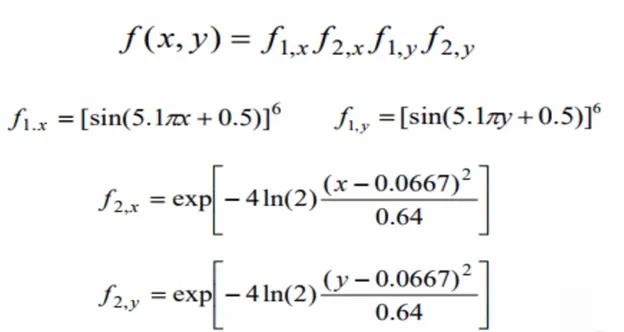
The above equations are used in the stalagmite function to plot the graph in the main functions.
Stalagmite function code:
function A= stalagmite (input_vector)

x = input_vector(1);

y = input_vector(2);

f1 = (sin(5.1*pi*x + 0.5)).^6;

f2 = (sin(5.1*pi*y + 0.5)).^6;

f3 = exp(-4*log(2)*(((x-0.0667).^2)/0.64));

f4 = exp(-4*log(2)*(((y-0.0667).^2)/0.64));

A = -(f1.*f2.*f3.*f4);

end
PROGRAM:
close all
clear all
clc

%input

x=linspace(0,0.6,150);
y=linspace(0,0.6,150);
num_spaces =50; % it is going to run genetic alogorhitum 50times

% Forming 2D array

[xx,yy] = meshgrid(x,y);

 for i= 1:length(xx)
     for j=1:length(yy)
         input_vector(1)= xx(i,j);
         input_vector(2)= yy(i,j);
         f(i,j)= stalagmite(input_vector);
     end
 end
 %Study 1- unbounded
 tic
 for i = 1:num_spaces
     [results,fopt(i)] = ga(@stalagmite,2)
     xopt(i)=results(1)
     yopt(i)=results(2)
 end
 study_time1=toc
 figure(1)
 subplot(2,1,1)
 surf(x,y,-f)
 shading interp
 hold on
 plot3(xopt,yopt,-fopt,'marker','o')
 % plot3 hepls to visualize how the algorithm is performing
 title('unbounded input')
 xlabel('x value')
 ylabel(' y value')
 subplot(2,1,2)
 plot(-fopt)
 xlabel('iteration')
 ylabel('function maximum')

 %study 2-bounded
 tic
 for i=1:num_spaces
     [results,fopt(i)]= ga(@stalagmite,2,[],[],[],[],[0;0],[0.6;0.6])
     xopt(i)=results(1)
     yopt(i)=results(2)
 end
 study_time2=toc
 figure(2)
 subplot(2,1,1)
 surf(x,y,-f)
 shading interp
 hold on
 plot3(xopt,yopt,-fopt,'marker','o')
  % plot3 hepls to visualize how the algorithm is performing
 title('bounded input')
 xlabel('x value')
 ylabel(' y value')
 subplot(2,1,2)
 plot(-fopt)
 xlabel('iteration')
 ylabel('function maximum')
 % study3- incresed initial population
 tic
      options = optimoptions('ga')
 options = optimoptions(options,'PopulationSize',250)
for i=1:num_spaces
     [results,fopt(i)]= ga(@stalagmite,2,[],[],[],[],[0;0],[0.6;0.6],[],[],options)
     xopt(i)=results(1)
     yopt(i)=results(2)

 end
 study_time3= toc
 figure(3)
 subplot(2,1,1)
 surf(x,y,-f)
 shading interp
 hold on
  plot3(xopt,yopt,-fopt,'marker','o')
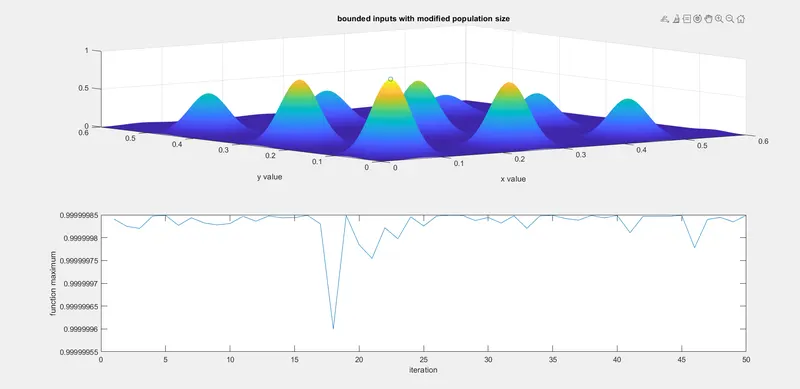
   title('bounded inputs with modified population size')
 xlabel('x value')
 ylabel(' y value')
 subplot(2,1,2)
 plot(-fopt)
 xlabel('iteration')
 ylabel('function maximum')
PROGRAM EXPLANATION:
- First we create Function code for the given equation
- In this stalagmite function we breakdown equation into 4 and we have given the terms
- in this challenge we have to find global maxima so usually ga iterates the minimum value so we have to use -ve to replicate the plot and give the maximum value.
- Giving the input by using linspace command
- Initialising the values of x and y taking 150 values inbetween 0 and 0.6
- Considering number of iteration num_spaces =50
- Forming the 2d array by using meshgrid command
- Next we have evaluated the stalagmite function using for loop command
- Starting to evaluate the 3Studies.
1st Study:
- To calculate the time we have used tic toc commands
- Using for loop we are iterating to 50
- Using ga function to calculate the maxima of the function
- we store the outputs into results which contains maximas and fopt which contains the value of maxima ovbtained
- Plotting the surface of x,y,-f to get the 3d plot
- use plot3 command to make a plot of xopt,yopt and -fopt to plot the optimum maximas.
- Let us plot the fopt function so that we can visuvalise the optimum values at each iteration.
- To get the time taken to complete the cycle we used tic toc command.
- we excute the program we will get the output and time.
Output of study 1:
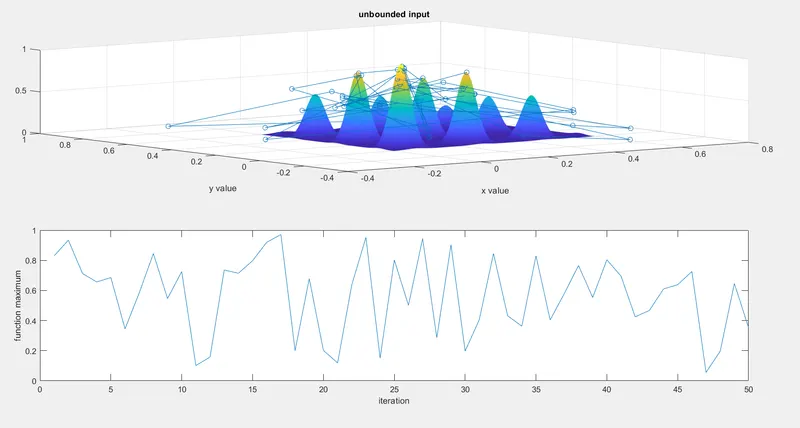
Here we can see the optimum values went outside values of x and y resulting falling away from stalagmite surface.
so we failed to get the global maxima in this case.
Study_time1 = 3.14s
2nd Study:
- To calculate the time we have used tic toc commands
- Specify the lower and upper bounds of x and y
- Using ga function to calculate the maxima of the function
- we store the outputs into results which contains maximas and fopt which contains the value of maxima ovbtained
- Plotting the surface of x,y,-f to get the 3d plot
- use plot3 command to make a plot of xopt,yopt and -fopt to plot the optimum maximas.
- Let us plot the fopt function so that we can visuvalise the optimum values at each iteration.
- To get the time taken to complete the cycle we used tic toc command.
- we excute the program we will get the output and time.
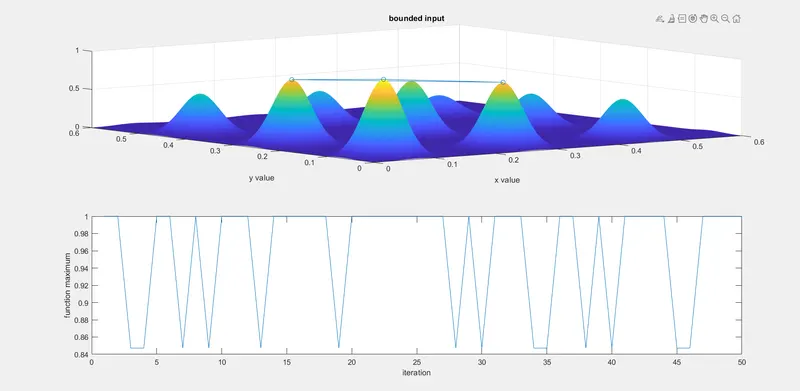
Output of study 2:
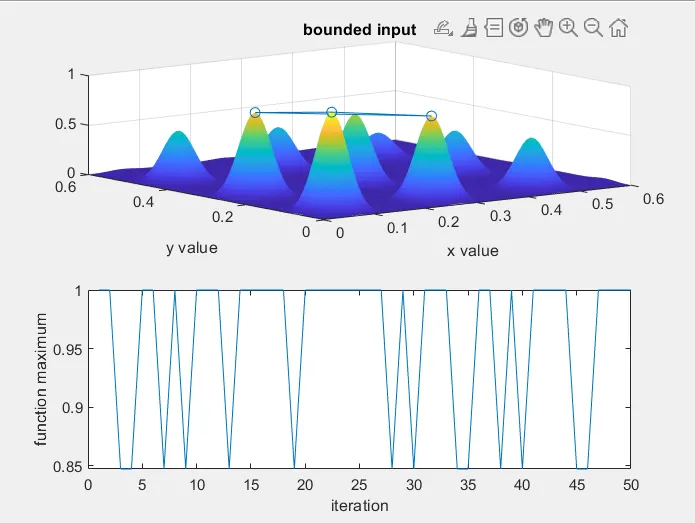
Through the optimum values are within limits of x and y values but it could not given the exact global maxima.
The study_time2 = 3.3466
3rd Study:
- Increase the initial population which default 50 to 250 by using optimoptions command
- To calculate the time we have used tic toc commands
- Specify the lower and upper bounds of x and y
- Using ga function to calculate the maxima of the function
- we store the outputs into results which contains maximas and fopt which contains the value of maxima ovbtained
- Plotting the surface of x,y,-f to get the 3d plot
- use plot3 command to make a plot of xopt,yopt and -fopt to plot the optimum maximas.
- Let us plot the fopt function so that we can visuvalise the optimum values at each iteration.
- To get the time taken to complete the cycle we used tic toc command.
- we excute the program we will get the output and time.
Output of study 3:
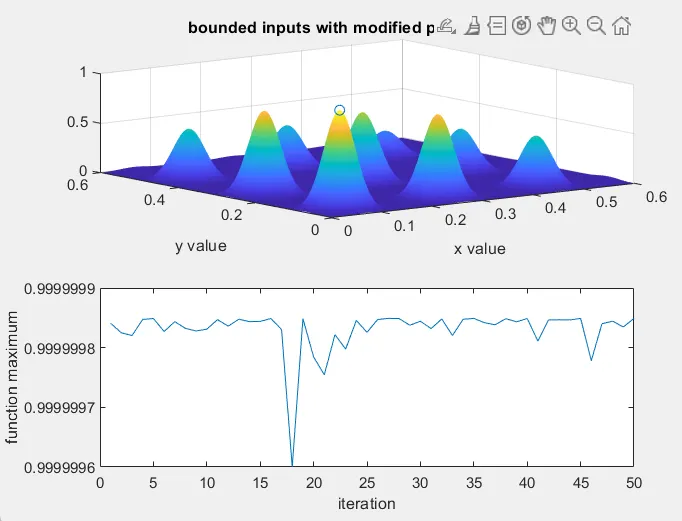
Through the time of exection is more in this case we are sucessful to find out the correct maxima for the stalagmite function.
Study_time3 = 11.5840
OUTPUT:
1st Study
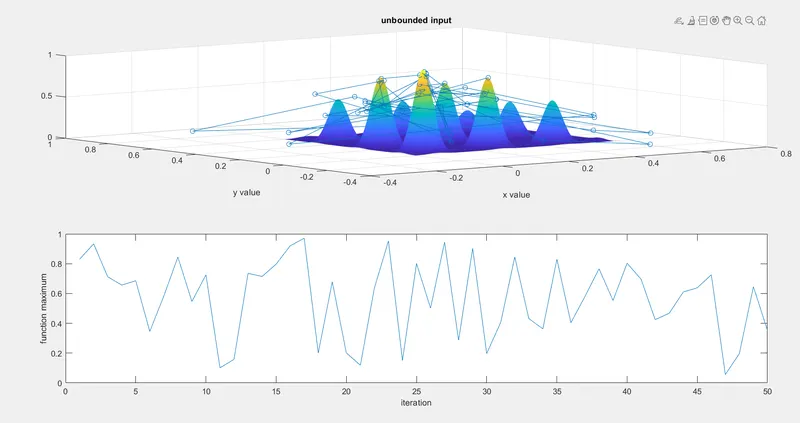
2nd Study
3rd Study