Week 4.1 - Genetic Algorithm
TO OPTIMIZE STALAGMITE FUNCTION AND FIND GLOBAL MAXIMA
Given problem:
- Write a code in MATLAB to optimise the stalagmite function and find the global maxima of the function.
SOLUTION:
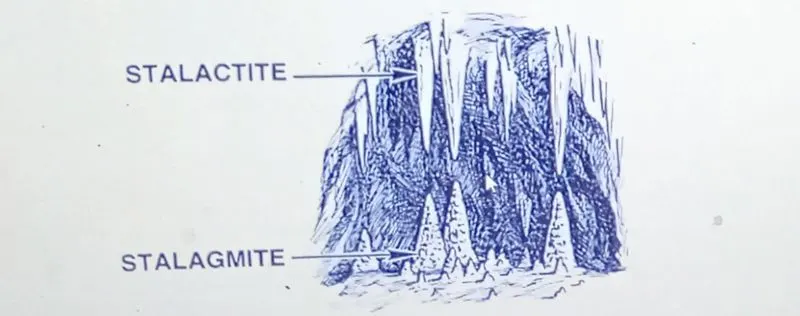
stalactites are stuctures formed from mineral deposits that hangs tightly from celling of the cave.
Stalagmites are same but they pont upward from the lower of the caves.
Introduction to genetic algorithm:
GENETIC ALGORITHM is an optimization method used to solve non linear optimization problem.It uses the concept of evolutionary biology(Darwins theory of evoulition) to find global minima for optimization problem.An initial state of generation is tested through objective function and subsequent generation evolve through following process.
GENETIC ALGORIYHM IS DONE IN 3 STEPS:
Selection: a number of individual is selected from the population in the mating pool.
Based on previously calculated fitness value , the best individual is selected.After that we will end up with asubset of mating pool.
Crossover: crossover in ga generates new generation same as natural mutation.
By mutating old generations parents the new generation comes by carrying genes from both the parents.The amount of gene carrying from each parent is random.
Mutation: foreach offspring select some genes and change its value.Mutation prevents the solution from felling in local minima.
Syntax of ga in matlab:
x=ga(fun,nvars)
x=ga(fun,nvars,A,b)
x=ga(fun,nvars,A,b,Aeq,beq)
x=ga(fun,nvars,A,b,Aeq,beq,lb,ub)
x=ga(fun,nvars,A,b,Aeq,beq,lb,ub,nonlcon)
x=ga(fun,nvars,A,b,Aeq,beq,lb,ub,nonlcon,intcon)
x=ga(fun,nvars,A,b,Aeq,beq,lb,ub,nonlcon,options)
x=ga(fun,nvars,A,b,Aeq,beq,lb,ub,nonlcon,intcon,options)
fun-function name
nvars-number of variables
A-linear inequality constrains as real matrix
b- linear inequility constrains as real vectror
Aeq-linear equality constrains as real matrix
beq-linear equality constrains as real vector
lb-lower boundary
ub-upper boundary
nonlcon-non linear constrains
options- creating optimism option using 'optimoptions'
FUNCTION CODE:
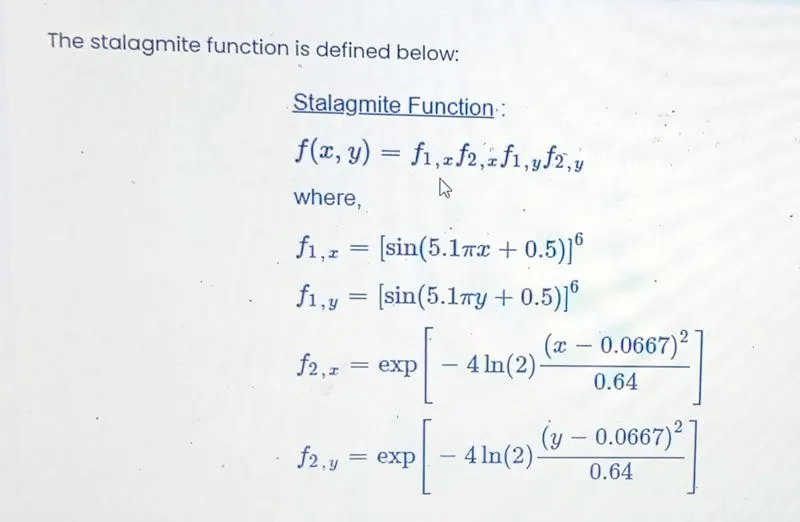
function [f]=stalagmite_fun(input_vector)
f1x=(sin((5.1*pi).*input_vector(1)+0.5)).^6;
f1y=(sin((5.1*pi).*input_vector(2)+0.5)).^6;
f2x=exp((((input_vector(1)-.667).^2)/.64).*(-4*log(2)));
f2y=exp((((input_vector(2)-.667).^2)/.64).*(-4*log(2)));
f1=f1x*f1y*f2x*f2y;
f=-f1;
end
PROGRAM CODE
clear all
close all
clc

x=linspace(0,0.6,150);
y=linspace(0,0.6,150);
limit=30;
[xx yy]=meshgrid(x,y);
for i=1:length(xx)
    for j=1:length(yy)
    input_vector(1)=xx(i,j);
    input_vector(2)=yy(i,j);
    f(i,j)=stalagmite_fun(input_vector);
end
end
tic
for i=1:limit
    [input,fval(i)]=ga(@stalagmite_fun,2);
    x_out(i)=input(1);
    y_out(i)=input(2);
end
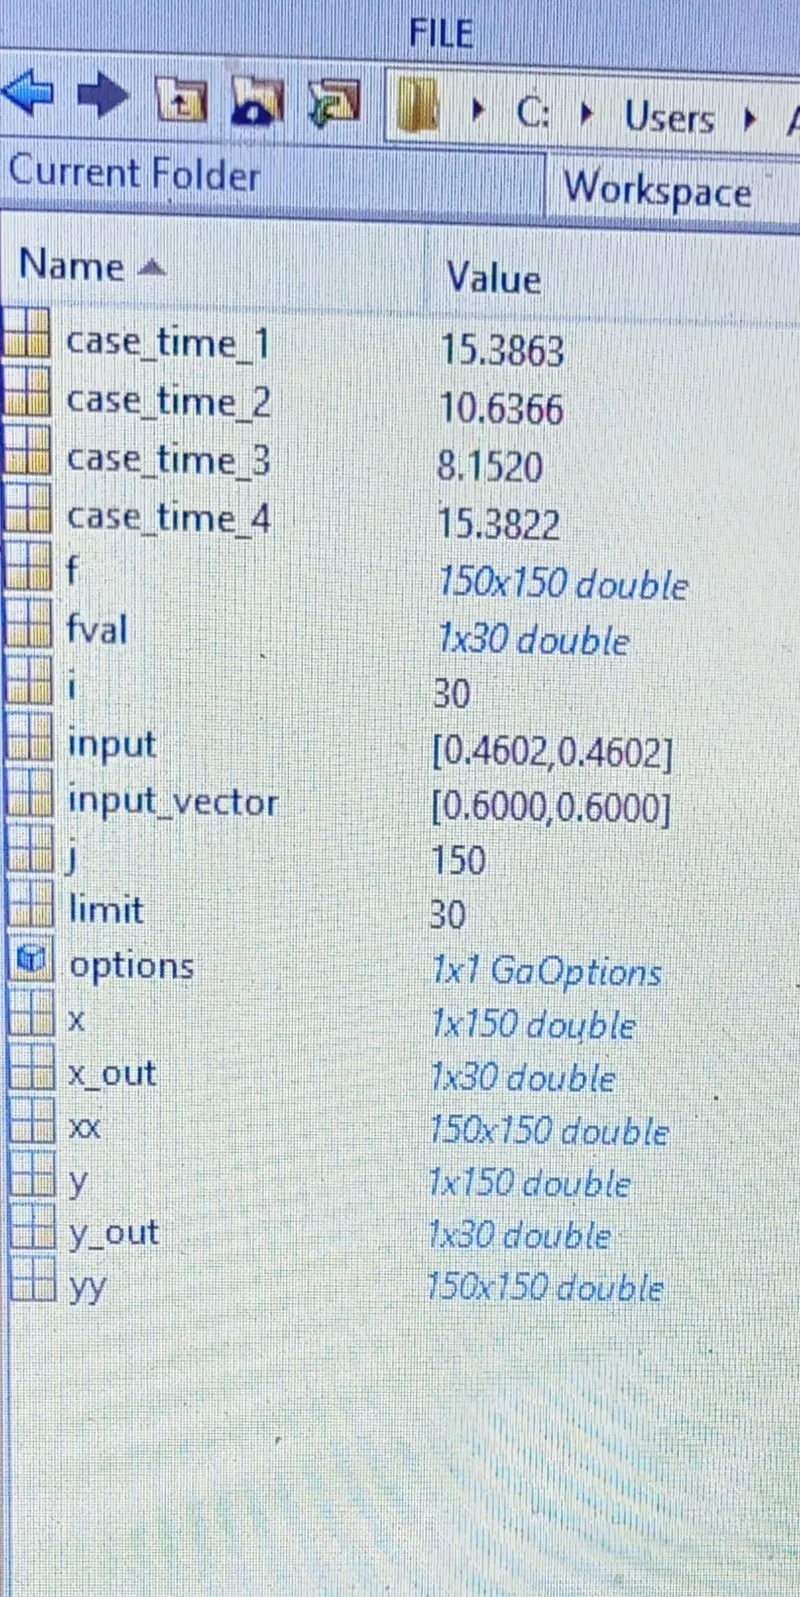
case_time_1=toc;

figure(1)
subplot(2,1,1)
surfc(xx,yy,-f)
xlabel('x')
ylabel('y')
title('case1(unbounded)','color','k')
shading interp
hold on
plot3(x_out,y_out,-fval,'marker','o','MarkerSize',6,'MarkerFaceColor','g')
subplot(2,1,2)
plot(-fval);
xlabel('no of itirations')
ylabel('max function value')
%case 2
tic
for i=1:limit
    [input,fval(i)]=ga(@stalagmite_fun,2,[],[],[],[],[0;0],[0.6;0.6]);
     x_out(i)=input(1);
    y_out(i)=input(2);
end
case_time_2=toc
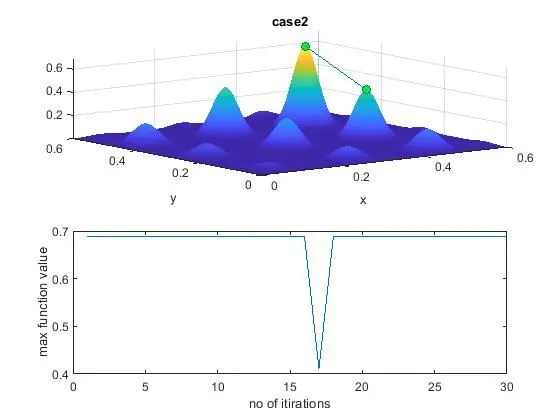
figure(2);
subplot(2,1,1)
surfc(xx,yy,-f)
xlabel('x')
ylabel('y')
title('case2','color','k')
shading interp
hold on
plot3(x_out,y_out,-fval,'marker','o','MarkerSize',6,'MarkerFaceColor','g')
subplot(2,1,2)
plot(-fval);
xlabel('no of itirations')
ylabel('max function value')
%case3
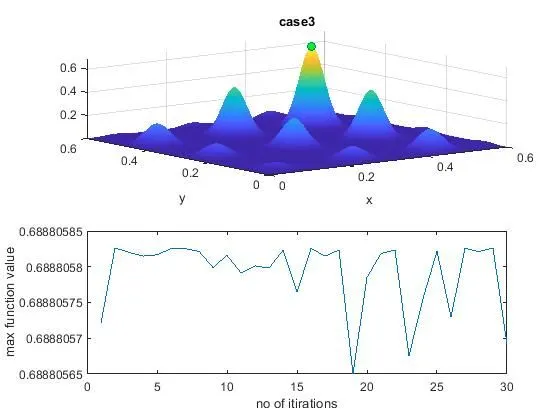
options=optimoptions('ga');
options=optimoptions(options,'PopulationSize',100)
tic
for i=1:limit
    [input,fval(i)]=ga(@stalagmite_fun,2,[],[],[],[],[0;0],[0.6;0.6],[],[],options);
     x_out(i)=input(1);
    y_out(i)=input(2);
end
case_time_3=toc
figure(3);
subplot(2,1,1)
surfc(xx,yy,-f)
xlabel('x')
ylabel('y')
title('case3','color','k')
shading interp
hold on
plot3(x_out,y_out,-fval,'marker','o','MarkerSize',6,'MarkerFaceColor','g')
subplot(2,1,2)
plot(-fval);
xlabel('no of itirations')
ylabel('max function value')
%case4
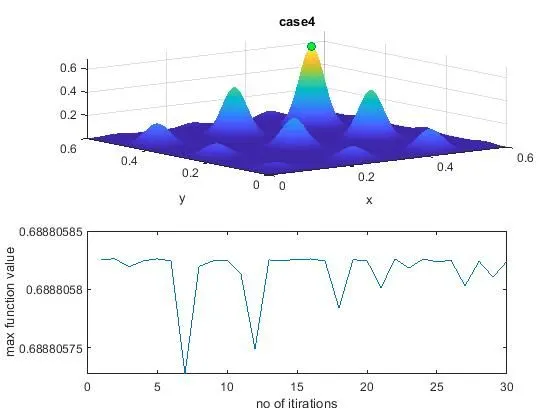
options=optimoptions('ga');
options=optimoptions(options,'PopulationSize',300)
tic
for i=1:limit
    [input,fval(i)]=ga(@stalagmite_fun,2,[],[],[],[],[0;0],[0.6;0.6],[],[],options);
     x_out(i)=input(1);
    y_out(i)=input(2);
end
case_time_4=toc
figure(4);
subplot(2,1,1)
surfc(xx,yy,-f)
xlabel('x')
ylabel('y')
title('case4','color','k')
shading interp
hold on
plot3(x_out,y_out,-fval,'marker','o','MarkerSize',6,'MarkerFaceColor','g')
subplot(2,1,2)
plot(-fval);
xlabel('no of itirations')
ylabel('max function value')
%displaying the values of x & y for maximum value of function
display(input)
%end of the program
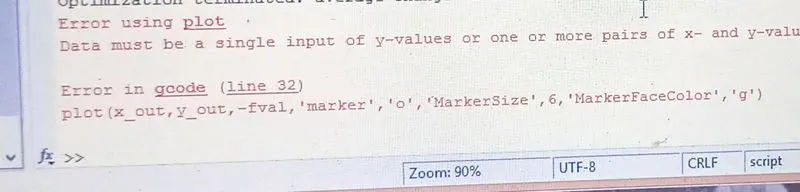
ERROR
Instead of plot3(for 3d surface) plot comand was used in first case
The running time of program was observed so long . The running time was observed by tic-toc command.
RESULTS:
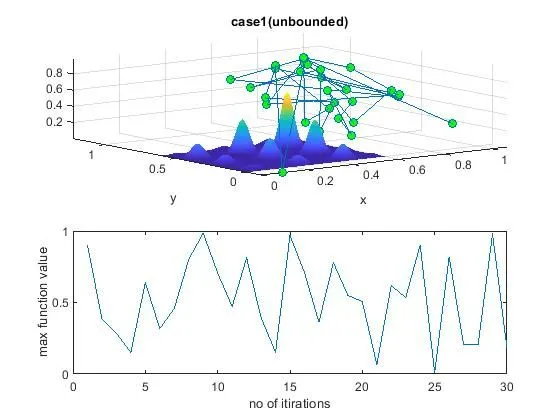
Case1(unbounded)
Case2(bounded):
Case3(bounded with increased population):
Case4(bounded with more increased population):
Values of x & y for maximum value of the function:
input = 0.4602 0.4602
References: