Project 1 - Parsing NASA thermodynamic data
PARSING NASA THERMODYNAMIC DATA :
GIVEN PROBLEM:
Write a function that extracts the 14 co-efficients and calculates the enthalpy, entropy and specific heats for all the species in the data file. You will be reading this file NASA thermodynamic data(Tip: use fopen and fgetl). The formulae are shown below.
Here R is the universal gas constant, T is the temeprature
The FIRST 7 coefficients are HIGH-temperature coefficients and the SECOND 7 coefficients are LOW-temperature coefficients.
Also use the LOCAL TEMPERATURE RANGES which is unique for each individual species, not the GLOBAL TEMPERATURE RANGE.
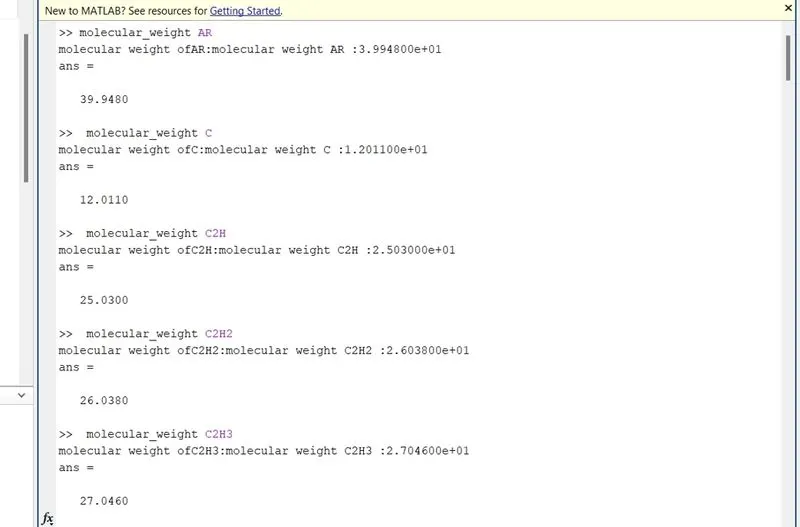
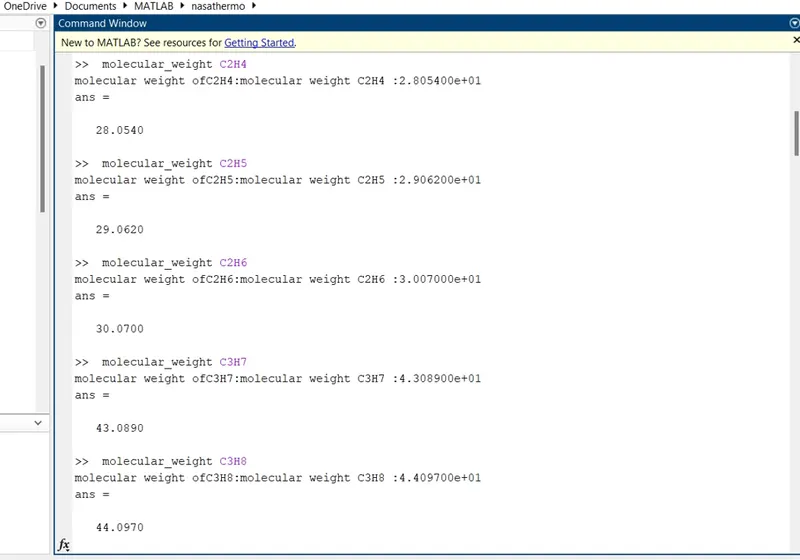
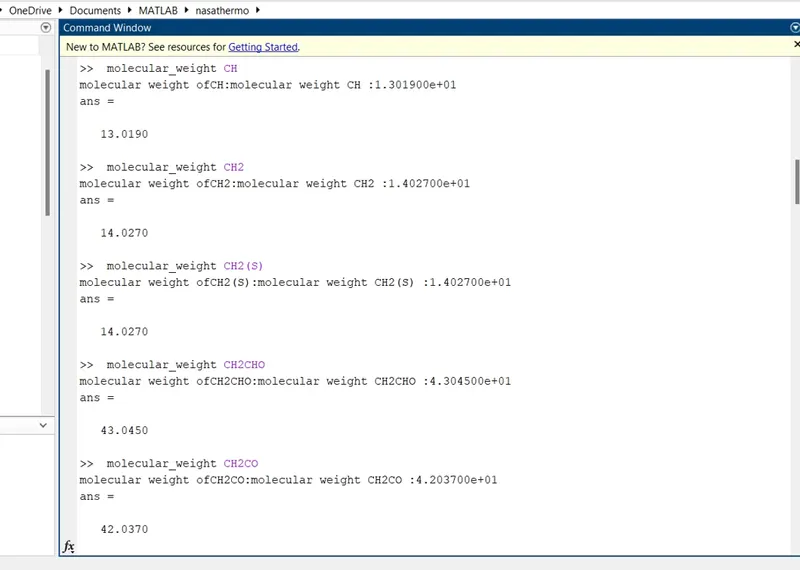
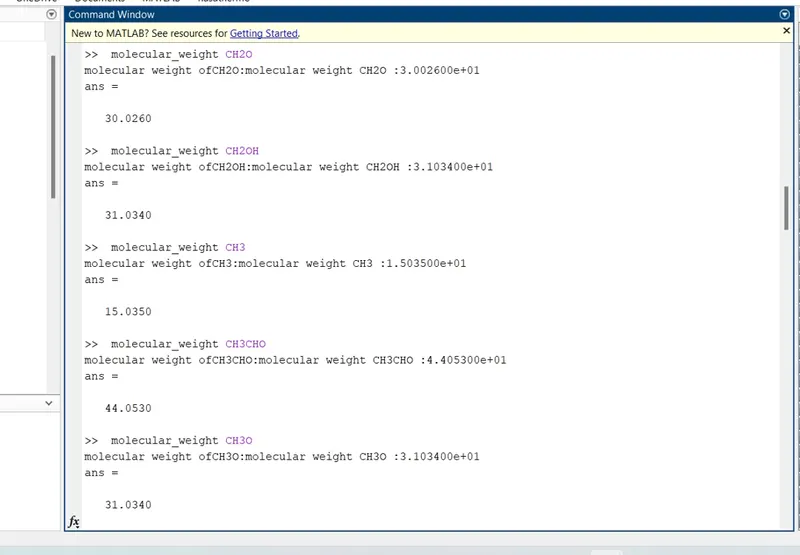
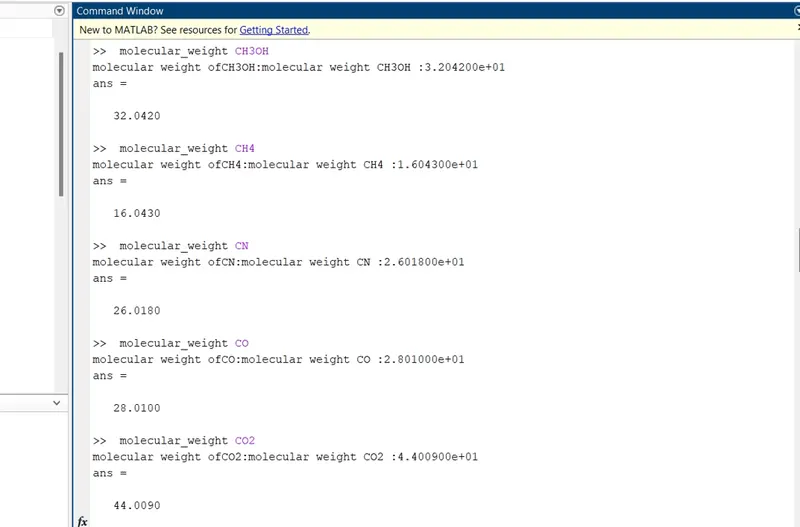
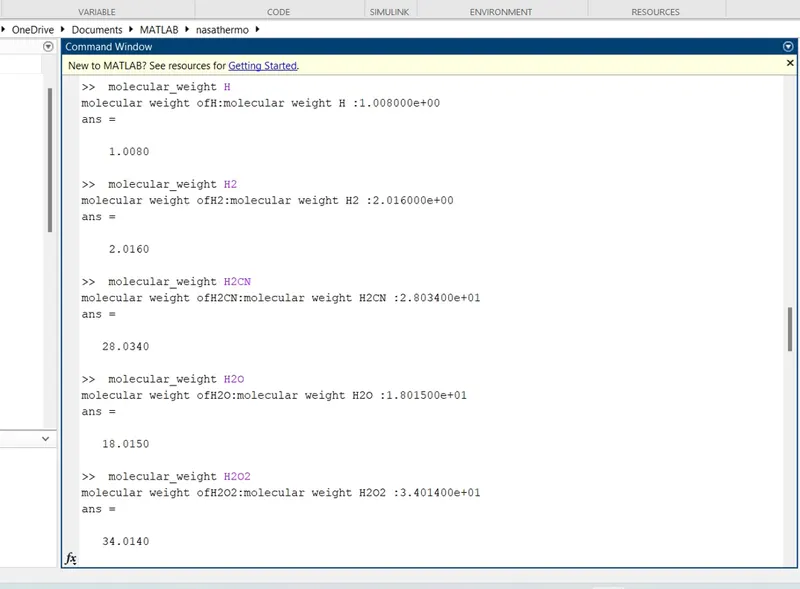
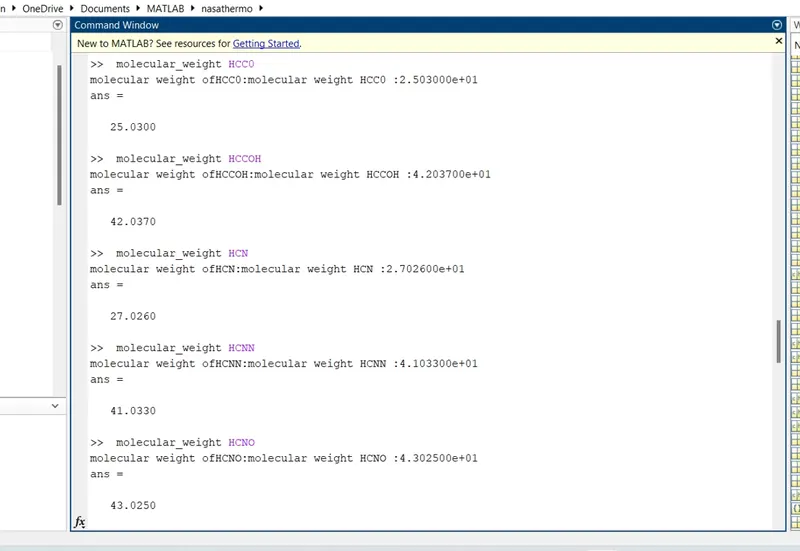
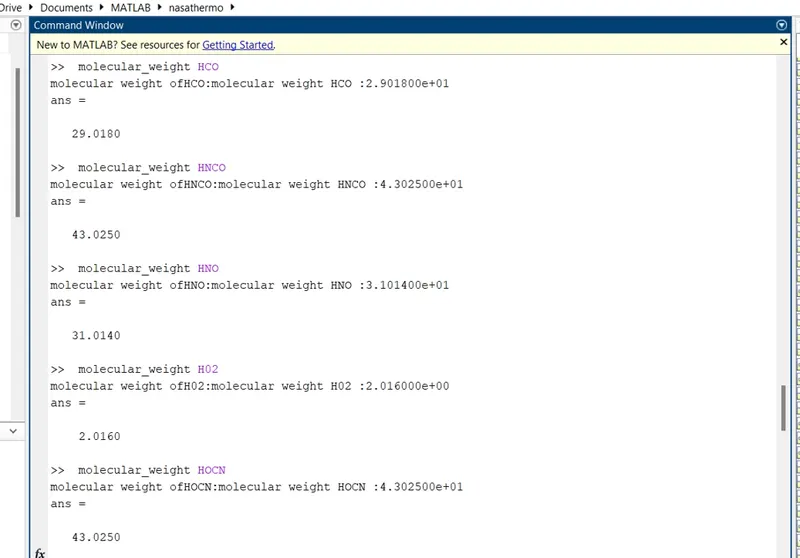
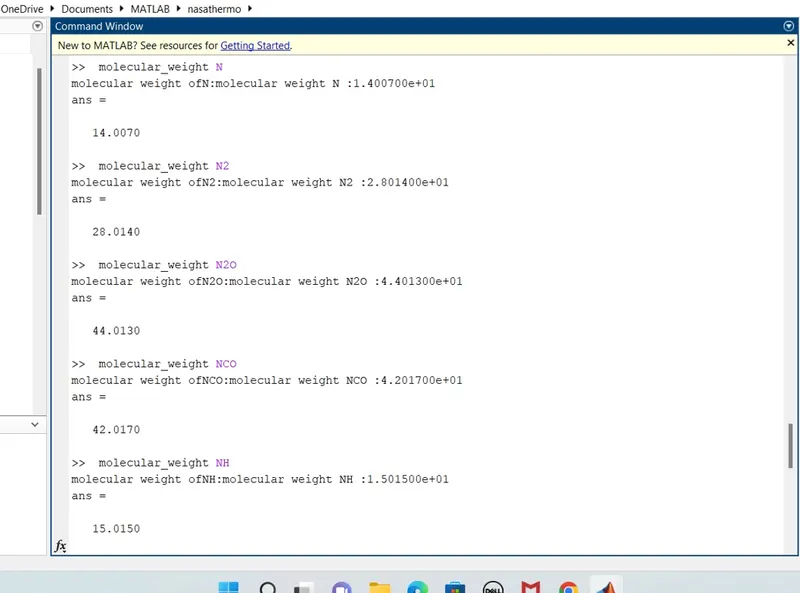
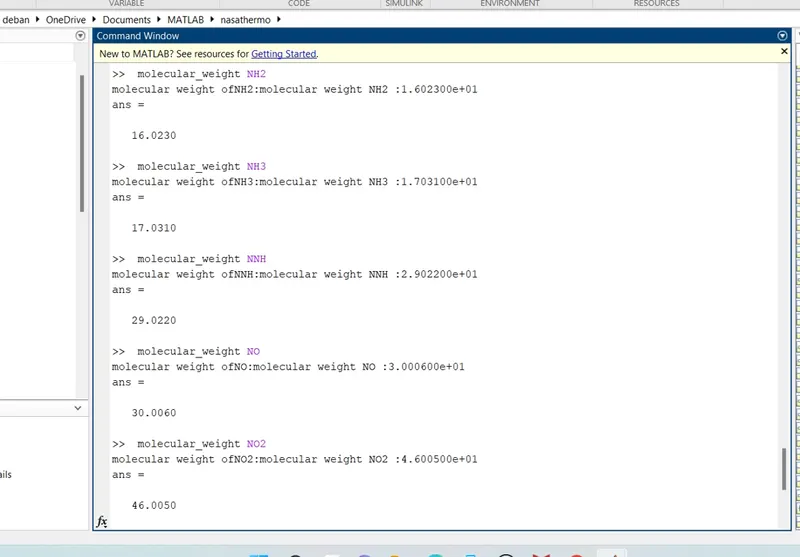
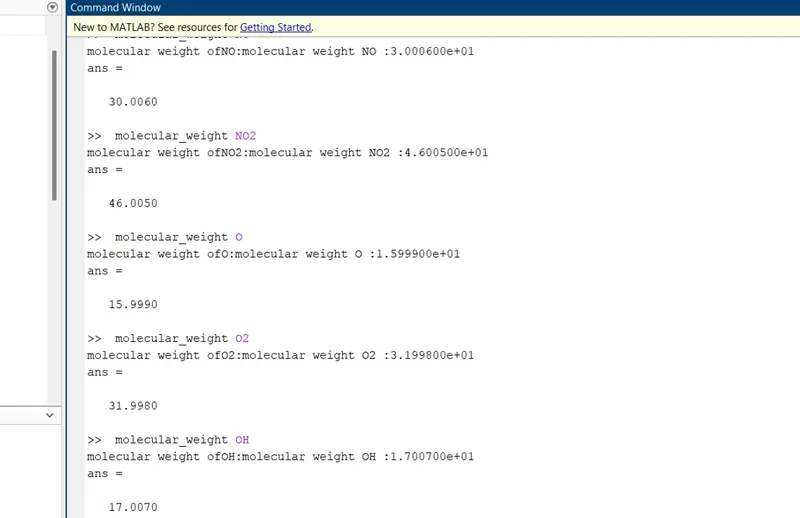
2. Calculate the molecular weight of each species and display it in the command window.
3. Plot the Cp, Enthalpy and Entropy for the local temperature range (low temperature : high temperature) specific for each species.
4. Save the plots as images with appropriate names and dump them in separate folders for each species with suitable name. All these should be generated automatically.
5. The main program that you will submit will just take the "THERMO.dat" file as an input and generate Cp, H and S plots.
6. Please write a detailed report to describe your logic.
FILE PARSING:
File parsing refers to how information can be read from a particular text file or a file and how that information can be used in a computer program .
step1- Define the function , step2-create an input perser object , step3-Add inputs to the scheme , step4-Set proparties to adjust persing , step5-Perse the inputs , step6-Use the inputs in function , step7-calling function.
NASA THERMODYNAMIC FILE:
NASA came up with polynomials that can be used to evaluate thermodynamic properties such as Cp, H and S. They have also documented the co-efficients that are required to evaluate these polynomials for 1000+ species.THERMO.DAT file is a file containing 53 elements and 14 coefficients given by NASA , these coefficients can be used for calculating Enthaply, Entopy & specific heat of each item.
LIST OF 53 ELEMENTS IN THERMO.DAT FILE:
AR C C2H C2H2 C2H3 C2H4
C2H5 C2H6 C3H7 C3H8 CH CH2
CH2(S) CH2CHO CH2CO CH2O CH2OH CH3
CH3CHO CH3O CH3OH CH4 CN CO
CO2 H H2 H2CH H2O H2O2
HCCO CCOH HCN HCNN HCNO HCO
HNCO HNO HO2 HOCN N N2
N2O NCO NH NH2 NH3 NNH
NO N02 O O2 OH
ENTHALPY, ENTOPY, SPECIFIC HEAT :
Enthalpy, entropy and specific heat are properties of a thermodynamic system that describe a thermodynamic process.For example these properties are used in internal combustion engine, refrigeration ,air conditioning , nozzle flow and for all such processes where heat and energy is involved.
NASA came up with polynomials that can be used to evaluate thermodynamic properties such as specific heat(Cp), enthalpy(H) and Entropy(S).
NASA polynomials form:
Here R is the universal gas constant, T is the temeprature
The FIRST 7 coefficients are HIGH-temperature coefficients and the SECOND 7 coefficients are LOW-temperature coefficients.
FUNCTION CODE:
1.SPECIFIC HEAT: Amount of energy that can be added to one unit mass of a substance to increase one unit temperature.
%specific heat calculating function
function CP=specific_heat(a1,a2,a3,a4,a5,a8,a9,a10,a11,a12,temp,R,global_mid_temp)
%comparing with global temperature
if temp<=global_mid_temp
    CP=R*(a8+(a9*temp)+(a10*(temp).^2)+(a11*(temp).^3)+(a12*(temp).^4));
else
    CP=R*(a1+(a2*temp)+(a3*(temp).^2)+(a4*(temp).^3)+(a5*(temp).^4));
end
2.ENTHALPY: Enthalpy is a property that is the sum of systems internal energy and flow work.
%enthalpy calculation function
function H=enthalpy(a1,a2,a3,a4,a5,a6,a8,a9,a10,a11,a12,a13,temp,R,global_mid_temp)
%comparing with global temperature
if temp<=global_mid_temp
    H=R*temp.*(a8+((a9*temp)/2)+((a10*(temp).^2)/3)+((a11*(temp).^3)/4)+((a12*(temp).^4)/5)+((a13./temp)));
else
    H=R*temp.*(a1+((a2*temp)/2)+((a3*(temp).^2)/3)+((a4*(temp).^3)/4)+((a5*(temp).^4)/5)+((a6./temp)));
end
3.ENTROPY: Entropy is a measure of irreversivility or amount of unavalible work in a system.
%entrppy calculating function
function S=entropy(a1,a2,a3,a4,a5,a7,a8,a9,a10,a11,a12,a14,temp,R,global_mid_temp)
%comparing with global temperature
if temp<=global_mid_temp
    S=R.*(a8.*log(temp)+(a9.*temp)+(a10*((temp).^2)/2)+(a11*((temp).^3)/3)+(a12*((temp).^4)/4)+a14);
else
    S=R.*(a1.*log(temp)+(a2.*temp)+(a3*((temp).^2)/2)+(a4*((temp).^3)/3)+(a5*((temp).^4)/4)+a7);
end
4.MOLECULAR WEIGHT: Molecular weight is weight of different elements molecule. sometime same elements
molecular weight differ due to isotopes.
function molecularweight=molecular_weight(species_sp)
%standard atomic name
atomic_name=['H','C','O','N','A'];
%hydrogen,carbon,oxygen,nitrogen,argon
fprintf('molecular weight of');
fprintf(species_sp);
fprintf(':');
%standard atomic number
atomic_weight=[1.008 12.011 15.999 14.007 39.948];
%starting range of molecule
molecularweight=0;
%adding atomic number to obtain particular value
for i=1:length(species_sp)
    for j=1:length(atomic_name)
        if strcmpi(species_sp(i),atomic_name(j))
            molecularweight=molecularweight+atomic_weight(j);
            position =j;
        end
    end
    n=str2num(species_sp(i));
    if n>1
        molecularweight=molecularweight+atomic_weight(position)*(n-1);
    end
end
fprintf('molecular weight %s :',species_sp);
fprintf('%d',molecularweight);
disp('');
end
MAIN CODE:
clear all
close all
clc
mkdir('c:/Users/deban/OneDrive/Documents/MATLAB/nasathermo')
f1=fopen('thermo.dat','r');
gt=fgetl(f1);
global_temp=fgetl(f1);
t=strsplit(global_temp);
global_low_temp=str2num(t{2});
global_mid_temp=str2num(t{3});
global_high_temp=str2num(t{4});
temp=linspace(global_low_temp,global_high_temp,1000);
R=8.314;
for i=1:3
    gt=fgetl(f1);
end
for i=1:53
    gt=fgetl(f1);
    A=strsplit(gt,' ');
    species_sp=(A{1});

line_1=fgetl(f1);
a=strfind(line_1,'E');

%Extracting higher and lower temperature coefficients
%Extracting first 7 coefficients-Higher temperature coefficients

a1=line_1(1:a(1)+3);
a1=str2num(a1) ; %1
a2=line_1(a(1)+4:a(2)+3);
 a2=str2num(a2);  %2
 a3=line_1(a(2)+4:a(3)+3);
a3=str2num(a3);  %3
a4=line_1(a(3)+4:a(4)+3);
a4=str2num(a4);  %4
a5=line_1(a(4)+4:a(5)+3);
a5=str2num(a5); %5

line_2=fgetl(f1);
b=strfind(line_2,'E');
a6=line_2(1:b(1)+3);
a6=str2num(a6) %6
a7=line_2(b(1)+4:b(2)+3);
a7=str2num(a7)  %7

%Extrcting last 7 coefficients-lower temperature coefficients
a8=line_2(b(2)+4:b(3)+3);
a8=str2num(a8);  %8
a9=line_2(b(3)+4:b(4)+3);
a9=str2num(a9);  %9
a10=line_2(b(4)+4:b(5)+3);
a10=str2num(a10);  %10


line_3=fgetl(f1);
c=strfind(line_3,'E');
a11=line_3(1:c(1)+3);  %11
a11=str2num(a11);
a12=line_3(c(1)+4:c(2)+3);
a12=str2num(a12);  %12
a13=line_3(c(2)+4:c(3)+3);
a13=str2num(a13);  %13
a14=line_3(c(3)+4:c(4)+3);
a14=str2num(a14);  %14

%specific heat calculation
CP=specific_heat(a1,a2,a3,a4,a5,a8,a9,a10,a11,a12,temp,R,global_mid_temp);

%enthalpy calculation
H=enthalpy(a1,a2,a3,a4,a5,a6,a8,a9,a10,a11,a12,a13,temp,R,global_mid_temp);

%entropy calculation
S=entropy(a1,a2,a3,a4,a5,a7,a8,a9,a10,a11,a12,a14,temp,R,global_mid_temp);

%molecular weight calculation
molecularweight(i)=molecular_weight(species_sp);
m_w=fopen("molecular_weight.txt","a+");
fprintf(m_w,'molecularweight of %s is %d ',species_sp,molecularweight);
fprintf(m_w,'\n');
fclose(m_w);

%ploting (cp,h,s,species_sp)
%save as a folder
cur_dir=pwd;
mkdir(species_sp)
cd(species_sp)

%plot1 specific heat(cp) vs temperature renge(temp)
figure(1)
plot(temp,CP,'LineWidth',2,'Color','r')
xlabel('Temperature[k]');
ylabel('specific heat[kj/kg-k]')
saveas(figure(1),'specificheat.jpg')
title(sprintf('specific heat vs temperature range of %s',species_sp))

%plot2 enthalpy(h) vs temperature range(temp)
figure(2)
plot(temp,H,'LineWidth',2,'Color','g')
xlabel('Temperature[k]')
ylabel('enthalpy[kj/kg]')
saveas(figure(2),'enthalpy.jpg')
title(sprintf('enthalpy vs temperature range of %s',species_sp))

%plot3 entopy(s) vs temperature range(temp)
figure(3)
plot(temp,S,'LineWidth',2,'Color','b')
xlabel('Temperature[k]')
ylabel('entopy[kj/k]')
saveas(figure(3),'entopy.jpg')
title(sprintf('entropy vs temperature range of %s',species_sp));
cd('c:/Users/deban/OneDrive/Documents/MATLAB/nasathermo');

end
CODE EXPLANATION:
1.'clear all'-clear all variable in the workspace.
'close all'-close all the plots & figures
'clc'-clears the command window
2.making a directory using mkdir with location adress.
3. opening the 'Thermo.dat' file by fopen and reading it by 'r'
4.use fgetl for reading the text file line by line
5.use strsplit to split the temperature into a particualr string cell
6.use str2num for converting string cell to number
7. Divide the temperature to a string and then convert to a number so that temperature values can be used separatly to solve nasa thermodynamics.
8.Use for&end loop to skip three lines in the text file.
9.Reading all 53 species to plot specific heat , enthalpy , entropy with temperature values can be used separatly to solve nasa thermodynamics.
10.USE for loop to read 53 species.
11.use strfind to find string
12.using linspace specify the temperature range from low to high
13.Adding universal gas constant value R
14.Extracting higher and lower temperature coefficients by reading line by line from the species
15. calling specific heat , enthalpy, entopy function codes
16 . calculating molecular weight.
SYNTAX USED DURING CODING :
fopen: open a file
r: open the file for reading
fgetl: read line by line
strsplit: split string or character vector to aspecified delimiter
str2num: convert character array or string into numeric array
strfind : find one string into another
linspace : generate linearly spaced vectors
fprintf:write formatted data to file
pwd: identify current directory
mkdir: make new directory
cd: change working directory
OUTPUT:
SCREENSHORT OF THE WINDOW WHERE ALL FOLDERS ARE SAVED:

Molecular weight of all species:
Specific heat ,Enthalpy ,Entropy plots for 02, N2, CO2 :
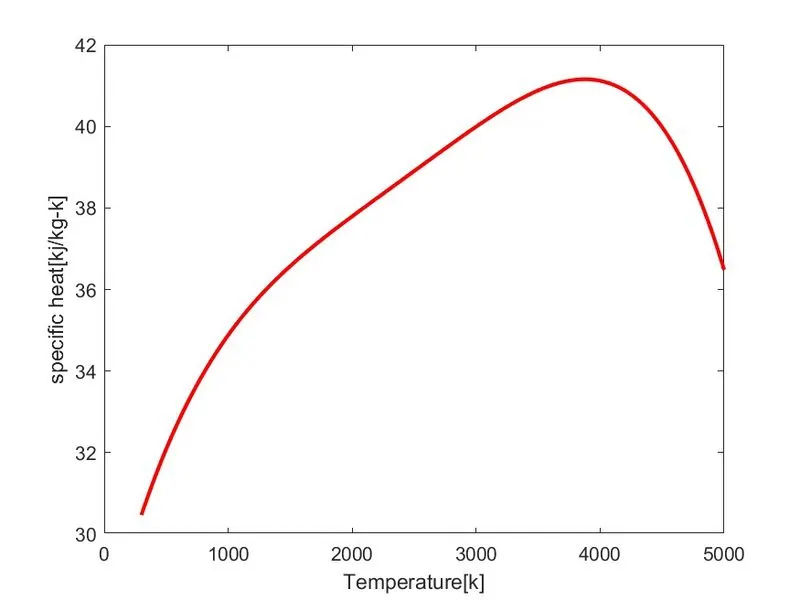
1.plots for O2:
specific heat vs temperature plot:
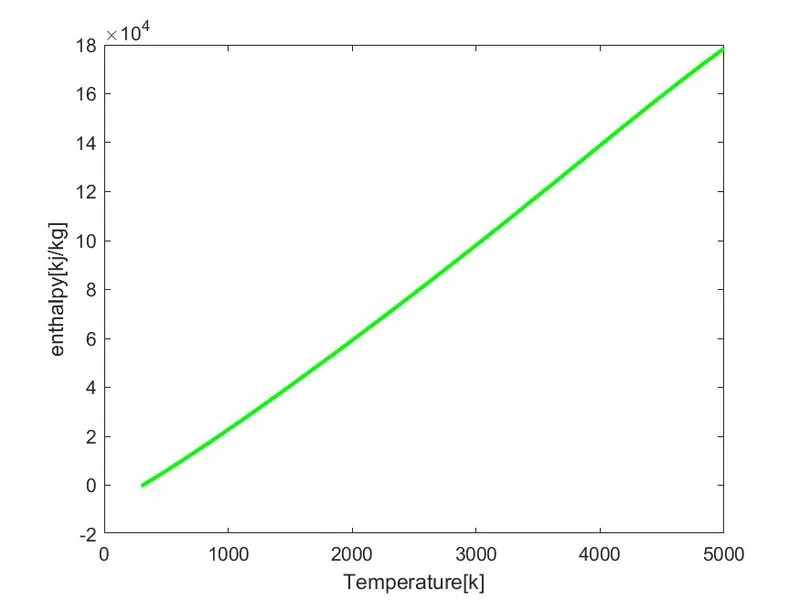
ENTHALPY VS TEMPERATURE PLOT:
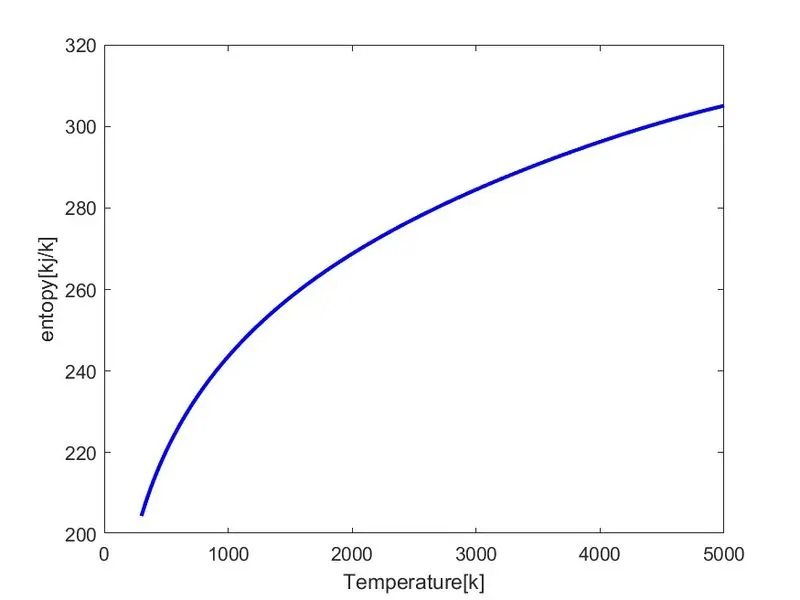
ENTROPY VS TEMPERATURE PLOT:
2.plots for N2:
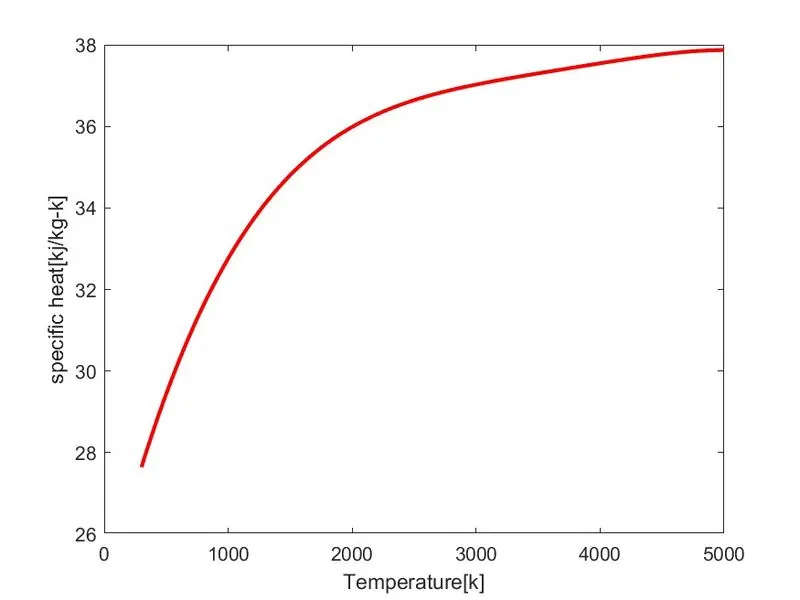
SPECIFIC HEAT VS TEMPERATURE PLOT:
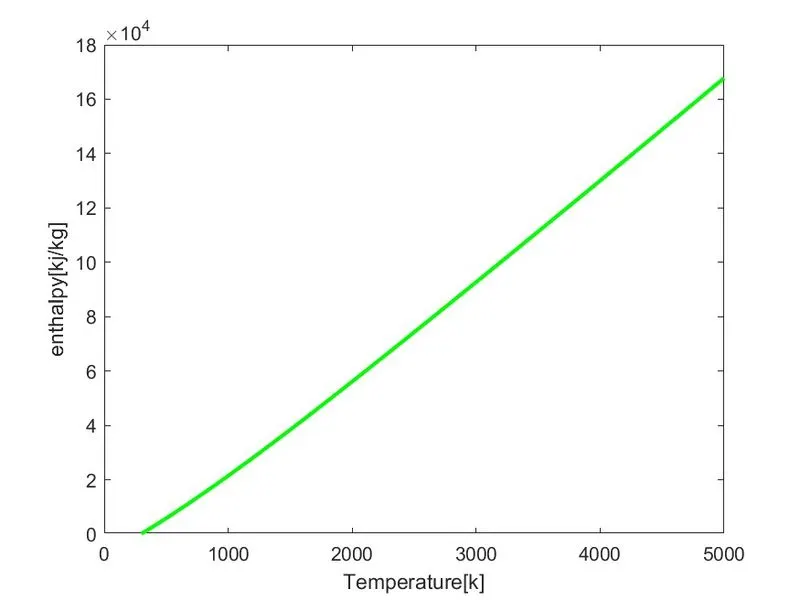
ENTHALPY VS TEMPERATURE PLOT:
ENTROPY VS TEMPERATURE PLOT:
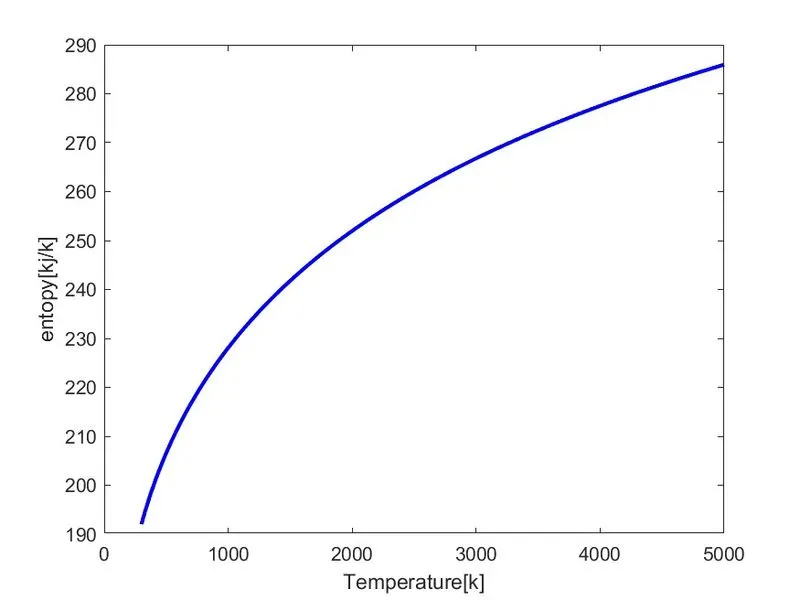
3. plots for CO2:
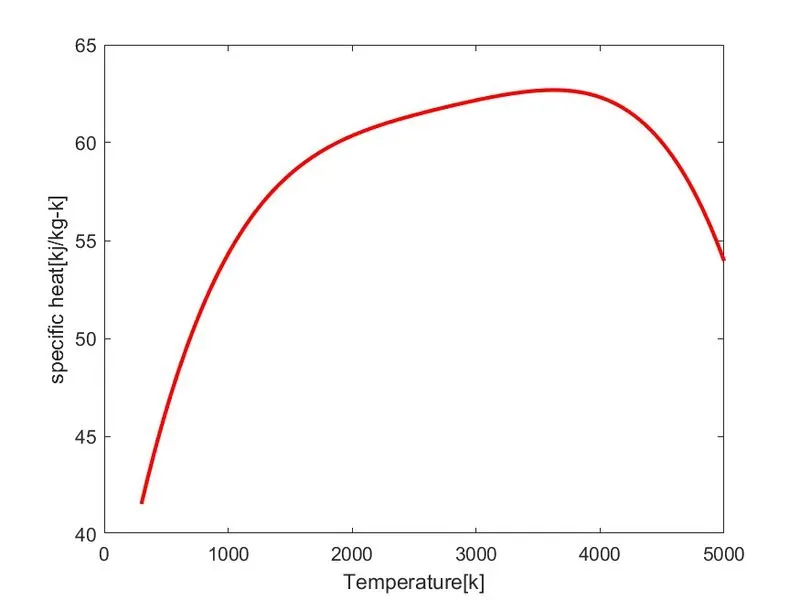
SPECIFIC HEAT VS TEMPERATURE PLOT:
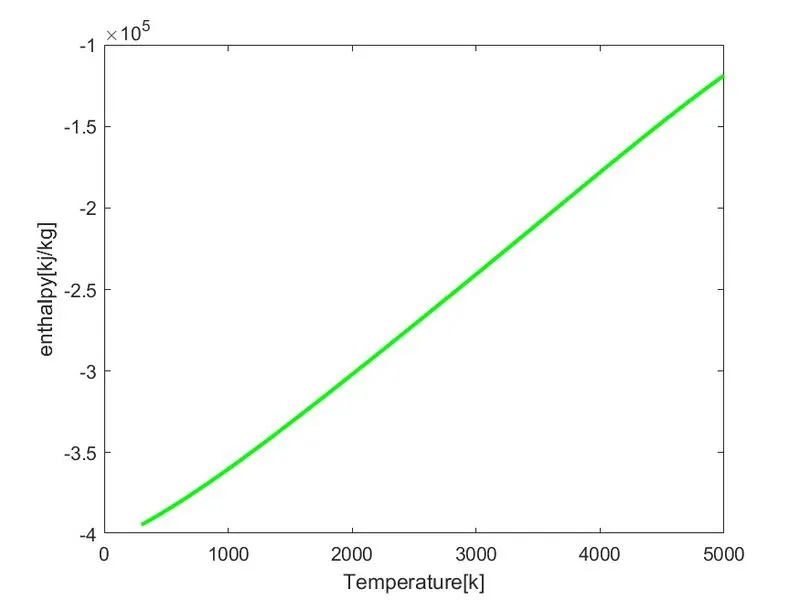
ENTHALPY VS TEMPERATURE PLOT:
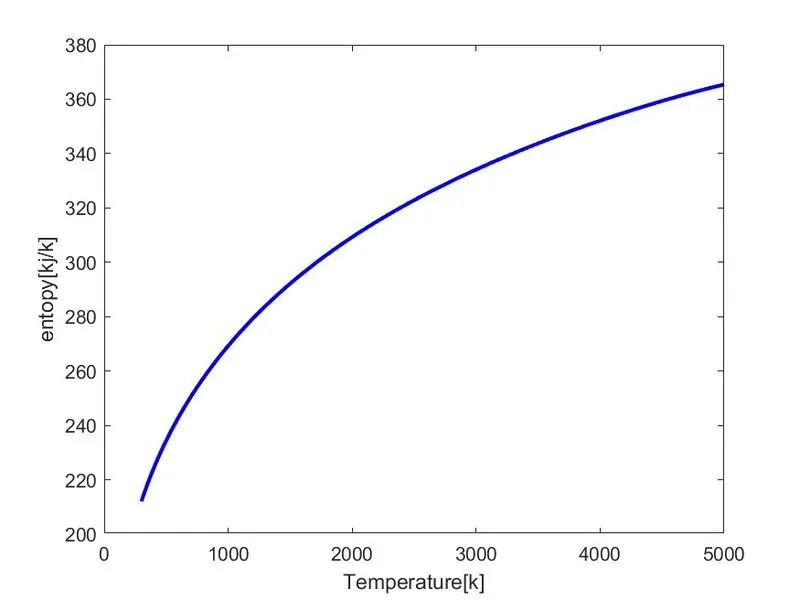
ENTROPY VS TEMPERATURE PLLOT:
CONCLUSION:
Using MATLAB code, the necessary coefficient required to evalute various thermodynamic parameters for different species are extracted from NASA thermodynamic data file. Specific heat , Enthalpy , Emtropy for all species are calculated and plotted against the local temperature range and the molecular weight is calculated for all species.
References:
https://in.mathworks.com/help/matlab/ref/mkdir.html
https://in.mathworks.com/matlabcentral/answers/317006-create-new-folders-by-mkdir
https://in.mathworks.com/help/matlab/ref/saveas.html
https://in.mathworks.com/matlabcentral/answers/17580-how-to-define-a-path-in-saveas-command
https://in.mathworks.com/help/matlab/ref/msgbox.html
https://in.mathworks.com/matlabcentral/answers/151692-display-value-in-message-box
https://in.mathworks.com/help/matlab/ref/fprintf.html
https://in.mathworks.com/help/matlab/ref/sprintf.html
http://combustion.berkeley.edu/gri-mech/data/nasa_plnm.html
https://ntrs.nasa.gov/citations/19940013151
https://link.springer.com/chapter/10.1007/978-1-4684-0186-8_8