function code:

function f = stalagmite (input_vector)

x = input_vector(1);
y = input_vector(2);

f1 = sin((5.1*pi*x)+0.5)^6;
f2 =sin((5.1*pi*y)+0.5)^6;
f3 = exp(-4*log(2)*((x-(0.0667))^2)/(0.64));
f4 = exp(-4*log(2)*((y-(0.0667))^2/(0.64)));
f = -(f1*f2*f3*f4);


main code:


clc
clear all
close all

% defining our search space

x = linspace(0,0.6,150);
y = linspace(0,0.6,150);

% creating a 2d dimensional mesh

[xx yy] = meshgrid(x,y);

for i=1:length(xx)
    for j=1:length(yy)
        % assign value of x and y in 2 column one row
        input_vector(1)= xx(i,j);
        input_vector(2)= yy(i,j);
        % putting values in stagalmite function to get two values
        f(i,j) = stalagmite(input_vector);
        %fprintf('array = %1.0f', f(i,j));
    end
end


% tic and toc is use to find the time to perform code
tic
% running ga for 50 cases

for k=1:50

    % from this we get functionvalue and two inputs

    [input , functionvalue(k)] = ga(@stalagmite , 2);
%     fprintf('array = %1.0f', functionvalue(k));
  % storing  value in x and y
    xo(k)=input(1);
    yo(k)=input(2);


end
study_time=toc

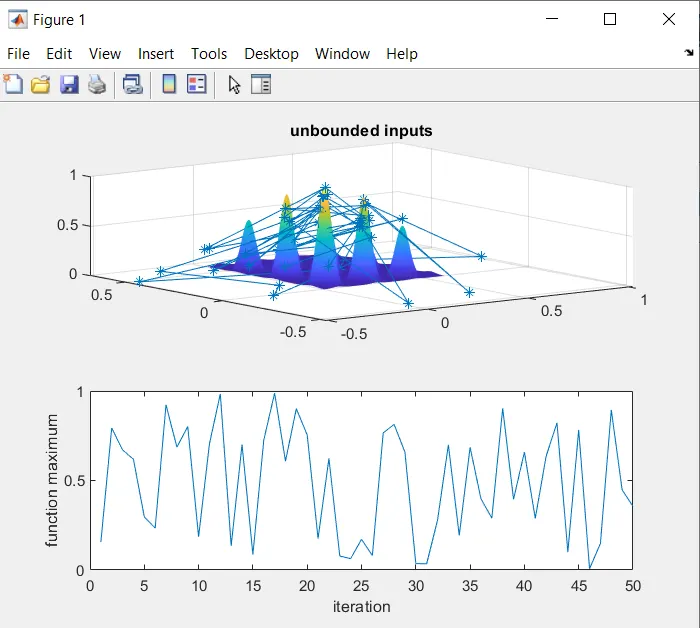
figure(1)

% it is used to plot in same window

subplot(2,1,1)

% to plot
surf(xx,yy,-f)

% to get clear view without grid
shading interp

hold on

% plots value of xo,yo,functionvalue in same plot.

plot3(xo,yo,-functionvalue,'marker','*')
title('unbounded inputs')
subplot(2,1,2)

% on second plot it plots functioinvalue only
%negative sign is use for finding maxima

plot(-functionvalue)
xlabel('iteration')
ylabel('function maximum')


%study 2

tic
% for bounded values from 0 to 1 below syntax is used
for k=1:50
    [input , functionvalue(k)] = ga(@stalagmite,2,[],[],[],[] ,[0:0],[1;1]);
%     fprintf('array = %1.0f', functionvalue(k));
    xo(k)=input(1);
    yo(k)=input(2);
end
study_time2=toc

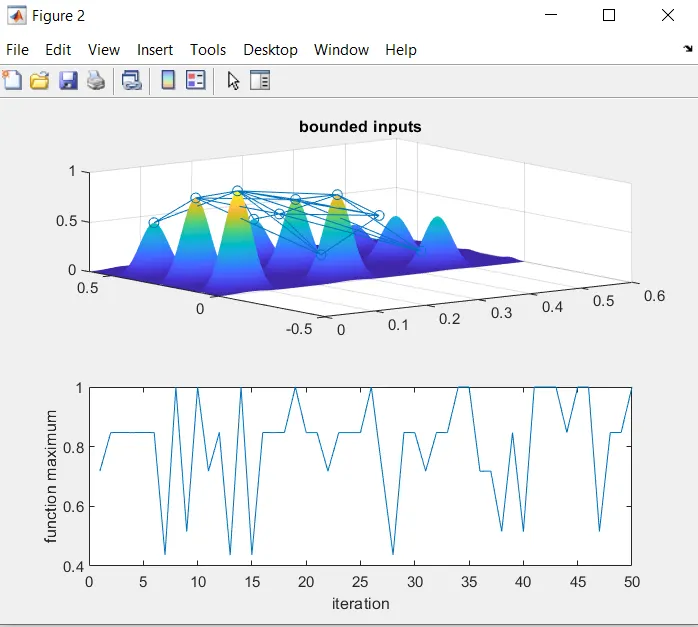
figure(2)


subplot(2,1,1)
surf(xx,yy,-f)
% hold on
shading interp
% subplot(2,1,1)
hold on
% plotting graph
plot3(xo,yo,-functionvalue,'marker','o')
title('bounded inputs')
subplot(2,1,2)
%plotting of function value
plot(-functionvalue)
xlabel('iteration')
ylabel('function maximum')

% study 3 increase

tic
% bounded and population size can be increase by using these syntax
options=optimoptions("ga")
options=optimoptions(options,'PopulationSize',300)

for k=1:50
    % here lower bound is o and upper bound is 1
    [input,functionvalue(k)] = ga(@stalagmite,2,[],[],[],[],[0;0],[1;1],[],[],options)
    % fprintf('array = %1.0f', functionvalue(k));

% to store value of inputs
    xo(k)=input(1);
    yo(k)=input(2);
end
study_time3=toc

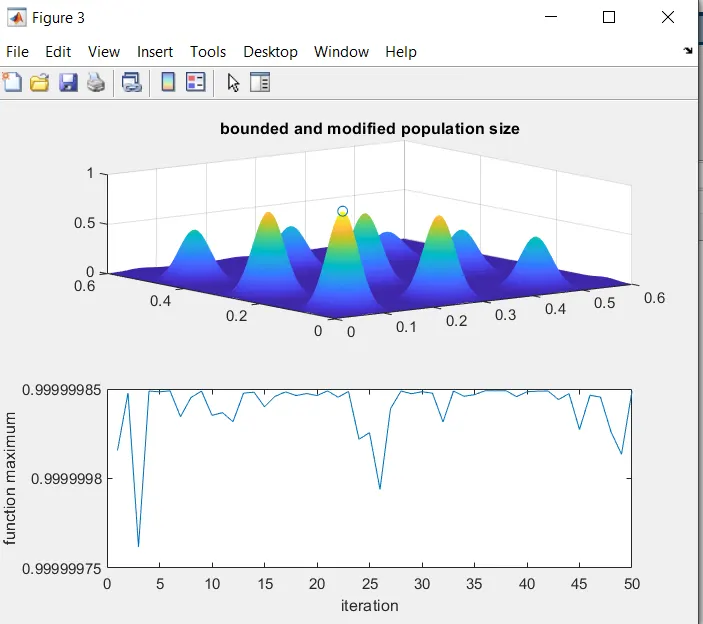
figure(3)
% to plot graph in same window
subplot(2,1,1)
surf(xx,yy,-f)

shading interp

hold on
% to plotting graph
plot3(xo,yo,-functionvalue,'marker','o')
title('bounded and modified population size')
subplot(2,1,2)
plot(-functionvalue)
xlabel('iteration')
ylabel('function maximum')