Week 4.1 - Genetic Algorithm
GENETIC ALGORITHM: GA is a process of selecting the fittest individual from a given number of solutions(population) to produce an optimum solution.
QUESTION: Write a code in MATLAB to optimise the stalagmite function and find the global maxima of the function.
PROGRAM:
Creating a stalagmite function
function f = f_stalagmite(input_vector)
x=input_vector(1);
y=input_vector(2);
f1= [sin(5.1*pi*x + 0.5)].^6;
f2= [sin(5.1*pi*y + 0.5)].^6;

f3=exp(-4* log(2) * ((x-0.0667).^2)/0.64);
f4=exp(-4* log(2) * ((y-0.0667).^2)/0.64);

f= -(f1.*f2.*f3.*f4); % -ve sign is given to procure maximum value
                       % GA predicts only the minima
end
Creating a program based on the function 'f_stalagmite' through GA
clear all
close all
clc

x= linspace(0,0.6,150);
y= linspace(0,0.6,150);
itrn=50;

[xx,yy]= meshgrid(x,y);

for i=1:length(xx)
    for j=1:length(yy)
        input_vector(1)=xx(i,j);
        input_vector(2)=yy(i,j);
        f(i,j)=f_stalagmite(input_vector);

    end
end

%CASE 1st

for i=1:itrn
[input,fopt(i)] = ga(@f_stalagmite,2);
xopt(i)= input(1);
yopt(i)= input(2);
end


figure(1)
subplot(2,1,1)
hold on
surfc(x, y, f)
shading interp
plot3(xopt,yopt,fopt,'marker','o','markersize',3,'markerFaceColor','r')
title('UNBOUNDED INPUTS')
subplot(2,1,2)
plot(fopt)
xlabel('x axis');
ylabel('y axis');

%CASE 2nd

for i=1:itrn
[input,fopt(i)] = ga(@f_stalagmite,2,[],[],[],[],[0,0],[0.6,0.6]);
xopt(i)= input(1);
yopt(i)= input(2);
end


figure(2)
subplot(2,1,1)
hold on
surfc(x, y, f)
shading interp
plot3(xopt,yopt,fopt,'marker','o','markersize',3,'markerFaceColor','r')
title('UNBOUNDED INPUTS')
subplot(2,1,2)
plot(fopt)

%CASE 3rd
options= optimoptions('ga');
options= optimoptions(options,'PopulationSize',200);
for i=1:itrn
[input,fopt(i)] = ga(@f_stalagmite,2,[],[],[],[],[0,0],[0.6,0.6],[],[],options);
xopt(i)= input(1);
yopt(i)= input(2);
end


figure(3)
subplot(2,1,1)
hold on
surfc(x, y, f)
shading interp
plot3(xopt,yopt,fopt,'marker','o','markersize',3,'markerFaceColor','r')
title('UNBOUNDED INPUTS')
subplot(2,1,2)
plot(fopt)
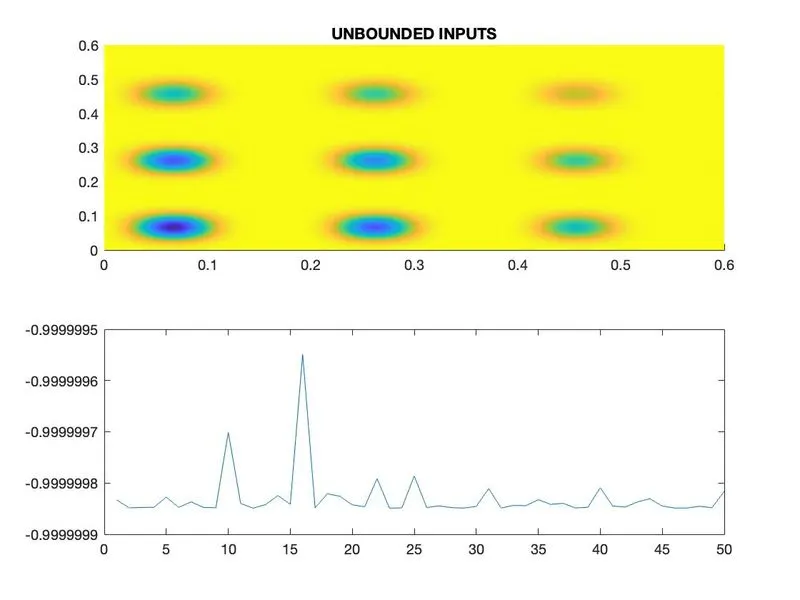
OUTPUT GRAPH IS GIVEN BELOW:
CASE1
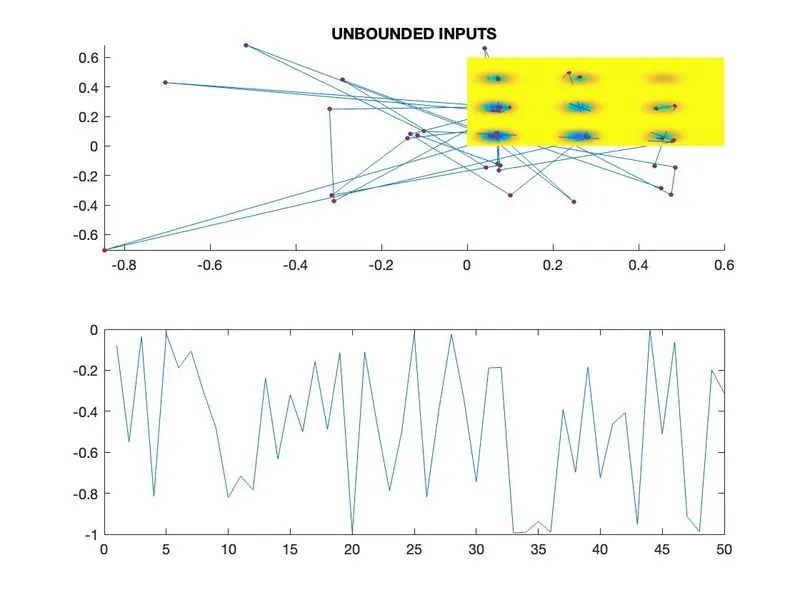
CASE 2:
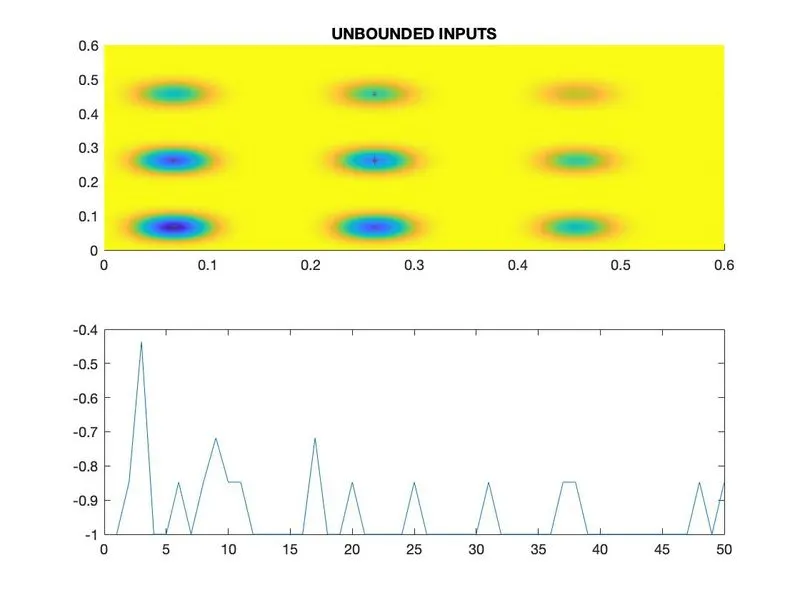
CASE 3: