Week 4.1 - Genetic Algorithm
the challenge is to write a program using stalagmite function to find the population with maximum and minimum
%stalagmite function of mathematical model
function[f]=stalagmite(data);
x=data(1);
y=data(2);
f1_x=[sin(5.1*pi*x+0.5)]^6;
f1_y=[sin(5.1*pi*y+0.5)]^6;
f2_x=exp(-4*log(2)*(((x-0.667)^2)/(0.64)));
f2_y=exp(-4*log(2)*(((y-0.667)^2)/(0.64)));
f=-(f1_x*f1_y*+f2_x*f2_y);
end
%global stalagmite function
clear all
close all
clc
x=linspace(0,0.7,150)
y=linspace(0,0.7,150)
[xx yy]=meshgrid(x,y)
for i=1:length(xx)
for j=1:length(yy)
data(1)=xx(i,j);
data(2)=yy(i,j);
f(i,j)=stalagmite(data);
end
end
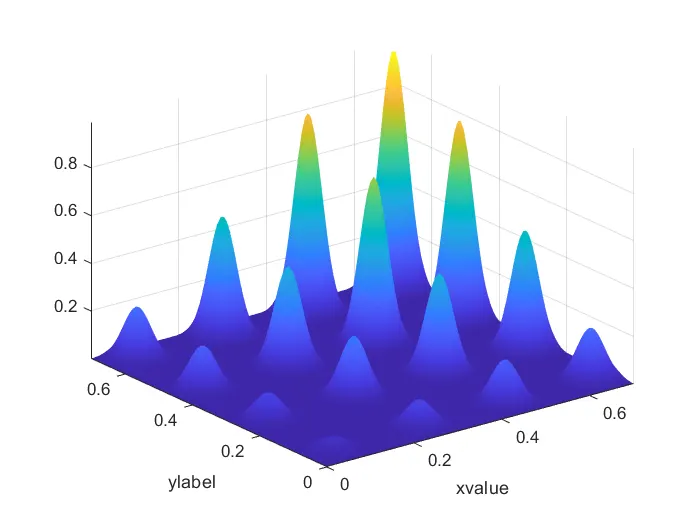
figure(1)
surfc(xx,yy,-f)
xlabel('xvalue')
ylabel('ylabel')
shading interp
[datas,fval]=ga(@stalagmite,2);
%statistical behaviour for global maxima and minima
clear all
close all
clc

x=linspace(0,0.7,150)
y=linspace(0,0.7,150)
[xx yy]=meshgrid(x,y)
for i=1:length(xx)
for j=1:length(yy)
    data(1)=xx(i,j);
    data(2)=yy(i,j);
    f(i,j)=stalagmite(data);
end
end
figure(1)
surfc(xx,yy,-f)
xlabel('xvalue')
ylabel('ylabel')
shading interp
[datas,fval]=ga(@stalagmite,2);

num_case=70
tic
for i=1:num_case
[data,fopt(i)]=ga(@stalagmite,2)
xopt(i)=data(1)
yopt(i)=data(2)
end
study_time_1=toc
figure(1)
subplot(2,1,1)
hold on
surfc(x,y,-f)
shading interp
plot3(xopt,yopt,-fopt,'marker','o','markersize',5,'MarkerFaceColor','g')
title('unbounded inputs')
subplot(2,1,2)
plot(fopt)
xlabel('iterations')
ylabel('function maximum') 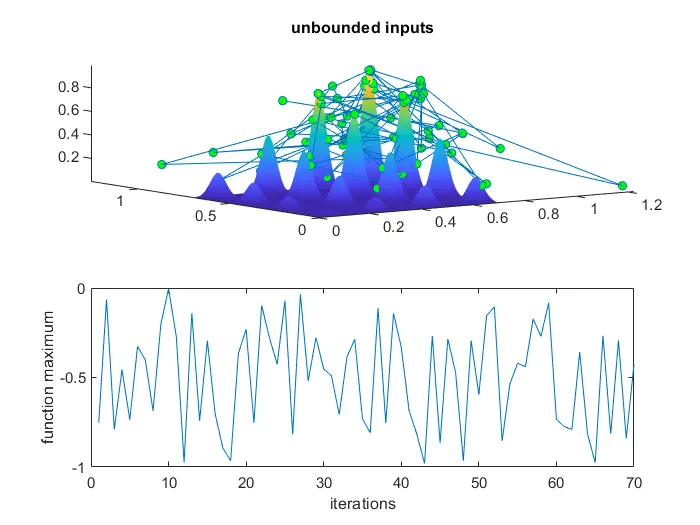
%global maximum and minimum
clear all
close all
clc

x=linspace(0,0.7,150)
y=linspace(0,0.7,150)
[xx yy]=meshgrid(x,y)
for i=1:length(xx)
for j=1:length(yy)
    data(1)=xx(i,j);
    data(2)=yy(i,j);
    f(i,j)=stalagmite(data);
end
end
figure(1)
surfc(xx,yy,-f)
xlabel('xvalue')
ylabel('ylabel')
shading interp
[datas,fval]=ga(@stalagmite,2);
num_case=70
tic
for i=1:num_case
    [data,fopt(i)]=ga(@stalagmite,2,[],[],[],[],[0:0],[0.7:0.7])
    xopt(i)=data(1)
yopt(i)=data(2)
end
study_time_2=toc
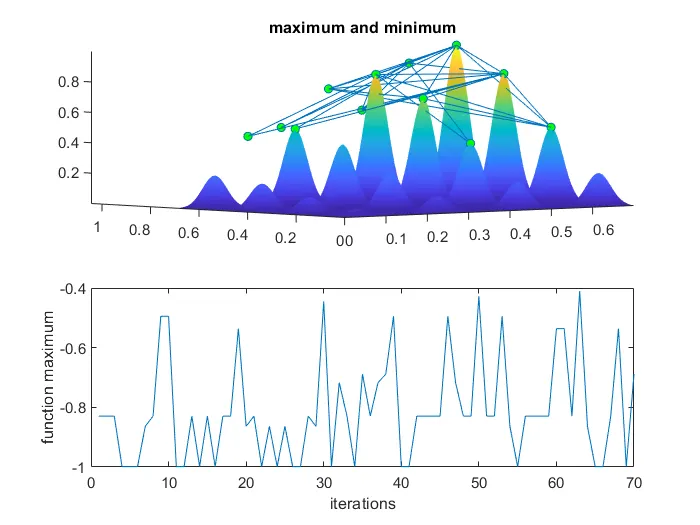
figure(2)
subplot(2,1,1)
hold on
surfc(x,y,-f)
shading interp
plot3(xopt,yopt,-fopt,'marker','o','markersize',5,'MarkerFaceColor','g')
title('maximum and minimum')
subplot(2,1,2)
plot(fopt)
xlabel('iterations')
ylabel('function maximum')
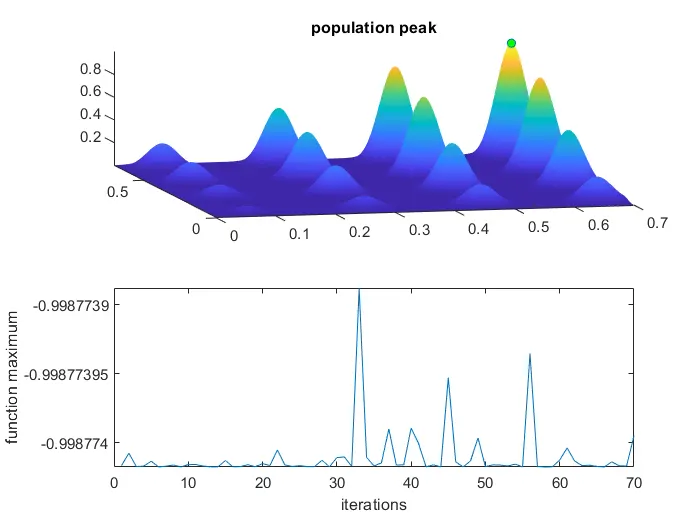
clear all
close all
clc
x=linspace(0,0.7,150)
y=linspace(0,0.7,150)
[xx yy]=meshgrid(x,y)
for i=1:length(xx)
for j=1:length(yy)
data(1)=xx(i,j);
data(2)=yy(i,j);
f(i,j)=stalagmite(data);
end
end
figure(1)
surfc(xx,yy,-f)
xlabel('xvalue')
ylabel('ylabel')
shading interp
[datas,fval]=ga(@stalagmite,2);
num_case=70
tic
options=optimoptions('ga')
options=optimoptions(options,'PopulationSize',400)
for i=1:num_case
[data,fopt(i)]=ga(@stalagmite,2,[],[],[],[],[0;0],[0.7;0.7],[],[],options)
xopt(i)=data(1)
yopt(i)=data(2)
end
study_time_3=toc
figure(3)
subplot(2,1,1)
hold on
surfc(x,y,-f)
shading interp
plot3(xopt,yopt,-fopt,'marker','o','markersize',5,'MarkerFaceColor','g')
title('population peak')
subplot(2,1,2)
plot(fopt)
xlabel('iterations')
ylabel('function maximum')