Project 1 - Parsing NASA thermodynamic data
The project is to extract the function using 'NASA Thermodynamics' and to extract the coefficients and to calculate the entropy, enthalpy and specific heat
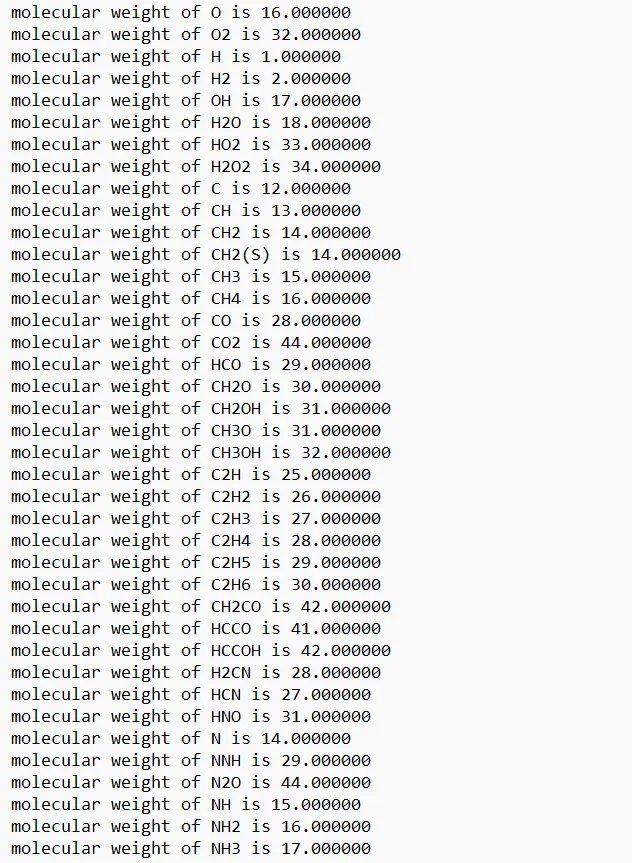
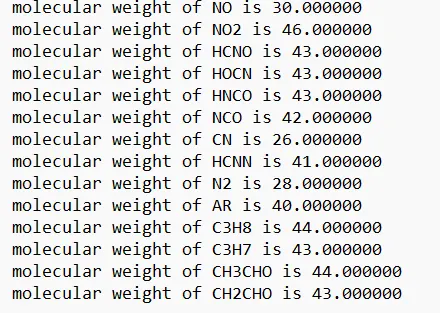
Calculate the molecular weight of the species
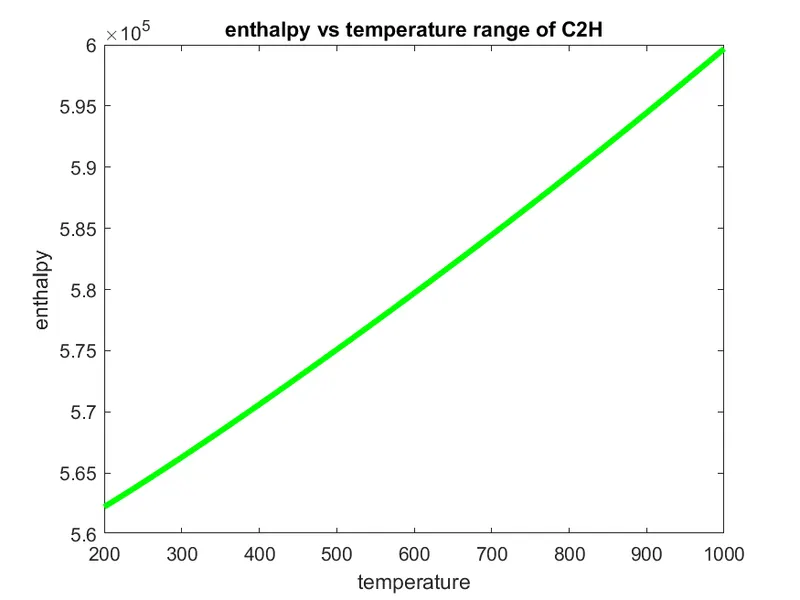
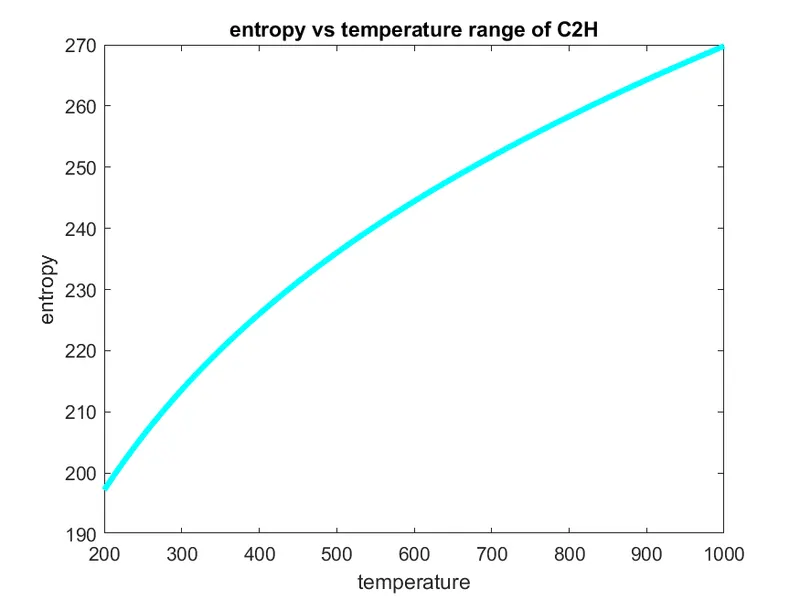
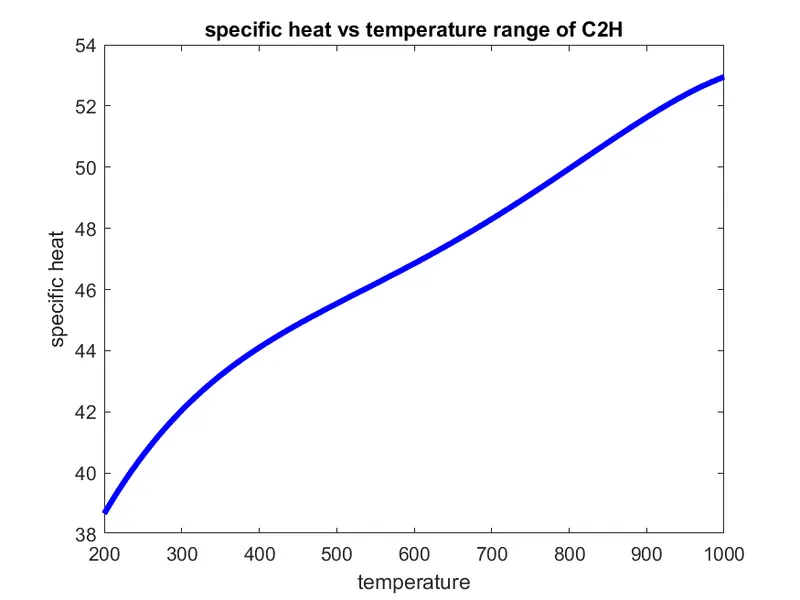
Plot the graph based on entropy, enthalpy and specific heat
r =universal gas constant
c_p=specific heat
h=enthalpy
s=entropy
t=temperature
function c_p=specificheat(a1,a2,a3,a4,a5,b1,b2,b3,b4,b5,t,r,low_temperature_local)
    if t>low_temperature_local
        c_p=(a1+a2.*t+a3.*t.^2+a4.*t.^3+a5.*t.^4).*r;
            else
        c_p=(b1+b2.*t+b3.*t.^2+b4.*t.^3+b5.*t.^4).*r;
            end

function h=enthalpy(a1,a2,a3,a4,a5,a6,b1,b2,b3,b4,b5,b6,t,r,low_temperature_local)
    if t>low_temperature_local
h=(a1.*t+(a2.*t.^2)./2+(a3.*t.^3)./3+(a4.*t.^4)./4+(a5.*t.^5)./5+a6).*r;
            else
h=(b1.*t+(b2.*t.^2)./2+(b3.*t.^3)./3+(b4.*t.^4)./4+(b5.*t.^5)./5+b6).*r;
            end

function s=entropy(a1,a2,a3,a4,a5,a7,b1,b2,b3,b4,b5,b7,t,r,low_temperature_local)
    if t>low_temperature_local
          s=(a1.*log(t)+a2.*t+(a3.*t.^2)./2+(a4.*t.^3)./3+(a5.*t.^4)./4+a7).*r;
            else
          s=(b1.*log(t)+b2.*t+(b3.*t.^2)./2+(b4.*t.^3)./3+(b5.*t.^4)./4+b7).*r;
            end
function [molecular_wt]=molecular_weight(species)
constituents=['H','C','N','O','A'];
atomic_weight=[1 12 14 16 40]
molecular_wt=0;
for i=1:length(species)
for j=1:length(constituents)
if strcmpi(species(i),constituents(j))==1
molecular_wt=molecular_wt+atomic_weight(j)
u=j
end
end
n=str2num(species(i));
if n>1
molecular_wt=molecular_wt+(atomic_weight(u)*(n-1))
end
end
disp(['molecular weight of',species,' is '])
disp(molecular_wt)
end
clear all
close all
clc

f1=fopen('thermo.dat','r')
header=fgetl(f1);
l1=fgetl(f1);

%temperature from thermo file
temp=strsplit(l1,'  ');
low_temperature_overall=str2num(temp{2});
mid_temperature_overall=str2num(temp{3});
high_temperature_overall=str2num(temp{4});

for i=1:3
l2=fgetl(f1)
end

list=fopen('molecular_wt.txt','wt')
for j=1:53
l3=fgetl(f1)
at=strfind(l3,'.')
t=strsplit(l3(at-3:end-1),' ')

low_temperature_local=str2num(t{1})
mid_temperature_local=str2num(t{2})
high_temperature_local=str2num(t{3})
t=linspace(low_temperature_local,high_temperature_local,200)
species=strtok(l3,' ')


a=fgetl(f1)
b=fgetl(f1)
c=fgetl(f1)

d=strfind(a,'E')
e=strfind(b,'E')
f=strfind(c,'E')


% extracting species name
a1=str2num(a(1:d(1)+3));
a2=str2num(a(d(1)+4:d(2)+3));
a3=str2num(a(d(2)+4:d(3)+3));
a4=str2num(a(d(3)+4:d(4)+3));
a5=str2num(a(d(4)+4:d(5)+3));
a6=str2num(b(1:e(1)+3));
a7=str2num(b(e(1)+4:e(2)+3));
% third line
b1=str2num(b(e(2)+4:e(3)+3));
b2=str2num(b(e(3)+4:e(4)+3));
b3=str2num(b(e(4)+4:e(5)+3));
b4=str2num(c(1:f(1)+3));
b5=str2num(c(f(1)+4:f(2)+3));
b6=str2num(c(f(2)+4:f(3)+3));
b7=str2num(c(f(3)+4:f(4)+3));

r=8.3145
[c_p]=specificheat(a1,a2,a3,a4,a5,b1,b2,b3,b4,b5,t,r,low_temperature_local)
[h]=enthalpy(a1,a2,a3,a4,a5,a6,b1,b2,b3,b4,b5,b6,t,r,low_temperature_local)
[s]=entropy(a1,a2,a3,a4,a5,a7,b1,b2,b3,b4,b5,b7,t,r,low_temperature_local)
[molecular_wt]=molecular_weight(species)


mkdir(species);
current_dir=pwd
cd(species)

plotting(c_p,h,s,t,species)
cd(current_dir)
fprintf(list,'molecular weight of %s is %f \n',species,molecular_wt);
end

fclose(list)
function plotting(c_p,h,s,t,species)

figure(1)

plot(t,c_p,'linewidth',3,'color','b')
xlabel('temperature')
ylabel('specific heat')
title(sprintf('specific heat vs temperature range of %s',species))
saveas(figure(1),'specific heat.png')

% temperature and enthalpy
figure(2)
plot(t,h,'linewidth',3,'color','g')
xlabel('temperature')
ylabel('enthalpy')
title(sprintf('enthalpy vs temperature range of %s',species))
saveas(figure(2),'enthalpy.png')

%temperature and entropy
figure(3)
plot(t,s,'linewidth',3,'color','c')
xlabel('temperature')
ylabel('entropy')
title(sprintf('entropy vs temperature range of %s',species))
saveas(figure(3),'entropy.png')


end
plot