Week 4.1 - Genetic Algorithm
clear all
close all
clc

%defining our search space
x = linspace(0,0.6,20);
y = linspace(0,0.6,20);
%creating a 2-D mesh
[xx yy] = meshgrid(x,y);
%evaluating the stalagmite function
for i = 1:length(xx)
    for j = 1:length(yy)
        input_vector(1) = xx(i,j);
        input_vector(2) = yy(i,j);
        f(i,j) = stalagmite(input_vector);
    end
end
surfc(xx,yy,f)
shading interp
num_cases = 20;
tic
%study1-statistical behaviour
for i = 1:num_cases
    [inputs, fopt(i)] = ga(@stalagmite, 2);
    xopt(i) = inputs(1);
    yopt(i) = inputs(2);
end
study1_time = toc;
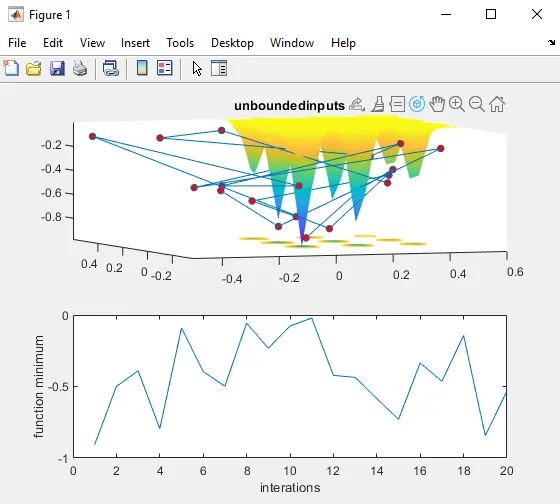
figure(1)
subplot(2,1,1)
hold on
surfc(x,y,f)
shading interp
plot3(xopt,yopt,fopt,'marker','o','markersize',5,'markerfacecolor','r')
title('unboundedinputs')
subplot(2,1,2)
plot(fopt)
xlabel('interations')
ylabel('function minimum')
tic
%study2-statistical behaviour-with upper and lower bounds
for i = 1:num_cases
[inputs,fopt(i)] = ga(@stalagmite,2,[],[],[],[],[0;0],[1;1]);
xopt(i) = inputs(1);
yopt(i) = inputs(2);
end
study2_time = toc
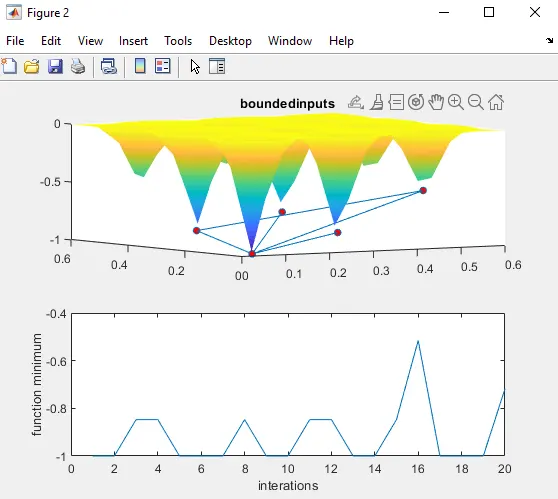
figure(2)
subplot(2,1,1)
hold on
surf(x,y,f)
subplot(2,1,1)
hold on
surf(x,y,f)
shading interp
plot3(xopt,yopt,fopt,'marker','o','markersize',5,'markerfacecolor','r');
title('boundedinputs')
subplot(2,1,2)
plot(fopt)
xlabel('interations')
ylabel('function minimum')
%study3 increasing ga iterations
options = optimoptions('ga');
options = optimoptions(options,'populationsize',100);
tic
for i = 1:num_cases
[inputs,fopt(i)] = ga(@stalagmite,2,[],[],[],[],[0;0],[1;1],[],[],options);
xopt(i) = inputs(1);
yopt(i) = inputs(2);
end
study3_time = toc
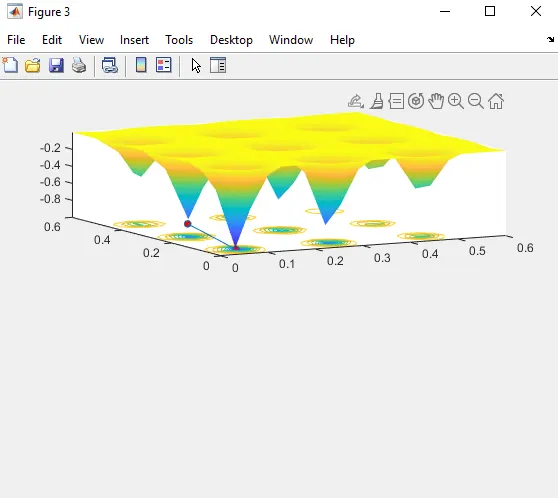
figure(3)
subplot(2,1,1)
hold on
surfc(x,y,f)
subplot(2,1,1)
hold on
surfc(x,y,f)
subplot(2,1,1)
hold on
surfc(x,y,f)
shading interp
plot3(xopt,yopt,fopt,'marker','o','markersize',5,'markerfacecolor','r')
What is GA?
It is commonly used to generate high quality solutions to optimization problems by relying on biological operations etc.
What is Optimization?
It is an area of study which deals with minimization or maximization of function which depends on multiple input parameters.
Erros faced during coding are
1.syntax error
at plot3(xopt,yopt,fopt,'marker','0','markersize',5,'markerfacecolor','r')
at this line instead of giving 'o' I gave '0', contacted my support engineer he said there you have made an error.
Did not releate the search space and plotting function for all 3 cases.