Project 1 - Parsing NASA thermodynamic data
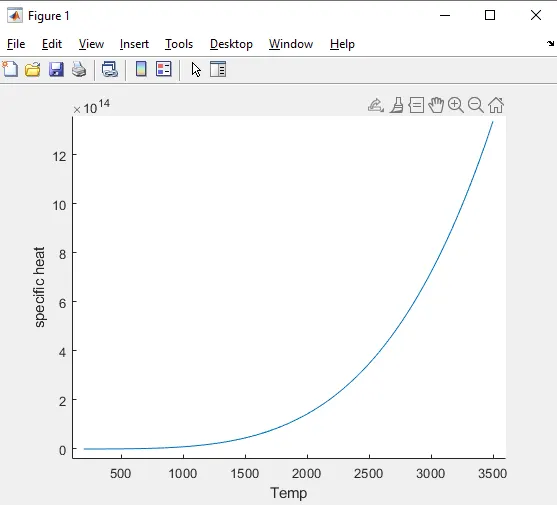
This figure is between temperature and specific heat within local temperatures.
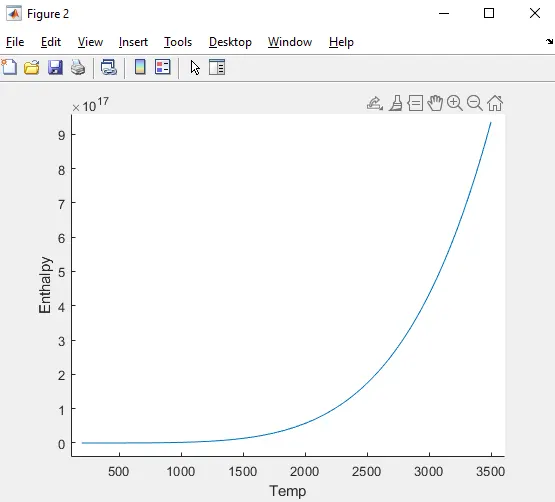
This figure is between temperature and Enthalpy within local temperatueres.
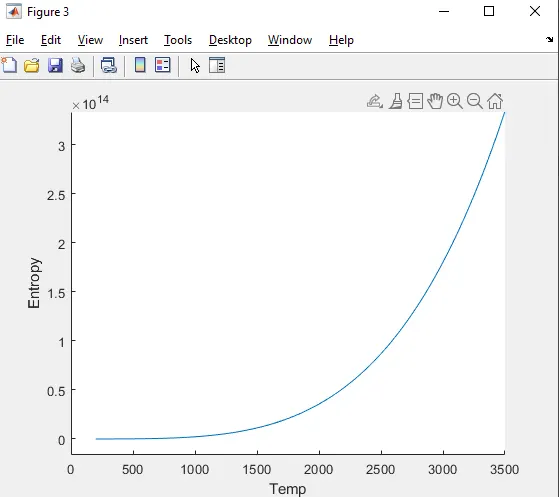
This figure is between temperature and Entropy within local temperatures.
clear all
close all
clc
%opening NASA thermodynamic data file 'THERMO.dat' in read mode
f1 = fopen('THERMO.dat','r');
%To find total number of species
string = fgetl(f1);
while strcmp(string,'END')==0   %Here we are saying to reun till the last of the 'THERMO.dat' file i.e till END
      string = fgetl(f1)
      i = i+1;                  %Here we are incrementing for evey while condition
end
total_lines = i;
total_species = (total_lines-6)/4;
%getting the data file
f1 = fopen('THERMO.dat','r');
fgetl(f1)
%reading information
A = fgetl(f1);
A = strsplit(A,' ');
global_low_temp = str2num(A{2});
global_mid_temp = str2num(A{3});
global_high_temp = str2num(A{4});
%skipping next three lines
for i = 1:3
   fgetl(f1);
end
%reading the species
for i = 1:53
    header = fgetl(f1);
    x = strsplit(header,' ');
    species_name = (x{1});
    z = length(x);

    local_low_temp = str2double(x{z-3});
    local_high_temp = str2double(x{z-2});
    local_mid_temp = str2double(x{z-1});

    t1 = local_low_temp;
    t2 = local_mid_temp;
    t3 = local_high_temp;

    %getting line coefficients
    line_1 = fgetl(f1);

    a = strfind(line_1,'E');
    a1 = str2double(line_1(1:a(1)+3));
    a2 = str2double(line_1(a(1)+4:a(2)+3));
    a3 = str2double(line_1(a(2)+4:a(3)+3));
    a4 = str2double(line_1(a(3)+4:a(4)+3));
    a5 = str2double(line_1(1:a(1)+3));
    a6 = str2double(line_1(1:a(1)+3));
    a7 = str2double(line_1(1:a(1)+3));
    a8 = str2double(line_1(1:a(1)+3));
    a9 = str2double(line_1(1:a(1)+3));
    a10 = str2double(line_1(1:a(1)+3));
    a11 = str2double(line_1(1:a(1)+3));
    a12 = str2double(line_1(1:a(1)+3));
    a13 = str2double(line_1(1:a(1)+3));
    a14 = str2double(line_1(1:a(1)+3));
    T = linspace(t1,t3,1000);
    R= 8.314;
    %Cp=Heat capacity, H=Enthalpy, S=Entropy
    for k = 1:length(T)
    %to compare the species temperature to assign the coeeficients
    %a1-a7(high temperature coefficients), a8-a14(low temperature coefficients)
    if T(k)>t2

    %high temperature coefficients
    cp(k) = (a1 + a2.*T(k) + a3.*T(k).^2 + a4.*T(k).^3 + a5.*T(k).^4)*R;
    H(k) = (a1 + (a2.*T(k))/2 + (a3.*T(k).^2)/3 + (a4.*T(k).^3)/4 + (a5.*T(k).^4)/5 + (a6./T(k)))*R.*T(k);
    S(k) = (a1.*log(T(k)) + a2.*T(k) + (a3.*T(k).^2)/2 + (a4.*T(k).^3)/3 + (a5.*T(k).^4)/4 + a7)*R;
    else
    %low temperature coeffecients
    cp(k) = (a8 + a9.*T(k) + a10.*T(k).^2 + a11.*T(k).^3 + a12.*T(k).^4)*R;
    H(k) = (a8 + (a9.*T(k))/2 + (a10.*T(k).^2)/3 + (a11.*T(k).^3)/4 + (a12.*T(k).^4)/5 + (a13./T(k)))*R.*T(k);
    S(k) = (a8.*log(T(k)) + a9.*T(k) + (a10.*T(k).^2)/2 + (a11.*T(k).^3)/3 + (a12.*T(k).^4)/4 + a14)*R;

    end
    end
end
figure(1);
hold on
plot(T,cp);
xlabel('Temp');
ylabel('specific heat');
figure(2)
hold on
plot(T,H);
xlabel('Temp');
ylabel('Enthalpy');
figure(3);
hold on
plot(T,S);
xlabel('Temp');
ylabel('Entropy');