Week 4.1 - Genetic Algorithm
AIM:- To write a code in MATLAB to optimise the stalagmite function and find the global maxima of the function an plot the graphs.
OBJECTIVE:-
- To study about the optimization process and to find out the optimum value.
- Study th statistical behaviour of unbounded, bounded and increase the no of iterations to find the global maxima
- Plot the graph for finding global maxima.
Genetic Algorithm :-
Genetic Algorithm (GA) is a branch of field of study called evolutionary comutation. It is based on evolution theory by Darwin. GA is used to optimize a given function to find its maximum or minimum value. The basic components of a GA are
1. Fitness function : It is the function that GA is trying to optimize.
2. A population of chromosome : It is the numerical values that represent all the solutions to the function. The selection operator chooses some of the chromosomes (with replacement) for reproduction based on probability distribution. fitter the chromosome more likely it is to be selected.
3. Cross over : This operator swaps in random a subsequence of two of the chosen chromosomes to create two offspring. Usually each chromosome is converted into binary code and then cross over is done from one parent chromosome into another.
4. Mutation : Mutation operator randomly flips individual bits in the new chromosomes.
The GA syntax in Matlab is given by :
`x = ga(fun,nvars,A,B.Aeq.Beq,LB,UB.nonlcon,intcon,options)`
Where,
fun = objective function
nvars = number of variables
A and B = subject to linear inequalities of the form A*x <=B
Aeq and Beq = subject to linear equalities of the form A*x = B
LB = lower bound
UB = upper bound
nonlcon = non linear inequalities
intcon = integer constrained
options = helps to add contraint tolerance by increasing the population size
Some advantages of genetic algorithms this method are the following:-
1) They usually perform better than traditional feature selection techniques.
2) Genetic algorithms can manage data sets with many features.
3) They don't need specific knowledge about the problem under study.
4) These algorithms can be easily paralelized in computer clusters.
Working of Genetic Algorithm:-
The following outline summarizes how the genetic algorithm works:-
1) The algorithm begins by creating a random initial population.The algorithm then creates a sequence of new populations.
2) At each step, the algorithm uses the individuals in the current generation to create the next population.
To create the new population, the algorithm performs the following steps:
a) Scores each member of the current population by computing its fitness value. These values are called the raw fitness scores.
b) Scales the raw fitness scores to convert them into a more usable range of values. These scaled values are called expectation values.
c) Selects members, called parents, based on their expectation.
d) Some of the individuals in the current population that have lower fitness are chosen as elite. These elite individuals are passed to the next population.
e) Produces children from the parents. Children are produced either by making random changes to a single parent—mutation or by combining the vector entries of a pair of parents—crossover.
e) Replaces the current population with the children to form the next generation.The algorithm stops when one of the stopping criteria is met.
CODE:-
The code for function optimization,
function[f]  = stalagmite(input_vector)
f1_x = (sin((5.1*pi*input_vector(1)) + 0.5))^6;
f1_y = (sin((5.1*pi*input_vector(2)) + 0.5))^6;
f2_x = exp((-4*log(2)*(input_vector(1)-0.0667)^2)/0.64);
f2_y = exp((-4*log(2)*(input_vector(2)-0.0667)^2)/0.64);
f = -(f1_x * f1_y * f2_x * f2_y);
end
The code for optimization and to find global maxima,
clear all
close all
clc

% Inputs
x = linspace(0,0.7,170);
y = linspace(0,0.7,170);

% No of iterations
num_cases = 50

[xx yy] = meshgrid(x,y);

%Calling stalagmite_func function

for i = 1 : length(xx)
    for j = 1: length(yy)
        input_vector(1) = xx(i,j);
        input_vector(2) = yy(i,j);
        f(i,j) = stalagmite_func(input_vector);
    end
end

%study 1 Statistical behaviour with unbounded inputs

tic
for a = 1 : num_cases
    [input1,fopt1(a)] = ga(@stalagmite_func,2);
    xopt1(a) = input1(1);
    yopt1(a) = input1(2);
end
study_time = toc

figure(1)
subplot(2,1,1)
hold on
surfc(x,y,-f)
shading interp
plot3(xopt1,yopt1,-fopt1,'marker','o','markersize',8,'markerfacecolor','k')
title('Statistical behaviour with unbounded inputs')
subplot(2,1,2)
plot(-fopt1)
xlabel('iterations')
ylabel('function maxima')

%study2 statastical behaviour with bounded inputs
tic
for b = 1:num_cases
    [input2,fopt2(b)] = ga(@stalagmite_func,2,[],[],[],[],[0;0],[0.7;0.7]);
    xopt2(b) = input2(1);
    yopt2(b) = input2(2);
end
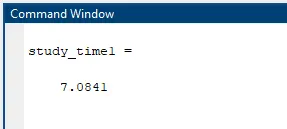
study_time1 = toc

figure(2)
subplot(2,1,1)
hold on
surfc(x,y,-f)
shading interp
plot3(xopt2,yopt2,-fopt2,'marker','o','markersize',8,'markerfacecolor','g')
title('statastical behaviour with bounded inputs')
subplot(2,1,2)
plot(-fopt2)
xlabel('iterations')
ylabel('function maxima')

%study3 Increasing ga iterations

options = optimoptions('ga')
options = optimoptions(options,'populationsize',200);

tic
for c = 1:num_cases
    [input3,fopt3(c)] = ga(@stalagmite_func,2,[],[],[],[],[0;0],[1;1],[],[],options);
    xopt3(c) = input3(1);
    yopt3(c) = input3(2);
end
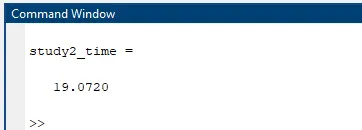
study2_time = toc


figure(3)
subplot(2,1,1)
hold on
surfc(x,y,-f)
shading interp
plot3(xopt3,yopt3,-fopt3,'marker','o','markersize',5,'markerfacecolor','r')
title('Increasing ga iterations')
subplot(2,1,2)
plot(-fopt3)
xlabel('iterations')
ylabel('function maxima')
Explanation:-
- First we have give the linspace commands to the x and y arrays
- And number of iterations is to be 50 ( we can give as per our need)
- By using meshgrid command we define a plot for x and y arrays
- We have a written a function program to calculate the values of minimum value.
- By using the for loop, we call the function to this loop and calculated the minimum value.
- We have done a three studys here
Study1: Stattical behaviour with un bounded inputs - calculating the global maxima using the stalagmite optimization with statistical behaviour by creating a for loop and finding out the optimum values, also calculate time taken to complete the operation.Plot the stalagmite and optimum value in a subplot and foptimum values separately.
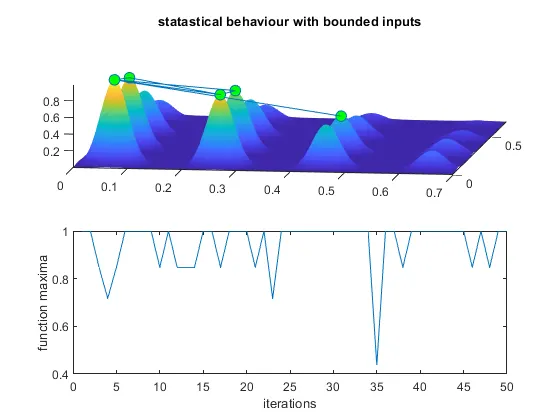
Study2: Statastical behaviour with bounded inputs - By calculating like above, the difference is change in syntax of ga. Upper and lower boundaries are used. Plot the graphs as mentioned above.
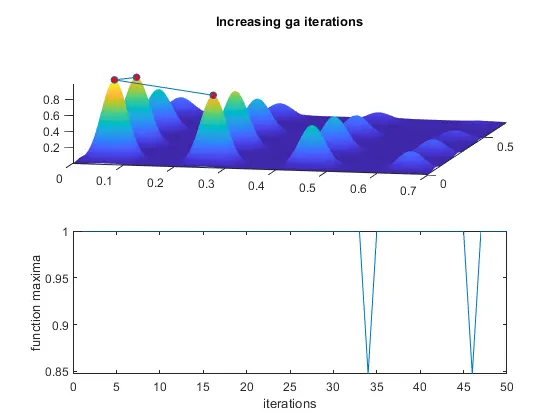
Study3: Increasing ga iterations - By calculating like above, the difference is change in syntax and by assinging the range of iterations.Plot the graphs as mentioned above.
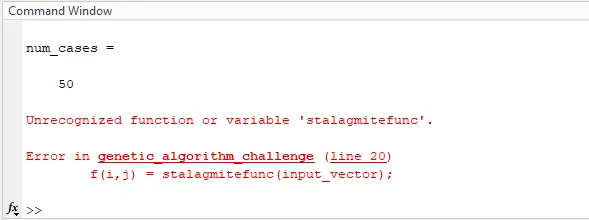
Errors:-
I wrote { f(i,j) = stalagmitefunc(input_vector);} for { f(i,j) = stalagmite_func(input_vector);}
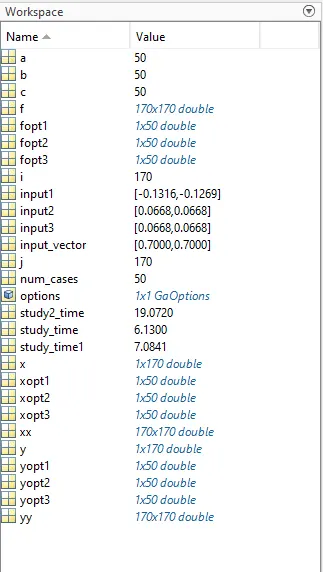
Workspace:-
RESULTS
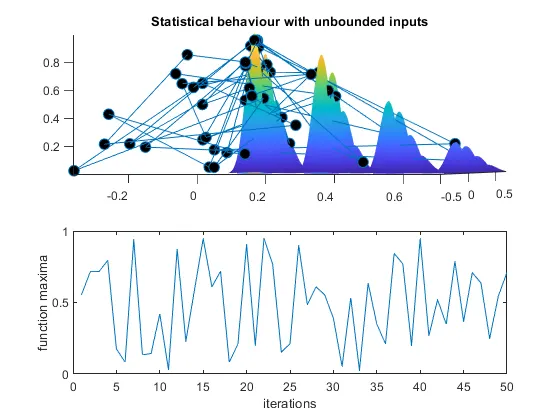
1) Study 1 : Graph
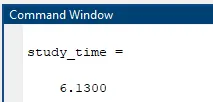
Study 1 : Study time:- 6.1300
2) Study 2 : Graph
Study 2 : Study time:- 7.0841
3) Study 3 : Graph
Study 3 : Study time:- 19.0720
CONCLUSION:
- To create a stagalmite function and find the optimum value by using matlab and plotted the curves.
- Learning the concept of geometric algorithm to find a global maxima.
- From the graphs we can say that 1st graph is Statstical behaviour of unbounded inputs, we get many minimum values. And the second graph is h is Statstical behaviour of bounded inputs within a limit. And 3rd graph is ga iterations,we got a global maxima.