Week 4.1 - Genetic Algorithm
Aim:-
- To explain the Concept of Ga and syntax for Ga in MATLAB.
- To write a code in MATLAB to optimize the stalagmite function and find the global maxima of the function.
- On several execution's code should provide the same output each time.
- To plot a graph for all 3 studies and for F maximum vs no. of iterations. Title and axes labels are a must, legends could be shown if necessary.
Concept of Genetic Algorithm:-
Genetic algorithm is a strategies that guide the search process inspired by the process of natural selection. Genetic algorithm are commonly used for generating high quality solutions to optimization and search problems by relaying on biologically inspired operators such as mutation, crossover and selection.
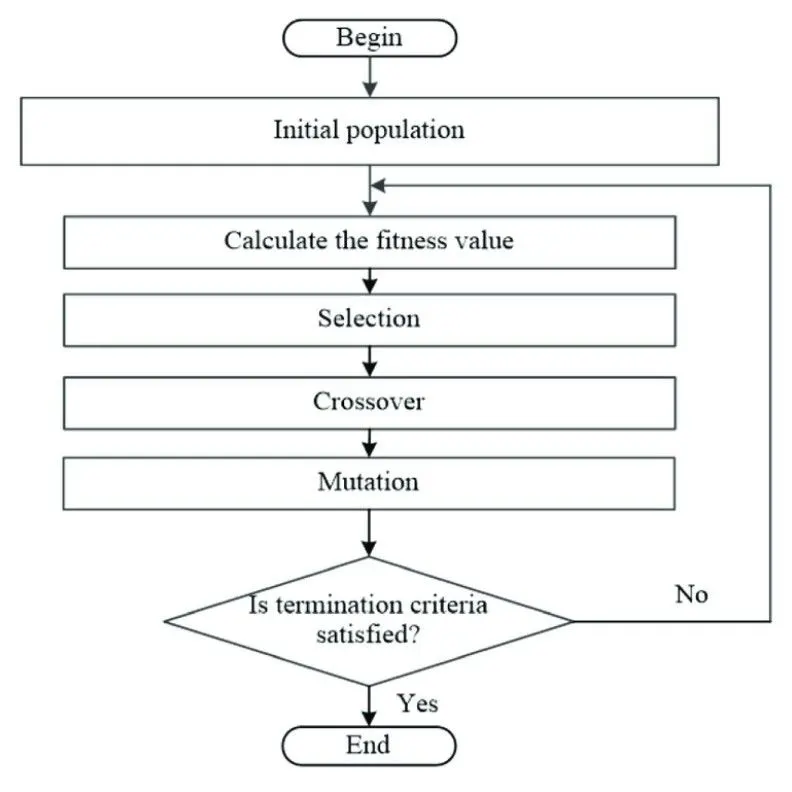
Initial population
The initial population is generated randomly which later evolved to the optimum solution.
Calculate the fitness function
The best solution is selected for the next generation based on the fitness function, in our case our fitness function is given as
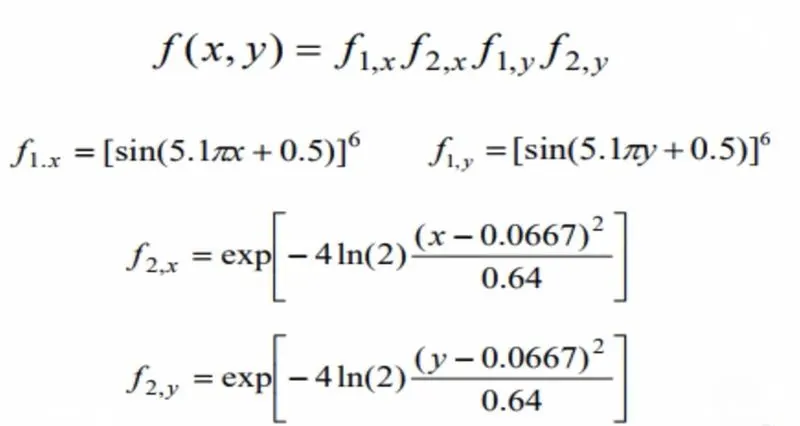
We simplified the above code below to use it in matlab as a function.
function [stalagmite]=stalagmite(input_vector)
x=input_vector(1)
y=input_vector(2)
f1_x=[sin(5.1*pi*x+0.5)]^6;
f1_y=[sin(5.1*pi*y+0.5)]^6;
f2_x=exp((-4*0.6931).*(x-0.00667)^2/(0.64));
f2_y=exp((-4*0.69310).*(y-0.00667)^2/(0.64));
stalagmite= (f1_x.*f2_x.*f1_y.*f2_y);
end
Selection
During each successive generation, a portion of the existing population is selected to breed a new generation. This selection of this best solution depends upon fitness function
Mutation
Mutation is used to maintain and introduce the diversity in the genetic population with small random tweaks in the previous solutions to create new better solutions.
Types of mutation operators.
- Bit Flip Mutation
- Random Resetting
- Swap Mutation
- Scramble Mutation
- Inversion Mutation
Crossover
- One point cross over
- Tow point cross over
- Uniform cross over
Termination criteria
Ga in the beginning is very fast creating better solution with each iteration but after some time he process become saturated in later stages where the improvement in solution is minimal and we need to stop the process at the point where the solution is very close to optimal.
Termination conditions are:-
- When no improvement In solution is observed for some iterations (pre-defined )
- When the absolute number of generations is reached
- Algo. terminated when the counter reaches the predetermined value.
Syntax we used for Ga
X=ga(fun,nvars,A,b,Aeq,beq,lb,ub,nonIcon,options)
|
X |
best point ga located during iteration |
|
Fun |
fitness function |
|
Nvars |
number of variables |
|
A |
Liner inequality constraints specified as a real matrix. |
|
b |
Liner inequality constraints specified as real vector. |
|
Aeq |
Liner Equality constraints specified as real matrix. |
|
beq |
Liner Equality constraints specified as real vector. |
|
lb |
Lower bound |
|
ub |
Upper bound |
|
nonIcon |
nonlcon is a function that accepts a vector or array x and returns two arrays, c(x) and ceq(x). |
|
Options |
Options created using optimoptions or an options structure. |
BODY OF CODE
Creating the fitness function to find the global maxima.
function code
negative sign used to find the maxima, because by default in matlab GA finds the minima only.
MAIN BODY OF THE CODE (CODE TO PLOT GA)
Creating the 3d space with use of meshgrid command to find the GA the maxima and minima in that range.
clear all
close all
clc % clear all close all and clc to clear older data

x=linspace(0,0.6,150); %creating the search space for the ga in between it plot the graph
y=linspace(0,0.6,150);

[xx,yy]=meshgrid(x,y);% creating meshgrid for 3 dimensionl plot
for i=1:length(xx); % nested for loop for processing each valu of xx and yy at a time
    for j=1:length(yy);
        input_vector(1)=xx(i,j); % defining the cordinates for ploting the graph and this cordinates will be used in stalagmite as a input
        input_vector(2)=yy(i,j);
        f(i,j) = stalagmite(input_vector);% calling the stalagmite function.
    end
end
surf(xx,yy,f); %creating the 3D graph
shading interp % command to remove the mesh line from the graph
xlabel('X axis')
ylabel('Y axis')
zlabel('Globel maxima/Minima ')
Out put of the above code
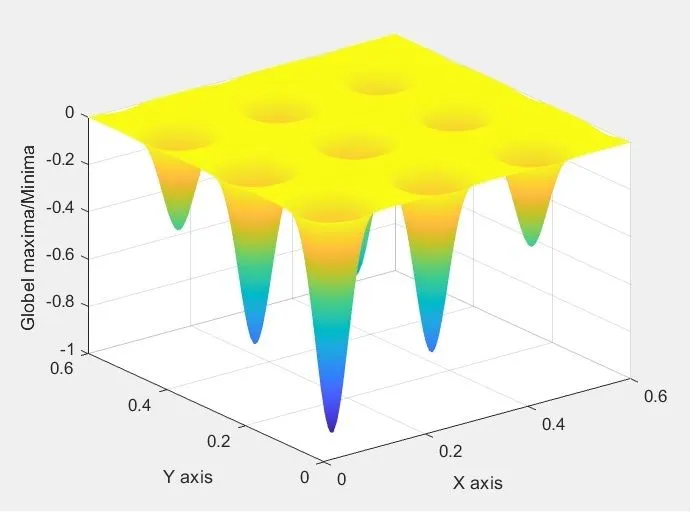
Genetic algoritm study 1
Defining the number of itiration for the genetic alogrithm
clear all
close all
clc % clear all close all and clc to clear older data

x=linspace(0,0.6,150); %creating the search space for the ga in between it plot the graph
y=linspace(0,0.6,150);

[xx,yy]=meshgrid(x,y);% creating meshgrid for 3 dimensionl plot
for i=1:length(xx); % nested for loop for processing each valu of xx and yy at a time
    for j=1:length(yy);
        input_vector(1)=xx(i,j); % defining the cordinates for ploting the graph and this cordinates will be used in stalagmite as a input
        input_vector(2)=yy(i,j);
        f(i,j) = stalagmite(input_vector);% calling the stalagmite function.
    end
end
num_cases=50% defining the number of itiration
tic  %tic and toc command to find the study solving time
for k=1:num_cases;  %for loop for solving the each value for 50 itiration
    [input,fopt(k)]=ga(@stalagmite,2);
    xopt(k)=input(1)
    yopt(k)=input(2)
end
surf(xx,yy,f);% ploting the 3D graph
shading interp %remove mesh line from the graph
study_time=toc %record the study time
figure(1) %figure 1
subplot(2,1,1)%creating subplot on figure
hold on% hold the previous graph
surfc(x,y,f)%creating the graph
shading interp
plot3(xopt,yopt,fopt,'marker','o','markersize',5) %ploting the 3D graph
title('unbounded value')% title
xlabel('X axis')% defining axis
ylabel('Y axis')
zlabel('Globel maxima/Minima ')
subplot(2,1,2)
plot(fopt)% ploting 2d plot for number of itirations and findings of maxima
xlabel('Iteration')
ylabel('Function Maximum')
Graphical results of the above study.
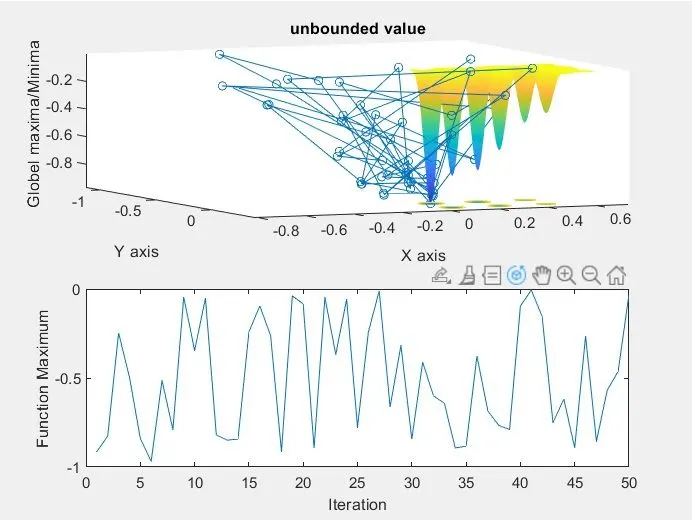
time taken for the study is 34 sec
Genetic algoritm study 2
Reason for this Study 2
Despite of defining the search the values of maxima and minima is out of the search space so we need to limit the area by applying the limits to the search areas .
Bounding the area of search for GA by the use of uppr bound and lower bound
Code for the bounded GA
clear all
close all
clc % clear all close all and clc to clear older data

x=linspace(0,0.6,150); %creating the search space for the ga in between it plot the graph
y=linspace(0,0.6,150);

[xx,yy]=meshgrid(x,y);% creating meshgrid for 3 dimensionl plot
for i=1:length(xx); % nested for loop for processing each valu of xx and yy at a time
    for j=1:length(yy);
        input_vector(1)=xx(i,j); % defining the cordinates for ploting the graph and this cordinates will be used in stalagmite as a input
        input_vector(2)=yy(i,j);
        f(i,j) = stalagmite(input_vector);% calling the stalagmite function.
    end
end
num_cases=50% defining the number of itiration
tic  %tic and toc command to find the study solving time

for k=1:num_cases;%for loop for solving the each value for 50 itiration
    [input,fopt(k)]=ga(@stalagmite,2,[],[],[],[],[0;0],[1;1]); % bounding the upper limits and lower limits for GA search
    xopt(k)=input(1)
    yopt(k)=input(2)% optimum falues of X and Y
end
surf(xx,yy,f);% ploting the 3D graph
shading interp %remove mesh line from the graph
study_time=toc %record the study time
figure(1) %figure 1
subplot(2,1,1)%creating subplot on figure
hold on% hold the previous graph
surfc(x,y,f)%creating the graph
shading interp
plot3(xopt,yopt,fopt,'marker','o','markersize',5) %ploting the 3D graph
title('Bounded value')% title
xlabel('X axis')% defining axis
ylabel('Y axis')
zlabel('Globel maxima/Minima ')
subplot(2,1,2)
plot(fopt)% ploting 2d plot for number of itirations and findings of maxima
xlabel('Iteration')
ylabel('Function Maximum')
Graphical results of the above code.
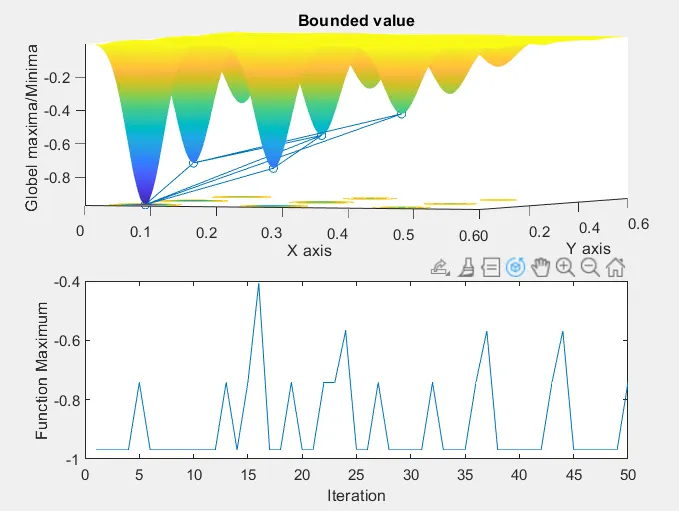
time taken by the study 52 sec
Conclusion for this study
limiting the search area provides more optimized solution
Genetic algoritm study 3
Reason for this Study 3
we need more optimized solution for which we are increasing the population size
clear all
close all
clc % clear all close all and clc to clear older data

x=linspace(0,0.6,150); %creating the search space for the ga in between it plot the graph
y=linspace(0,0.6,150);

[xx,yy]=meshgrid(x,y);% creating meshgrid for 3 dimensionl plot
for i=1:length(xx); % nested for loop for processing each valu of xx and yy at a time
    for j=1:length(yy);
        input_vector(1)=xx(i,j); % defining the cordinates for ploting the graph and this cordinates will be used in stalagmite as a input
        input_vector(2)=yy(i,j);
        f(i,j) = stalagmite(input_vector);% calling the stalagmite function.
    end
end
num_cases=50% defining the number of itiration
tic  %tic and toc command to find the study solving time
options=optimoptions('ga')
options=optimoptions(options,'populationsize',200);% increasing the population size

tic
for k=1:num_cases;%for loop for solving the each value for 50 itiration
    [input,fopt(k)]=ga(@stalagmite,2,[],[],[],[],[0;0],[1;1],[],[],options);% syntax for increasing the size of population
    xopt(k)=input(1)% optimum falues of X and Y
    yopt(k)=input(2)
end
surf(xx,yy,f);% ploting the 3D graph
shading interp %remove mesh line from the graph
study_time=toc %record the study time
figure(1) %figure 1
subplot(2,1,1)%creating subplot on figure
hold on% hold the previous graph
surfc(x,y,f)%creating the graph
shading interp
plot3(xopt,yopt,fopt,'marker','o','markersize',5) %ploting the 3D graph
title('Bounded value')% title
xlabel('X axis')% defining axis
ylabel('Y axis')
zlabel('Globel maxima/Minima ')
subplot(2,1,2)
plot(fopt)% ploting 2d plot for number of itirations and findings of maxima
xlabel('Iteration')
ylabel('Function Maximum')
Graphical results of study 3
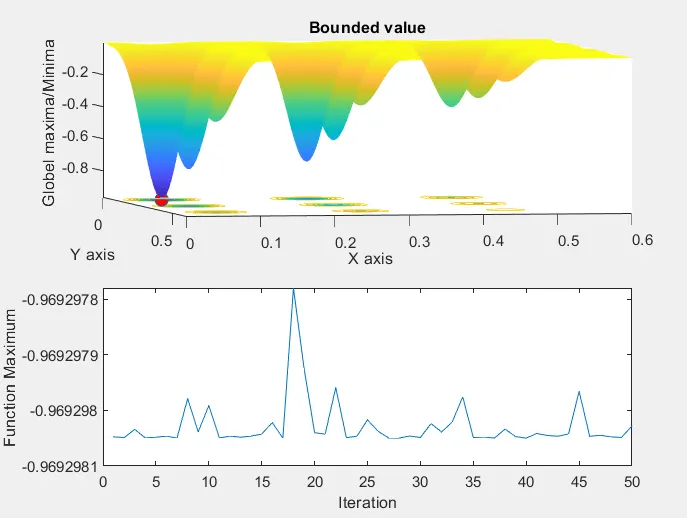
time taken in the study is 160 sec
Errors
encounters only a few typo errors and other than this every thing worked fine.
CONCLUSION
1. With the increase in population size, we have got a much-optimized study, global maxima.
2. Above code gives same output, even if it run several times.
REFERENCES:
https://www.tutorialspoint.com/genetic_algorithms/index.htm