Week 4.1 - Genetic Algorithm
Aim :- Create a program in Matlab to Optimise the stalagmite function and find the global maxima or peak of the function, and expalin the concept of genetic algorithm, syntax and plot graphs for all 3 studies.
Object :- Get the optimum value and understand the concept of GA (Genetic Algorithm) and with the help of ga find the global maxima and plot 3 diffurent study of ganetic algorithm.
Procedure :- First we have to understand the optimization and understand the stalagamite function and create the stalagamite function and create main code and then execut different GA types and get the plot for each.
Formula :-
- f1=(sin(5.1*pi*x+0.5))^6;
- f2=exp(-4*log(2)*(((x-0.0667)^2)/0.64));
- f3=(sin(5.1*pi*y+0.5))^6;
- f4=exp(-4*log(2)*(((y-0.0667)^2)/0.64));
f=-(f1*f2*f3*f4);
or
f= -(((sin(5.1*pi*x+0.5))^6)*(exp(-4*log(2)*(((x-0.0667)^2)/0.64)))*((sin(5.1*pi*y+0.5))^6)*(exp(-4*log(2)*(((y-0.0667)^2)/0.64))));
Flow Or Algo:-
- Defined input Space.
- Scripting the objective Function (creation of Stalagmite function).
- performed for 3 case's.
Explanation :-
- First we have to know how optimization work, Optimization is the study of area which deals how to minimize or maximize the perticular operation in depend on some input parameters, so we used stalagamite function to performed this operaion stalagamite function is help to find local minima's and maxima's.
- To get the minimum value or minimum peak here the GA genetic algorithm will help which is depend up on evaluation theory created by charles and this ga is in inbuilt function in matlab which help to performed this operations.
- So we start the code first we create 1D array for x and y and form this we create 2D array xx and yy by used of mesh grid then for each value of x and y we create an input vector or row vector having two column of x and for y and storing the value of x(i j) and y(i j) then we create function.
- This function name is stalagmite this geting the input form vectors and performanig the operation in function stalagmite and stored the value in f(i j) in main code.
- In stalagmite function we get input x and y and create equation and calculate this and get output in f and this function is used in the nested for loop and get output f(i j) in main code.
- So this nested for loof or 2 loop is used to generate data to get 3D plot. we used -f in stalagmite function to get maximum negative peak as we know that ga provide minimum peak value so we get deep minimun peak which we get maximum peak by providing - negative sign. This for loop create the peakes
- We create stalagmite function in term form means we collect all term in final formula.It is the test function used to validate the performance characteristics of the optimization algorithms.
- So we moved upon the GA, optimization algorithms is contain population algorithms its mean's its maintain the entire set of candidates solution and each solution create an unique point and the search space of problem known as population based algorithm, and this will repeapt for serval time.
- In this process they create new generation form older generation there child is in this form 1) Elite child having individual best fit. 2) Crossover child created by combination of parent. 3) Mutation child single parent create random changes in its own. this types of child take part in GA.
- This flow explain the working of genetic algorithm.
- Initialization of the population randomnes.
- Calculate the fitneess function with fitness approach (Selection Crossover Mutation)
- Finding optimum solution
- Terminate alogorithm
- There are 3 Types in this.
- Unbounded GA study
- Bounded GA study
- Bounded GA study with population size
- So in this Unbounded GA study there is upper and lower boundry is not defined, so there is high chances for getting inaccurate results, but in Bounded GA the lower and upper boundry are defined in x 0 lower boundry and y 0.4 upper boundry this give the better result as compair,
- In the Bounded GA with population size the population size denotes the no of data points initialised in that space the default population size for GA solver is 50 population size is increase by increasing population no by adding option in ga syntax.
- We increased the population size until we get single optimum point or single maximum peak, incresed in population size inceased in simulation time. The optimoptions is used to define the population size.
- There is also topic of stopping criteria of GA which means its geting stop at which its get maximum optimization of stalagmit function, there are 1)Max Generations its means algorithm stop when the number no of generation is reaches to max, 2) Max Time in this algo stop after running for serval time amount in seconds, 3) Fitness Limits the algo stop when the value of fitness function is in the best point in the current population is less than the fitness limit mens get maximum fit compared to population size.
- In this code or cases here we get plot's, for unbounded, bounded and bounded with population, With the peak points.
Code 1:- Main code For GA(Genetic Algorithm).
clear all
close all
clc

%input given
x=linspace(0,0.6,150); %get 150 value in between 0 to 0.6
y=linspace(0,0.6,150); %creating 1d array

%create 2D mesh
[xx,yy]=meshgrid(x, y); %create 2D array and used meshgrid commmand and put 1d array as a input which is x and y and we get output in xx and yy

for i=1:length(xx)     %we create nesteed for loop to create graph or plot having local minima and global maxima, and we used 2 for loop for finding xx and yy in term of i,j and plot them.
    for j=1:length(yy)
        input_vector(1)=xx(i,j); %creating array which is a row vector contaning two column which contain x value and y value.
        input_vector(2)=yy(i,j);
        f(i,j)=stalagmite(input_vector); %used of created function stalagmite which get input as a input_vector and provide output in f.
    end
end

%performing GA(Genetic Algorithm)
tic %for calculating the time taken to performed this operation
%case1 Unbounded GA Study   (in unbounded type there is no boundary thats why they seen outside the graph also)
for z=1:50  %run the function 1 to 50 times to get meximum perfect output or optimized output.
    [inputs,fopt_1(z)]=ga(@stalagmite,2); %we get output as in term of iputs and fopt_1(z) and 'ga' GA(Genetic Algorithm) is the inbuilt function in matlab which help to find local minimum values and help to optimimum values and then we passing two inputs is stalagmit function which having 2 variables which we pased as an input in stalagmit function.
    xopt_1(z)=inputs(1); %get inputs in two form and stored in xopt and yopt used in ploting.
    yopt_1(z)=inputs(2);
end
case1_time=toc; %show the time taken to performed the action.

figure(1) %create new figure for plot unbounded GA study
subplot(2,1,1) %create subplot to get 2 representation in 1 figure window
surfc(xx,yy,-f); %used to plot 3d furface to visuilise
hold on;
grid on;
shading interp; %used shading comand to get much more shoother chart.
plot3(xopt_1,yopt_1,-fopt_1,'marker','*','markersize',5,'color','r') %plot the xopt yopt and -fopt_1 to get maximum  output or get the peek.
subplot(2,1,2)
plot(-fopt_1); %get plot for fopt to read maximum value of fopt.
title('Unbounded GA');
xlabel('X Axis');
ylabel('Y Axis');


%case 2 Bounded GA Study (in Bounded type there is boundary so they seen inside side the graph and also show acurate result in this we seen 3 maximum peek)

for z=1:50 %run the function 1 to 50 times to get meximum perfect output or optimized output in the boundry limit so its get the maximum accurate output.
    [inputs,fopt_2(z)]=ga(@stalagmite,2,[],[],[],[],[0;0],[0.4;0.4]);%we get output as in term of inputs and fopt_2 (z) and 'ga' GA(Genetic Algorithm) is the inbuilt function in matlab which help to find local minimum values and help to optimimum values and then we passing two inputs is stalagmit function which having 2 variables which we passed as an input in stalagmit function after that we pass the boundry limit form 0 to 0.4 in x and y term.
    xopt_2(z)=inputs(1); %get inputs in two form and stored in xopt and yopt used in ploting.
    yopt_2(z)=inputs(2);

end

figure(2) %create new figure for plot Bounded GA study
subplot(2,1,1)
surfc(xx,yy,-f);
hold on;
grid on;
shading interp;
plot3(xopt_2,yopt_2,-fopt_2,'marker','*','markersize',5,'color','r') %plot the xopt yopt and -fopt_2 to get maximum  output or get the peek.
subplot(2,1,2)
plot(-fopt_2); %get plot for fopt to read maximum value of fopt in between the range so this show optimum result.
title('Bounded GA');
xlabel('X Axis');
ylabel('Y Axis');

%case 3 Bounded with Population size (in Bounded with Population size type there is boundary so they seen inside the graph and also with population which help to show accurte or optimum value, we seen 1 maximum peek.

options = optimoptions('ga'); %optimoptions command will be used to define the population size.
options = optimoptions(options,'PopulationSize',270); %increased the population size until the single optimum point is achived.

for z=1:50 %run the function 1 to 50 times to get meximum perfect output or optimized output in the boundry limit so its get the maximum accurate output and also increased the sized of population which help to get one single output.
    [inputs,fopt_3(z)]=ga(@stalagmite,2,[],[],[],[],[0;0],[0.4;0.4],[],[],options); %we get output as in term of inputs and fopt_3 (z) and 'ga' GA(Genetic Algorithm) is the inbuilt function in matlab which help to find local minimum values and help to optimimum values and then we passing two inputs is stalagmit function which having 2 variables which we passed as an input in stalagmit function after that we pass the boundry limit form 0 to 0.4 in x and y term after that we give the option which help to get optimum value by increasing the population value i used 270 and get a maximum peek point.
    xopt_3(z)=inputs(1);%get inputs in two form and stored in xopt and yopt used in ploting.
    yopt_3(z)=inputs(2);
end

figure(3) %create new figure for plot Bounded GA study with Population size
subplot(2,1,1)
surfc(xx,yy,-f);
hold on;
grid on;
shading interp;
plot3(xopt_3,yopt_3,-fopt_3,'marker','*','markersize',5,'color','r') %plot the xopt yopt and -fopt_3 to get maximum  output or get the maximum peek.
subplot(2,1,2)
plot(fopt_3);  %get plot for fopt_3 to read maximum value of fopt in between the range so this show optimum result.
title('Bounded GA with Population Size');
xlabel('X Axis');
ylabel('Y Axis');
Code 2:- Stalagmite Function Code.
%stalagmite function is mathematical model which help to findthe local minima and maxima
function f = stalagmite(input_vector) %create a function name stalagmite having input as a input vector
x = input_vector(1); %get input in x form and y form main function
y = input_vector(2);

f1=(sin(5.1*pi*x+0.5))^6; %writing formula in 4 parts
f2=exp(-4*log(2)*(((x-0.0667)^2)/0.64));
f3=(sin(5.1*pi*y+0.5))^6;
f4=exp(-4*log(2)*(((y-0.0667)^2)/0.64));
f=-(f1*f2*f3*f4); %puting all term in formulas and create final formula base up on the equation we create this formula.
%we used - to get maximum peek value by inversing the graph or plot.
end
note :- Both the code are save in same folder.
CASE 1:-

In this there is no boundary we used stalagmite function and 2 is used for the variable which use, and this give output in inputs and fopt this xopt get values in inputs(1) and yopt in inputs(2), and this will performed for 50 literation which is default and this same concept is used in boht bounded and bounded with population also but adding some boundary value and parameters and function.
CASE 2:-

In this we used boundary range from 0 to 0.4 for x,y and this remain brackets are used for function and parameters.
CASE 3:-
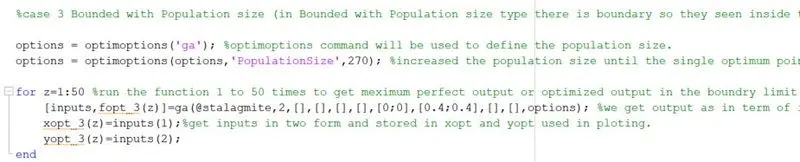
In this we used upper and lower boundry, the size the population denotes the no of data points initialised in that space the default population size for GA solver is 50 population size is increase by increasing population no by adding option in ga syntax. We increased the population size until we get single optimum point or single maximum peak, incresed in population size inceased in simulation time. The optimoptions is used to define the population size in this i used 270
Here we get 3 plot, for unbounded, bounded and bounded with population. With the peak points.
Case 1 :- Plot of Unbounded GA Study.
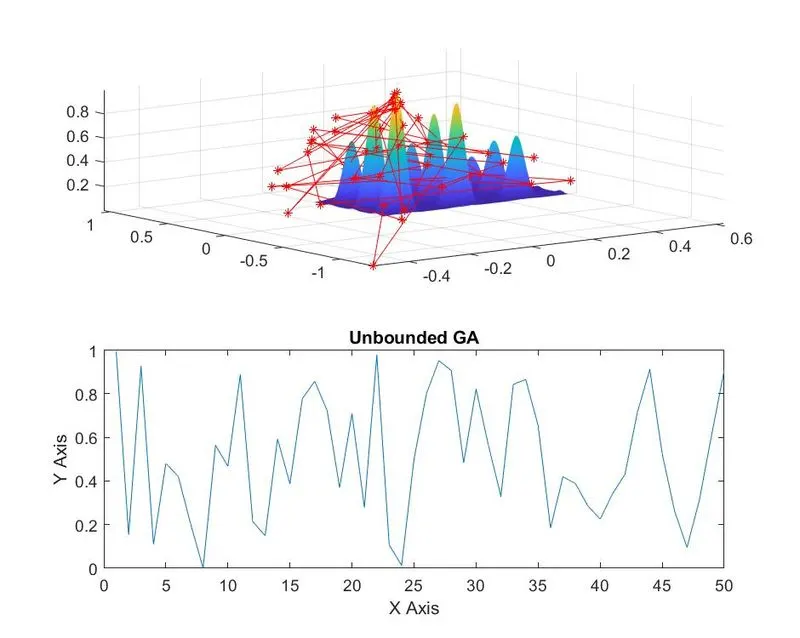
In this case 1 of Unbounded GA study you see the red points are also outside the plot and showing inaccurate result, this is becaused of we do not defined the boundary for this so its also get value outside the plot as shown in plot.
Case 2 :- Plot of Bounded GA Study.
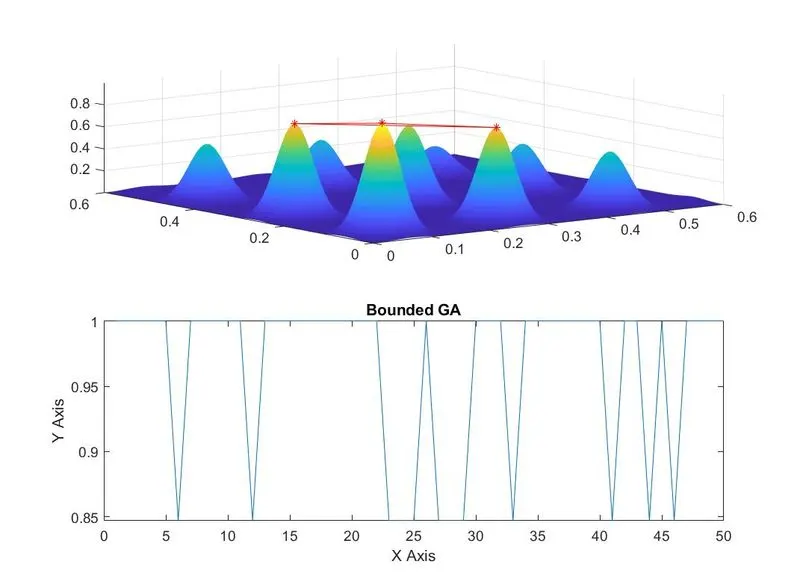
In this case 2 of Bounded GA study you see the red points are on the top of the plot and and in this boundary limit and giving accurate result in 3 peak point, this is becaused of we defined the boundary for this so its give value inside the plot as shown in plot having 3 peak point.
Case 3 :-Plot of Bounded with Population size GA Study.
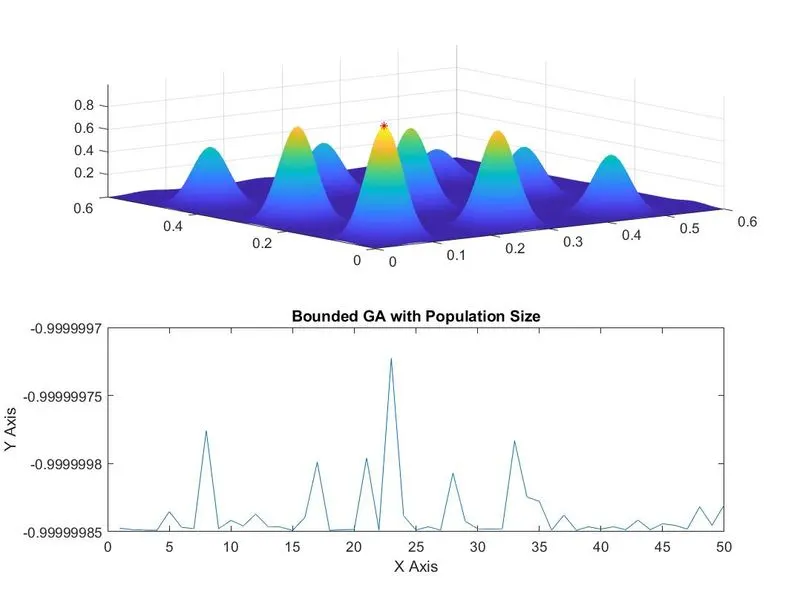
In this case 3 of Bounded GA with population study you see the red point are on the top of the plot and and in this boundary limit with the population size of 270 which giving accurate result in only 1 peak point, this is becaused of we defined the boundary and also give increased population size for this so its give only one value on the top of the plot as shown in plot having 1 maximum peak point.
This we get the study of all GA types and get all plots for various condition.
Result:-We create a program to get optimum the stalagmit function and get global maximum output. This all the graph or plot show with it's maximum peak points. In unbounded its not showing accurate result and in bounded it show accurate but with 3 peak value and in the last bounded with population its shows only one maximum peak value its give accurate result.
Reference :- https://skill-lync.com/knowledgebase/genetic-algorithm-explained