Project 1 - Parsing NASA thermodynamic data
Aim :- Create a program in Matlab that extracts all 14 co-efficients and calculates the enthalpy, entropy and specific heats and calculate the molecular weight and plot the Specific heats, Enthalpy and Entropy with local temperature which is specific unique for all species and save the plots as images with Species names and save them in separate folders for each species with suitable species name and All these should be generated automatically for all 53 species which is given in data 'THERMO.dat'. This have to don for all 53 and get all plot in all folders with calculate the molecular weight of each species and output display it in the command window.
Object :- Upon this file NASA thermodynamic data or 'THERMO.dat' we have to calculate Specific heats, Enthalpy and Entropy with Local temperature and plot all 3 figure and molecular weight and this will performed automatic and only geting data form file and give output.
Procedure :- First we have to understand the Flow or code and upon that we have to understand which concept will work for this, then we lode the data and get the data from file like Temp, co-efficient, and seprated the data as per convenient and then calculate CP-(Specific heats), H-(Enthalpy), S-(Entropy) and the put this with Temperature and get 3 plot (CP / TEMP), ( H / TEMP),( S / TEMP), and calculate molecular weight and this all performed for each species means for all 53 spcies.
Formula :-
- Cp / R = al + a2 T + a3 1^2 + a4 T^3 + a5 T^4
- H / RT = a1 + a2 I /2 D a3 T^2 /3 + a4 T^3 /4 + a5 T^4 /5 + a6/T
- S / R = al InT + a2 T + a3 T^2 /2 + a4 T3 /3 + a5 I*4 /4 + a7
OR
same for Low and also same for High 1-7 coefficients are High temperature coefficients and the 8-14 coefficients are Low temperature coefficients.
High temperature rate (htr)
- CP2= (a1 + (a2*T) + (a3*T.^2) + (a4*T.^3) + (a5 * T.^4)) * R;
- H 2= (a1 + (a2 * (T/2)) + (a3 * ((T.^2) /3)) + (a4 * ((T.^3) /4)) + (a5 * ((T.^4) /5)) + (a6./T)) *R .* T;
- S 2= (a1* log(T) + (a2 * T) + (a3 * ((T.^2) /2)) + (a4 * ((T.^3) /3))+ (a5 * ((T.^4) /4)) + a7) .* R;
Low temperature rate (ltr)
- CP1=(a8 + (a9 * L) + (a10 * L.^2) + (a11 * L.^3) + (a12 * L.^4)) * R;
- H 1 =(a8 + (a9 * (L/2)) + (a10 * ((L.^2) /3)) + (a11 * ((L.^3) /4)) + (a12 * ((L.^4) /5)) + (a13./L)) * R .* L;
- S 1 =(a8 * log(L) + (a9 * L) + (a10 * ((L.^2) /2)) + (a11 * ((L.^3) /3)) + (a12 * ((L.^4) /4)) + a14) .* R;
Flow Or Algo :-
- Lode the data and store it
- Extracting Local Temperatur
- Extract all 14 co-efficients
- Seperate the temperature
- Calculation for CP-(Specific heats), H-(Enthalpy), S-(Entropy) with the formula
- Getting CP-(Specific heats), H-(Enthalpy), S-(Entropy), Temp-(Temperature) for plotting
- Plotting all 3 Plot
- Calculate the molecular weight
- Make automatic for all 53 species.
Explanation :- First we have to understand the concept and flow or code and upon that we write a code for file passing and upon this data we calculate and extracts all 14 co-efficients and calculates the enthalpy, entropy and specific heats and calculate the molecular weight and plot the Specific heats, Enthalpy and Entropy with local temperature which is specific and unique for all species and save the plots as images with species name folder and perforned this for all 53 species by using loop 1 to 53. So this is code and explane in below.
Code :- Code for passing NASA thermodynamic data.
close all
clear all
clc
%read the file:-
f=fopen('THERMO.dat','r'); %fopen is inbuilt command open the file data and read it and lode it (note:- File must be save in same folder and having proper name as the File name and r is for reading command)

for g=1:5 %we give the loop of 5 ilteration which skip the 5 line because fgetl is give new line and data was read from top to bottom so we dont need the 1st 5 line so we skip by the loop.
    fgetl(f); % get the new line this in inbuilt command.
end

%%
%extracting Local Temperature;-

for j=1:53 %After reading the whole code this line or for loop is created to for all species stored in the data which is 53 so its run for 53 times


b = fgetl(f); %getting the new line and stored in b to performed next operation.
a = strsplit(b , ' '); % strsplit is inbuilt somand used to split the string of b where the ' ' - space occurred.

species_name = a{1}; %Storing the string index 1 of a in species _name to get species name

low_temp = str2num (a{end-3});  %getting Local temperature from same line or a with the help of indexing and store as low temp.
high_temp = str2num( a{end-2}); %same for High temp and also for mid temp and this local temp is unique for every species.
mid_temp = str2num( a{end-1});

%%
%extract all 14 co-efficients:-

%                   Line 1
coeff_1=fgetl(f); %getting new line having co-efficients value from f data and store this line in coeff_1.
pos_1=strfind(coeff_1 ,'E'); %finding position of E in coeff_1 of line because E is comman term in data coefficient to tract it and get the all 14 coefficient.

%for a 1-5 in 1ist of line
a1 = str2num (coeff_1(1 : pos_1(1)+3)); %getting coefficient 1 stored in the line coeff_1 with the help of range operator and indexing the position of E and add 3 for getting value in 1 after the E so this give the value for coeff 1 or a1 stored in line Coeff_1.
a2 = str2num (coeff_1(pos_1(1)+4 : pos_1(2)+3)); %getting coefficient 2 stored in the line coeff_1 with the help of range operator and indexing the position of E and add 3 for getting value in 1 after the E so this give the value for coeff 2 or a2 stored in line Coeff_1n and pose E+4 give get the index after the 1 coeff end of index and after that index for coefficient 2 get start and in betwee we used range operator(:)upto E+3 means pose of E +3Index the end position of coefficient 2. and same for all 14 coeff on each 5 in a single line.
a3 = str2num (coeff_1(pos_1(2)+4 : pos_1(3)+3)); %same for all upto a5 because the data is in line coeff_1 and this line contain 1-5 coefficient.
a4 = str2num (coeff_1(pos_1(3)+4 : pos_1(4)+3));
a5 = str2num (coeff_1(pos_1(4)+4 : pos_1(5)+3));


%                   Line 2
coeff_2=fgetl(f); %Getting new line store in coeff_2
pos_2=strfind(coeff_1 ,'E'); %finding Poess of E same as upper case.

%for a 6-10 in 1ist of line
a6 = str2num (coeff_2(1 : pos_2(1)+3)); %getting all 6-10 coeff store in line Coeff_2 with help of index and position
a7 = str2num (coeff_2(pos_2(1)+4 : pos_2(2)+3)); %same as upper case.
a8 = str2num (coeff_2(pos_2(2)+4 : pos_2(3)+3));
a9 = str2num (coeff_2(pos_2(3)+4 : pos_2(4)+3));
a10= str2num (coeff_2(pos_2(4)+4 : pos_2(5)+3));


%                   Line 3
coeff_3=fgetl(f); %Getting new line store in coeff_3 and same process as upper case but in this there is only 4 coeff in this line total coeff is 14 so we calculate all 4 in this line.
pos_3=strfind(coeff_1 ,'E');

%for a 11-14 in 1ist of line
a11 = str2num (coeff_3(1 : pos_3(1)+3)); %same as upper case.
a12 = str2num (coeff_3(pos_3(1)+4 : pos_3(2)+3));
a13 = str2num (coeff_3(pos_3(2)+4 : pos_3(3)+3));
a14 = str2num (coeff_3(pos_3(3)+4 : pos_3(4)+3));

%%
%Temperature array creation :-
ct = 1;
T_Temp = linspace(low_temp,high_temp,500); % Getting 500 values of Temperature in between Low Temp to High Temp which is stored in upper line 22 & 23 and stored in vector T_Temp.

%sorting of temperature low and high.

    for i = 1:length(T_Temp)  % start of loop %create a loop form 1 to Length of T_temp for every 500 valued stored in T_Temp
        t = T_Temp(i);        %this store the value T_Temp (i) i is ilteration in 1:500 or 1:T_Temp by this indexing they give the value and this store in t.

        if(t=mid_temp)   %and else the upper conditon is not satisfied then else if run means(t>mid_temp) the storing t is greater tha mid_temp given in line 24 so next line will performed.
          T(ct)=t; %High Temp %And this t is Stored in T(ct) ct is used for indexing for t which is outside the loop ct=1 and this is keep increament and storing value directely to T having higher temp and L is directely to low Temp.
          ct=ct+1;            %used for increament the value of ct or update the value and for each ilteration and store the high temp to T.
        end                   %end of if else condition.
    end                       %end of loop.


%%
% T=htr (High Temperature Rate)
% L=ltr (Low Temperature Rate )
R=8.314;  %value of R (R is the universal gas constant)
%Calculate CP-(Specific heats), H-(Enthalpy), S-(Entropy):-

%calulation of CP, H, S (High Temperature Rate)
CP2=(a1+(a2*T)+(a3*T.^2)+(a4*T.^3)+(a5*T.^4))*R; %Given formula for CP2 means clculating for High temp rate.
H2 =(a1+(a2*(T/2))+(a3*((T.^2) /3))+(a4*((T.^3) /4))+(a5*((T.^4) /5))+(a6./T))*R.*T; %Given formula for CP2 means clculating for High temp rate.
S2 =(a1*log(T)+ (a2*T) +(a3*((T.^2) /2))+(a4*((T.^3) /3))+ (a5*((T.^4) /4))+ a7).*R; %Given formula for CP2 means clculating for High temp rate.

%calulation of CP, H, S (Low Temperature Rate)
CP1=(a8+(a9*L)+(a10*L.^2)+(a11*L.^3)+(a12*L.^4))*R;  %Given formula for CP1 means clculating for Low temp rate.
H1 =(a8+(a9*(L/2))+(a10*((L.^2) /3))+(a11*((L.^3) /4))+(a12*((L.^4) /5))+(a13./L))*R.*L; %Given formula for H1 means clculating for Low temp rate.
S1 =(a8*log(L)+ (a9*L) +(a10*((L.^2) /2))+(a11*((L.^3) /3))+ (a12*((L.^4) /4))+ a14).*R; %Given formula for S1 means clculating for Low temp rate.

%getting H, CP, S, Temp, for plotting graph.
%Getting CP-(Specific heats), H-(Enthalpy), S-(Entropy), Temp-(Temperature)

CP = [CP1, CP2];     %(Low Cp , High cp)
H = [H1, H2];        %(Low H , High H)
S = [S1, S2];        %(Low S , High S)
Temp = [L, T];       %(Low Temp , High Temp)

%creating a folder:-
mkdir(['C:\Users\USER\Desktop\species\',species_name]); %mkdir is inbulit command used to create new folder as name stored in Species name in the given directories and this create folders for all 53 species becaused we give loop.
cd(['C:\Users\USER\Desktop\species\',species_name]); %changes the current folder to newFolder and save all the plot here so that why we used this inbulit command.

%plotting:-

%Ploting Temperature v/s Specific Heat (Temp/CP).
figure(1)%creating fig
plot(Temp ,CP ,'linewidth',2,'color','b') %ploting command
title(species_name,'CP / TEMP'); %title command
xlabel('Local Temperature'); %labeling X,Y
ylabel('Specific Heat');
saveas(figure(1),'Specific Heat.jpg'); %save figure 1 as jpg in the species_name folder created by mkdir fn and cd redirect to that location and store the figure in it, and this is same for all fig2 sand 3.having given name.


%Ploting Temperature v/s Enthalpy (Temp/H).
figure(2) %same process as fig1
plot(Temp,H ,'linewidth',2,'color','r')
title(species_name,'H / TEMP');
xlabel('Local Temperature');
ylabel('Enthalpy');
saveas(figure(2),'Enthalpy.jpg');


%Ploting Temperature v/s Entropy (Temp/S).
figure(3)%same process as fig1
plot(Temp ,S ,'linewidth',2,'color','y')
title(species_name,'S / TEMP');
xlabel('Local Temperature');
ylabel('Entropy');
saveas(figure(3),'Entropy.jpg');

%%
%creating program to calculate the molecular weight of each species.
mole_element = ['C','H','O','N','A']; %Creating string array or vector storing the string or character which is commaly in data up on that element are created.
atomic_weight =  [12, 1, 16, 14, 40]; %Molicular weight or mass of atom as a element wise.
mol_mass = 0;   %Initial mol_mass
for l = 1:length(species_name) %creating loop for 1 to length of species_name eg(CH2) means 1:3
    for m = 1:length(atomic_weight) %2nd loop from 1:5 or 1:length of atomic_weight
        if strcmp (species_name(l),mole_element(m)) %if string compared (strcmp inbulit command ) so this go forward and calculate molecular weight. This compared all element of index(l) to all mole_element (m) having m index to try match all element and if the matched then they go to next line.
           mol_mass = mol_mass + atomic_weight(m); %updateing:- adding mol_mass + atomic_weight and update the mole_mass and keep adding all molecular weight of all element, and this (m) help to get match indexing ilteration moleculate weight becaused the no is same and position is also same due to storing in element wises. so providing atomic weight due to indexing same no.
           position = m;  %storint the position m in positon if ussed in nest case or for no like ch2 (2)this.
        end

    end %end of loop m getting all character element value stored in mol_mass
    n = str2num(species_name(l)); %is there is any no so next conditon is run and this will cheek by str2num command to convert string to number.
    if n>1 %if n is greater than 1 this will run.
        mol_mass=mol_mass + atomic_weight(position)*(n-1); %adding atomic value by multiply value or previous or element before the no and update value to mol_mass.
    end
end %end of loop l which run for each elem  ents.
sprintf('Molecular Weight of %s:- %d u or g/mol.',species_name, mol_mass ) %printing the species name (%s data type for string or character) and moleculare weight(%d used to denote num data type or for integers) stored in mol_mass and print the statement whith the help of sprintf inbulit command.

%This is done for single species for all 53 species calculation on same
%formate we create a loop for whole concept on line 14 j=1:53.
end % after all done this loop is used for all geting all 53 species. This give all 53 species calculation and getting all species folde and 3 plot for each individual species in it. %end the loop.
- First we have to read the file and lode it to performed the task and this file should save in same folder and having proper name as the file name in 'THERMO.dat' fopen is inbuilt command open the file data and read it and lode it.
- After file lode we skip the 5 line because fgetl is give new line and data was read from top to bottom so we dont need the 1st 5 line so we skip by using for loop. fgetl is give the new line this in inbuilt command in matlab.
- Then we extracting Local Temperature form file and store it to performed next operation.
- Now we split this line with the help of strsplit is inbuilt command used to split the string which we stored ' ' - by blank space.
- Storing the string index 1 of a in species _name to get species name.
- Then getting Local temperature from same line or a with the help of indexing and store as low , high , mid temp.
- Now we extract all 14 co-efficients so we getting new line having co-efficients value from data file and store this line in new variabe. Then finding position of E in the stored line because E is comman term in data file to tract it and get the all 14 coefficient. strfind is command used to find element in any data its an inbuilt comand.
- Now we getting coefficient 1 which is stored in the line with the help of range operator and indexing the position of E and add +3 for getting value in 1 after the E so this give the value for co-efficient 1 or a1 stored in line Coeff_1, and str2num is inbuilt function help to convert string to integer, now we store coefficient 2 for getting coefficient 2 stored in the same line, getting coeff 2 with the help of range operator and indexing the position of E and add 3 for getting value in 1 after the E so this give the value for coeff 2 or a2 stored in line Coeff_1 and pose E+4 give get the index after the 1 coeff end of index and after that index for coefficient 2 get start and in betwee we used range operator(:)upto E+3 means pose of E +3 Index the end position of coefficient 2
- This process is same for getting all 14 coefficient form data file on each 5 in a single line. this is same for all upto a5 because the data is in line coeff_1 and this line contain 1-5 coefficient, and same for next line and get next coeff a6-a10 and then next line a11-a14, so this type we get all 14 coefficient eg(Getting new line 2 store in coeff_2 then finding Poess of E same as explained).
- Now we temperature array and create 500 values in between low and high temp by linspace(low_temp,high_temp,500)
- Now we do the sorting of temperature low and high using loop and giving statements or condition of greater and smaller by using if else, here we get Low temp:- L=ltr (Low Temperature Rate ) and High temp.:- T=htr (High Temperature Rate) .
- R=8.314 (R is the universal gas constant)Then we Calculate CP-(Specific heats), H-(Enthalpy), S-(Entropy) with the help or formula as mention above,
- High temperature rate (htr) formula
- CP2= (a1 + (a2*T) + (a3*T.^2) + (a4*T.^3) + (a5 * T.^4)) * R;
- H 2= (a1 + (a2 * (T/2)) + (a3 * ((T.^2) /3)) + (a4 * ((T.^3) /4)) + (a5 * ((T.^4) /5)) + (a6./T)) *R .* T;
- S 2= (a1* log(T) + (a2 * T) + (a3 * ((T.^2) /2)) + (a4 * ((T.^3) /3))+ (a5 * ((T.^4) /4)) + a7) .* R;
- Low temperature rate (ltr) formula
- CP1=(a8 + (a9 * L) + (a10 * L.^2) + (a11 * L.^3) + (a12 * L.^4)) * R;
- H 1 =(a8 + (a9 * (L/2)) + (a10 * ((L.^2) /3)) + (a11 * ((L.^3) /4)) + (a12 * ((L.^4) /5)) + (a13./L)) * R .* L;
- S 1 =(a8 * log(L) + (a9 * L) + (a10 * ((L.^2) /2)) + (a11 * ((L.^3) /3)) + (a12 * ((L.^4) /4)) + a14) .* R;
- Put all this in form of CP, H, S, Temp which is easy in plot and get accurate result.
CP = [CP1, CP2] (Low Cp , High cp)
H = [H1, H2]; %(Low H , High H)
S = [S1, S2]; %(Low S , High S)
Temp = [L, T]; %(Low Temp , High Temp)
- Now we creating a folder with the help of mkdir which is inbuilt command which is used to create new folder as name stored as Species name in the given directories and this create folders for all 53 species becaused we give loop to whole code.
- Here we used cd to changes the directior or current folder to newFolder and save all the plot here so that why we used this inbulit command.
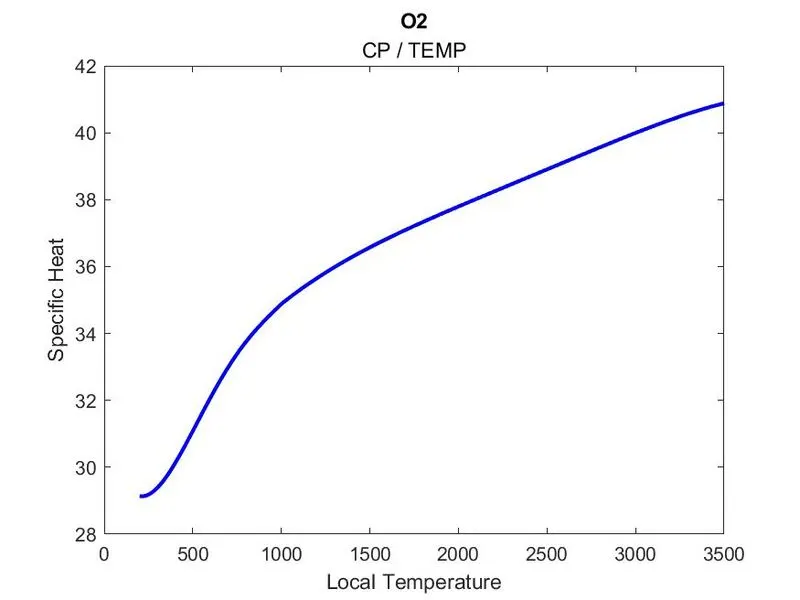
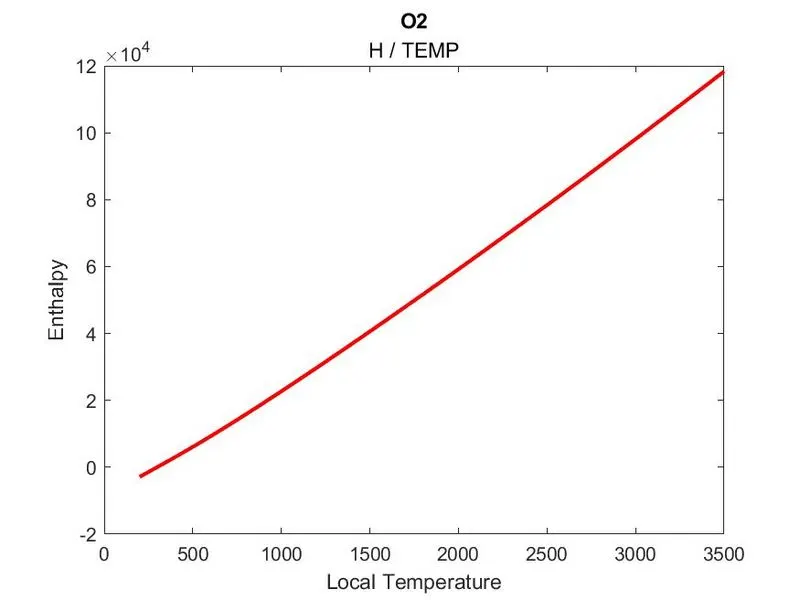
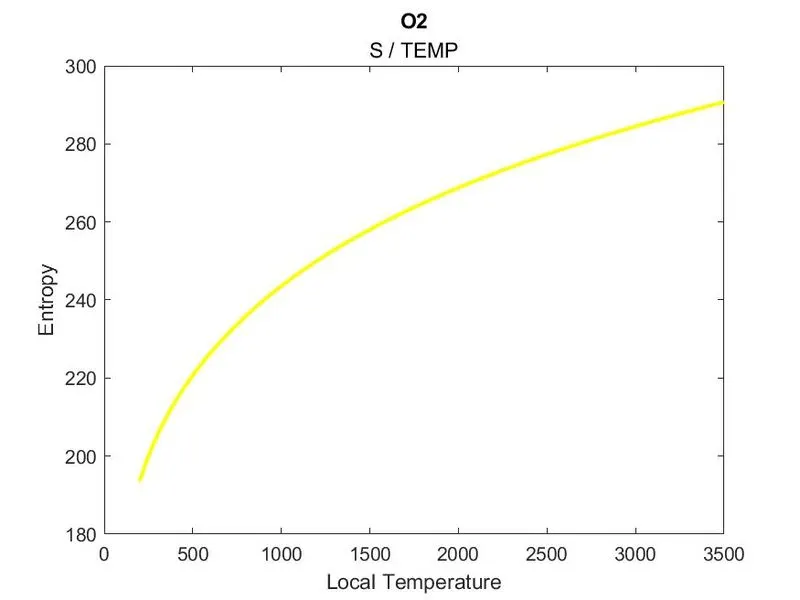
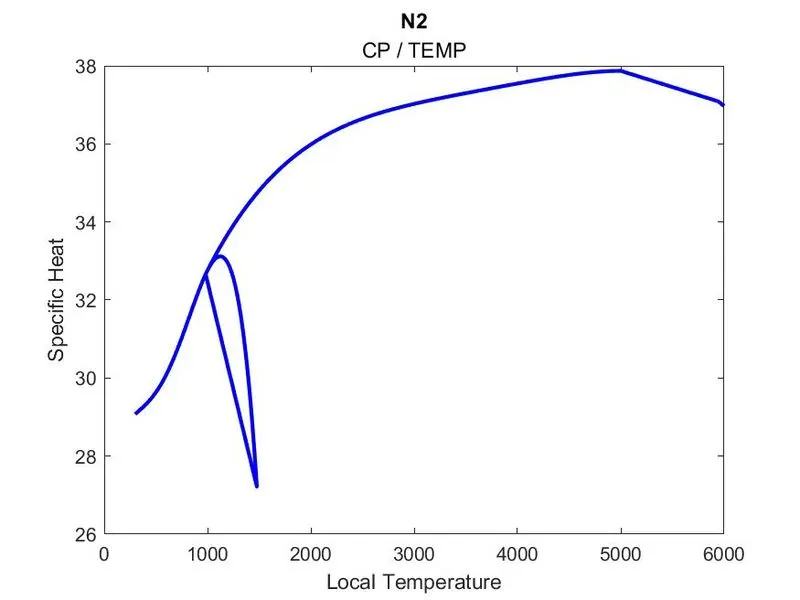
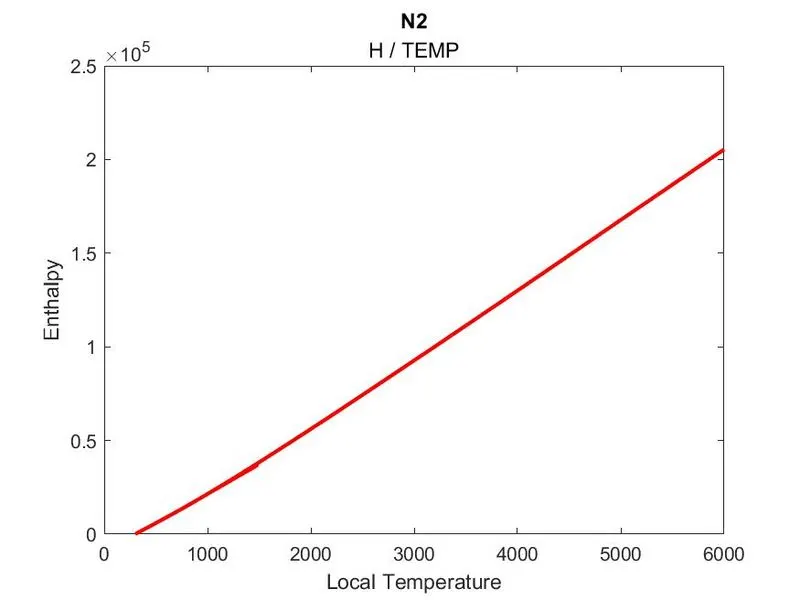
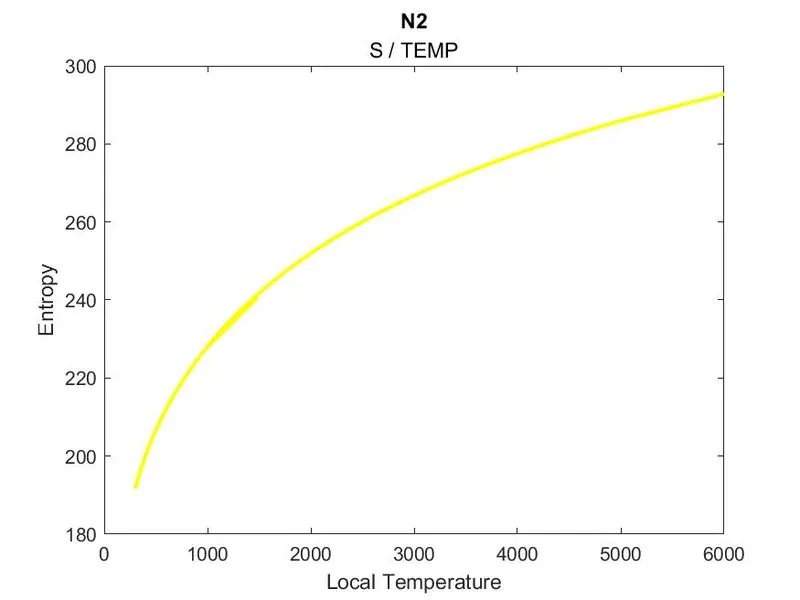
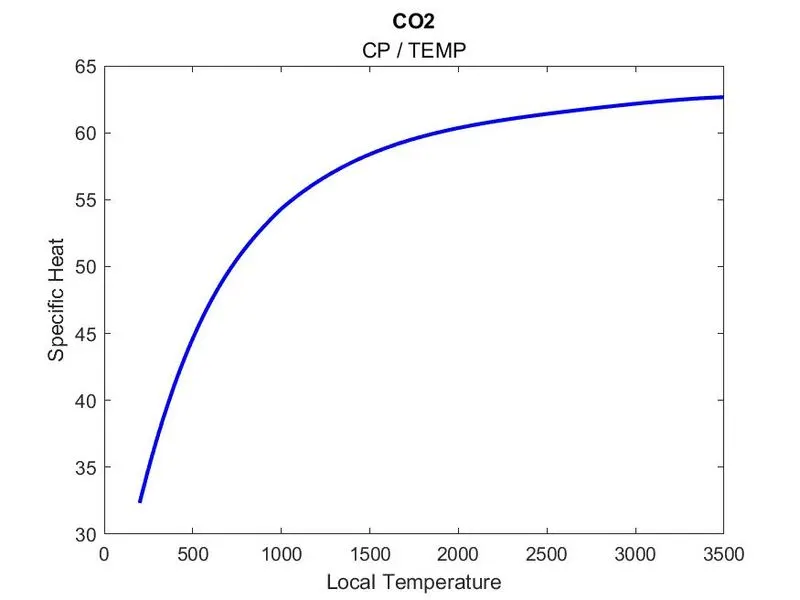
- Now we plotting all the values with Temperature v/s Specific Heat (Temp/CP), Temperature v/s Enthalpy (Temp/H), Temperature v/s Entropy (Temp/S), usinf plot command and figure getting all 3 plot with all label and title and save it as jpg in the species_name folder created by mkdir command and cd redirect to that location and store the figure in it, and this is same for all fig2 sand 3 with there given name.
- After plotting we remain molecular weight so we creating program to calculate the molecular weight of each species so we have to creating string array or vector storing the string or character which is commaly used in data up on that element are created which is (C , H, O, N, A) and also create molicular weight or mass of atom as a element wise[12, 1, 16, 14, 40] Initially we mol_mass is 0.
- We used for loop for this molecular weight we run the loop from 1:length(species_name) eg(CH2) means 1:3 , In that we create one more loop for m from 1 to length(atomic_weight) means [12, 1, 16, 14, 40] this 2nd loop is from 1:5.
- And in that we give condition is if strcmp (species_name(l),mole_element(m)) means species name is same as compare to mol element so they go forward and calculate molecular weight and run the code in next line. Strcmp this compared all element of index(l) to all mole_element (m) having m index to try match all element and if the matched then they go to next line, strcmp is an inbulit command.
- Then in next line we updateing the value by adding mol_mass to atomic_weight and update the mole_mass and keep adding all molecular weight for all element, and this (m) help to get match indexing ilteration moleculate weight becaused the no is same and position is also same due to storing in element wises, so providing atomic weight due to indexing same no.
- And in next situation if no is occure so we stored the position of m in position which ussed in next case or for number in like CH2 for this 2 we run another if statement condition. before that we have to convert this in to number and store this humber in n by using str2num in species name if there is any no then run the next case if there is any no so next conditon is given and if the conditon satisfied the it move forward, the nest condition is if n is greater than 1 they move forward.
- So now we adding mole mass old value to atomic value by multiply value or previous value or element before the number and this element number is multiply by (n-1) and then added to mole mass and then update value to mol_mass.
- Then after getting mol_mass or molecular weight we used sprintf command and used %s for string which is in species name and%d for mol_mass in integers and print the species name and moleculare weight and print the statement whith the help of sprintf which is inbulit command.
- Now this is done for single species and dor automatic but to create for all 1 to 53 species we have to put for loop for j =1: 53 species and all calculation code is same for all 53. This last loop is used for all geting all 53 species calculation, plots, and all plots are saved in all specific folders, and getting molecular weight for all species.
Attachment of Result :-
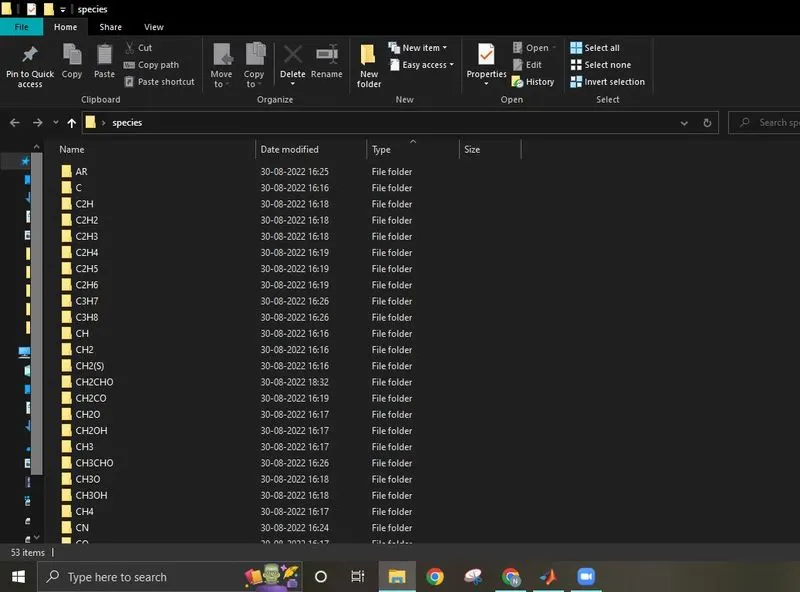
Screenshot of the window where all the specis folders are saved:-
2) Plots for O2, N2 and CO2 species :-
O2 :-
1) Specific Heat:-
2) Enthalpy:-
3) Entropy:-
N2 :-
1) Specific Heat:-
2) Enthalpy:-
3) Entropy:-
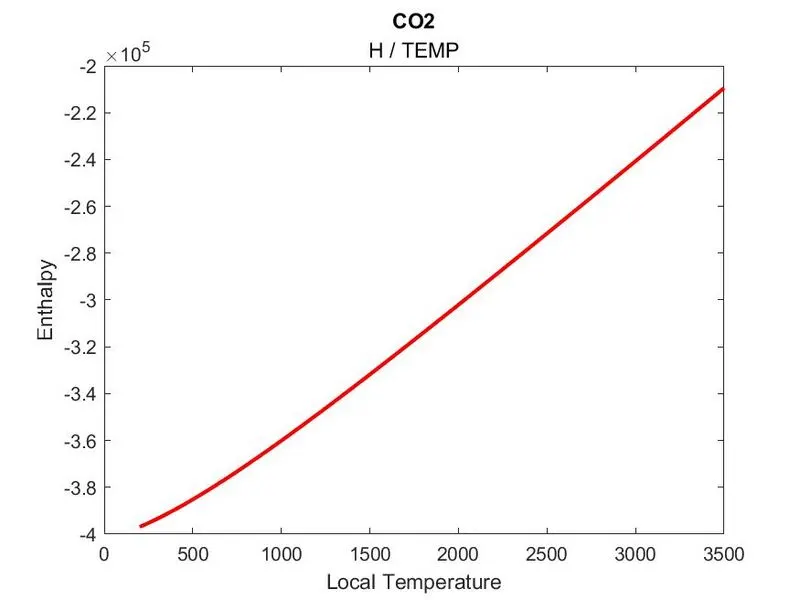
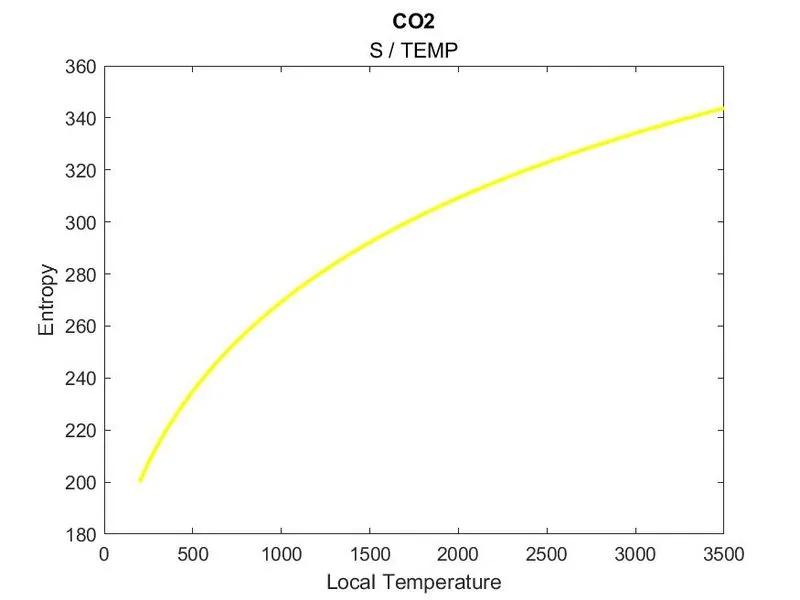
CO2 :-
1) Specific Heat:-
2) Enthalpy:-
3) Entropy:-
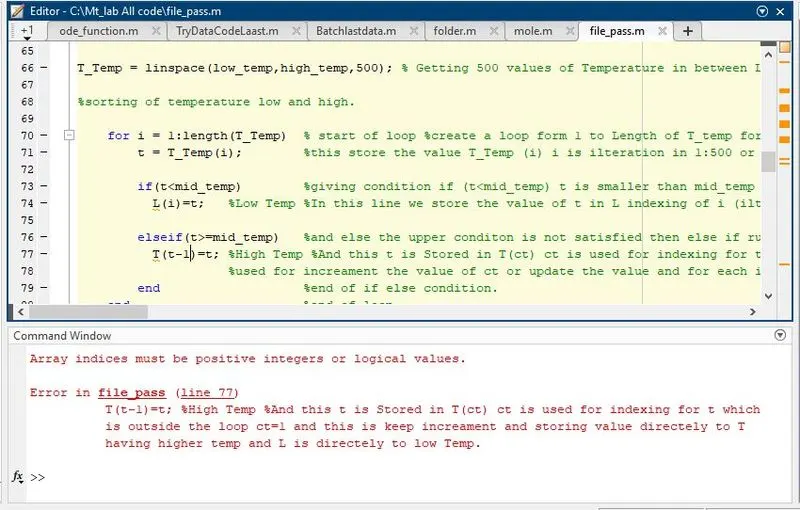
Error :- This error was appered while code this Program, to solve this error I booked O3 and they help me in plotting the graph and and for this error I get help from Gopinat sir and they help me solve this error.
Solution of Error :-
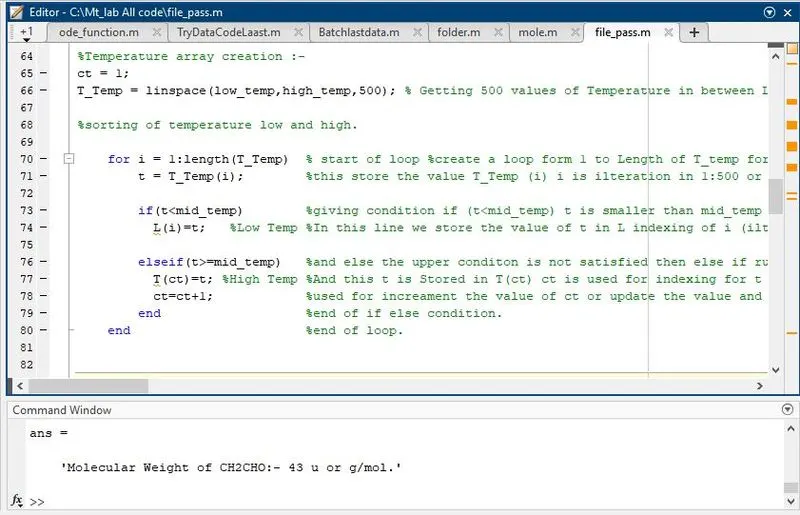
Here we put ct = 1 and get updating it and updating index of T and store High Temp in T(ct) ct is used for indexing and also updating its self.
Result:- This give all 53 species calculation and getting all species folder and saved all 3 plot for each individual species in individual folder in same directiory and also get molecular weight for each 53 species.