Week 4.1 - Genetic Algorithm
GENETIC ALGORITHEM
AIM:
- Write a code in MATLAB to optimize the stalagmite function and find the global maxima of the function.
OBJECTIVE:
- Write a code in MATLAB to optimize the stalagmite function and find the global maxima of the function.
- Clearly explain the concept of genetic algorithm in your own words and also explain the syntax for ga in MATLAB in your report.
- Make sure that your code gives the same output, even if it is made to run several times.
- Plot graphs for all 3 studies and for F maximum vs no. of iterations. Title and axes labels are a must, legends could be shown if necessary.
GENETIC ALGORITHEM:
A genetic algorithm is a search heuristic that is inspired by Charles Darwin's theory of natural evolution. This algorithm reflects the process of natural selection where the fittest individuals are selected for reproduction in order to produce offspring of the next generation.
STALAGMITE FUNCTION:
A stalagmite function generally refers to the function with which we are generating values over a stalagmite kind of surface for finding out the local and global maxima and minima of that particular given function. 3. For this in Matlab we are using a method called 'Optimization'.
FUNCTION:
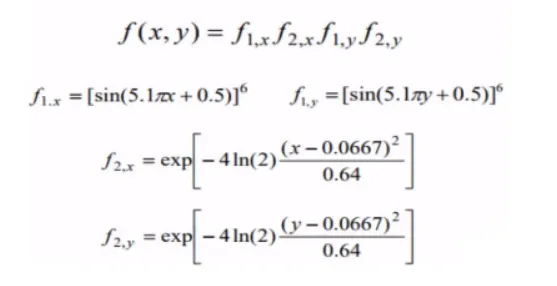
function [f1]=stalagmite_fun(inputs)
x=inputs(1);
y=inputs(2);
t1=sin(((5.1)*pi*x)+(0.5));
t2=sin(((5.1)*pi*y)+(0.5));
t3=exp(-4*log(2)*((x-0.0667)^2)/(0.64));
t4=exp(-4*log(2)*((y-0.0667)^2)/(0.64));
f1=-(t1*t2*t3*t4);
end
MAIN CODE:
clear all
close all
clc
% searc space
x=linspace(0,0.6,150);
y=linspace(0,0.6,150);
no_cases=50;
%meshgrid
[xx yy]=meshgrid(x,y);
% Evaluating stalagmite function
for i=1:length(xx)
for j=1:length(yy)
inputs(1)=xx(i,j);
inputs(2)=yy(i,j);
f1(i,j)=stalagmite_fun(inputs);
end
end
surf(x,y,f1);
shading interp
% study-1:statistical behaviour unbounded
tic
for i=1:no_cases
[inputs2,fopt(i)]=ga(@stalagmite_fun,2)
xopt(i)=inputs2(1)
yopt(i)=inputs2(2)
end
time=toc
%ploting
figure(1)
subplot(2,1,1)
surfc(x,y,-f1)
hold on
shading interp
plot3(xopt,yopt,-fopt)
xlabel('x')
ylabel('y')
grid on
subplot(2,1,2)
plot(-fopt)
xlabel('iterations')
ylabel('function main value')
%STUDY-2 statistical behaviour bounded
for j=1:no_cases
[inputs2,fopt(j)]=ga(@stalagmite_fun,2,[],[],[],[],[0;0],[1;1])
xopt(j)=inputs(1)
yopt(j)=inputs(2)
end
time=toc
%ploting
figure(2)
subplot(1,2,1)
surfc(x,y,-f1)
hold on
shading interp
plot3(xopt,yopt,-fopt)
xlabel('x')
ylabel('y')
grid on
subplot(1,2,2)
plot(-fopt)
xlabel('iterations')
ylabel('function main value')
cases2=optimoptions('ga','PopulationSize',300)
%STUDY-3
for k=1:no_cases
[inputs2,fopt(k)]=ga(@stalagmite_fun,2,[],[],[],[],[0;0],[1;1],[],[],cases2)
xopt(k)=inputs(1)
yopt(k)=inputs(2)
end
time=toc
%ploting
figure(3)
subplot(2,1,1)
surfc(x,y,-f1)
hold on
shading interp
plot3(xopt,yopt,-fopt)
xlabel('x')
ylabel('y')
grid on
subplot(2,1,1)
plot(-fopt)
xlabel('iterations')
ylabel('function main value')
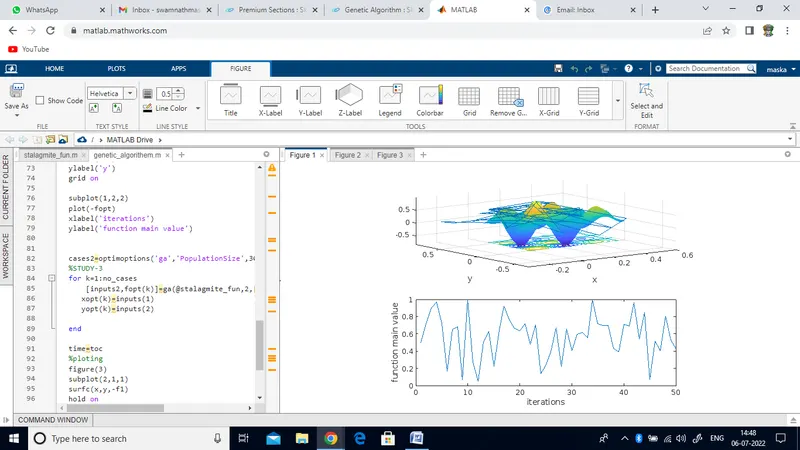
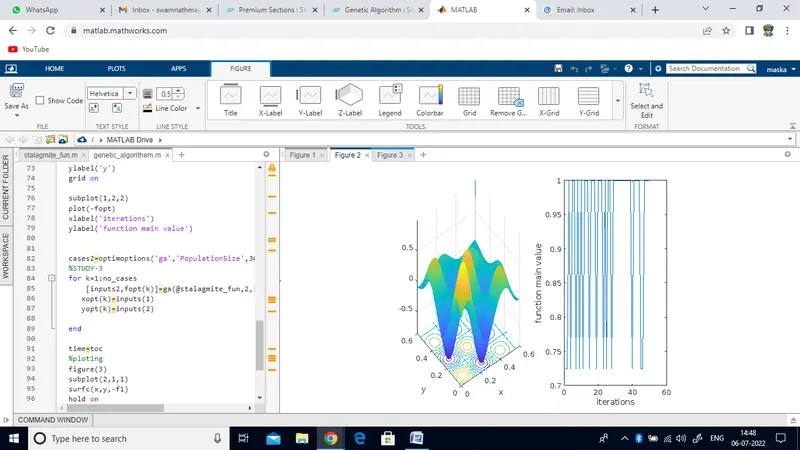
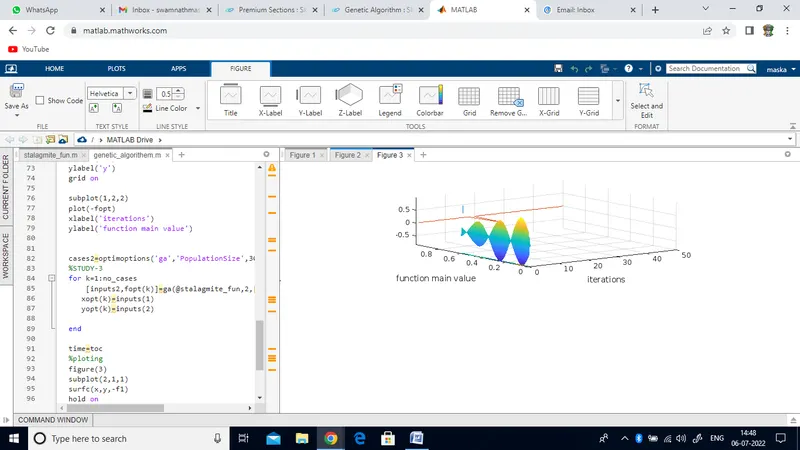
OUTPUTS:
figure(1)
figure(2)
FIGURE(3)
LINKS: