Week 3 - Solving second order ODEs
Aim- To solve second order equation differential equations using matlab programming
Equations-
dtheta1/dt=theta2
dtheta2/dt=(b/m)*theta2-(g/l)*sin(theta1)
Explain- ODE equation =d^2theta/dt^2+b/m dtheta/dt+g/l sintheta=0
theta=theta1
dtheta/dt=dtheta1/dt=theta2
d^2theta/dt^2=d^2theta1/dt^2=d/dt(dtheata1/dt)=dtheta2/dt
d^2theta/dt^2+b/m dtheta/dt+g/l+sintheta=0
d^2theta1/dt^2+b/m dtheta1/dt+g/l+sintheta1=0
dtheta2/dt+b/m *dtheta1/dt+g/l*sintheta1=0
dtheta1/dt=theta2
dtheta2/dt=-b/m*theta2-g/l*sintheta1
d/dt theta1 theta2=[theta2 -b/m*theta2-g/l*sintheta]
b=0.05(damping coefficient) ,l=length,m=mass,g=gravity
%intial condition
theta_0=[0;3] 0=distance traveling,3=velocity
%time points
t_span= time array
%solve ode
[t,results]=ode45(@(t,theta)ode_fun(t,theta,b,g,l,m),t_span,theta_0;
[t,results]=calculate distance column,velocity column
ode45=program name & inbuild solver in matlab
@(t,theta)=use for declaring array
ode_fun(t,theta,b,g,l,m)=use for calling function'ode fun' & input parameter
t_span=time array
theta_0=starting distance & starting velocity
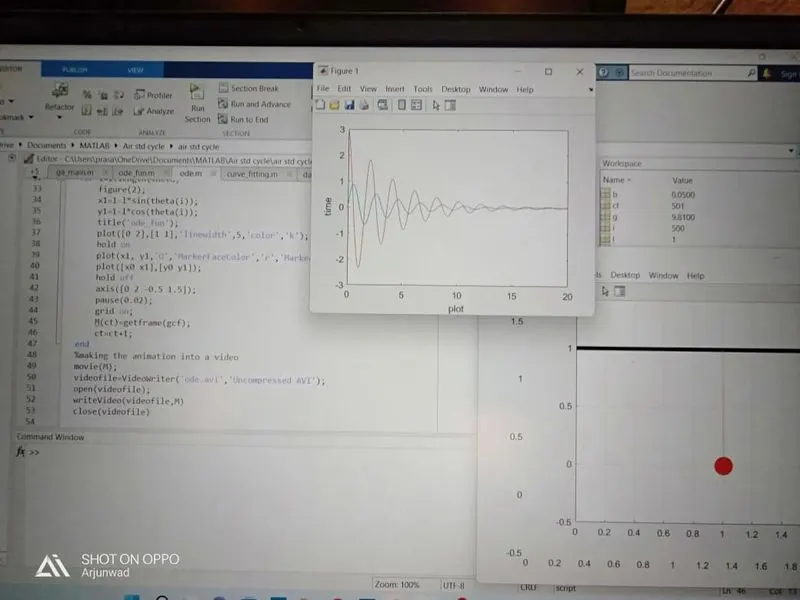
plot(t,results(:,1))=ploting only first displacement column of the results
plot(t,results(:,2))=ploting only second velocity column of the results
axis([0 20 -3 3])=it's command use for showing plotting graph view first two value for 'x' axis & remaining 'y' axis
creating animation of the pendulm
x0=1; y0=1; ct=1;
theta=results(:,1)it's shown theta=displacement column
for i=1:length(theta) it's command shows i contains a 500 values of the theta
x1=1-l*sin(theta(i)) x1 values determine angular moment of the pendulm which contains 'theta (i)' &'-' sign use for pendulm tilt on lower side
plot([0 2],[1 ],'linewidth',5,'color','b')=it's command shown fix line of the pendulm ,this line is provide a fix foundation to all over system
plot(x1,y1),'o','MarkerFaceColor','r','MarkerSize',20)=shows pendulm
MarkerFaceColor=hexadicimal code to filling color
'MarkerSize'=shows pendulm size
clear all
close all
clc

b=0.05;
l=1;
m=0.1;
g=9.81;


%intial condition
theta_0=[0;3];

%time points
t_span=linspace(0,20,500);

%solve ode
[t,results]=ode45(@(t,theta)ode_fun(t,theta,b,g,l,m),t_span,theta_0);

plot(t,results(:,1))
hold on
plot(t,results(:,2))

xlabel('plot')
ylabel('time')
axis([0 20 -3 3]);
hold off

%creating animation of the pendulm
x0=1;  y0=1; ct=1;
theta=results(:,1);
for i=1:length(theta)
    figure(2);
    x1=1-l*sin(theta(i));
    y1=1-l*cos(theta(i));
    title('ode_fun');
    plot([0 2],[1 1],'linewidth',5,'color','k');
    hold on
    plot(x1, y1,'O','MarkerFaceColor','r','MarkerSize',20)
    plot([x0 x1],[y0 y1]);
    hold off
    axis([0 2 -0.5 1.5]);
    pause(0.02);
    grid on;
    M(ct)=getframe(gcf);
    ct=ct+1;
end
%making the animation into a video
movie(M);
videofile=VideoWriter('ode.avi','Uncompressed AVI');
open(videofile);
writeVideo(videofile,M)
close(videofile)

   ode_fun
unction dtheta_dt=ode_fun(t,theta,b,g,l,m)

theta1=theta(1);
theta2=theta(2);
dtheta1_dt=theta2;
dtheta2_dt=-(b/m)*theta2-(g/l)*sin(theta1);

dtheta_dt=[dtheta1_dt;dtheta2_dt];
end 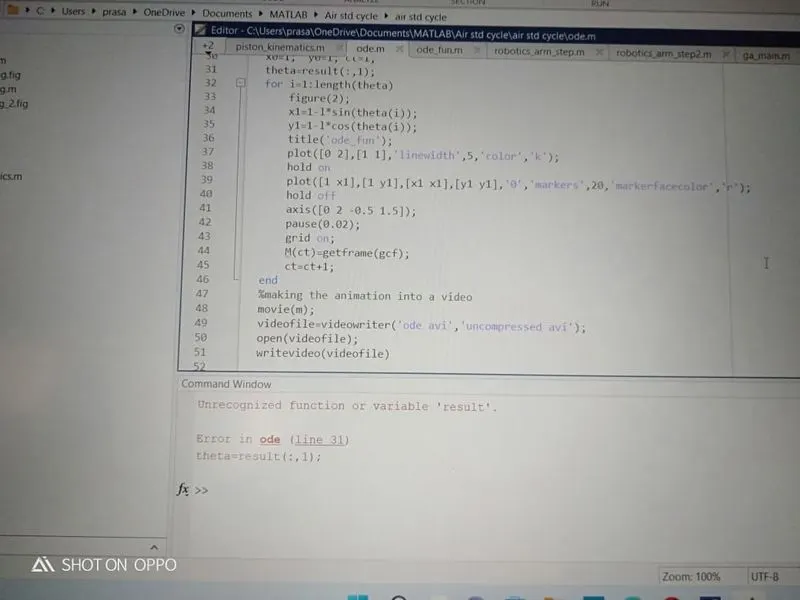
error-result spelling mistake & plotting is not proper for pendulm
solve-by correction spelling mistake result=results
plot(x1,y1),'o','MarkerFaceColor','r','MarkerSize',20)=shows pendulm
MarkerFaceColor=hexadicimal code to filling color
'MarkerSize'=shows pendulm size