
AIM-Write a function that extracts the 14 coefficents & calculates the enthalpy ,entropy,& specific heats for all the species in the data file
steps -Download NASA thermodynamic data
Cp/R=a1+a2T+a3T^2+a4T^3+a5T^4 Cp=specific heat R=gas constant
H/RT=a1+a2T/2+a3T^2/3+a4T^3/4+a5T^4/5+a6/T H=enthalpy R=gas constant T=temperture array
S/R=a1 Int + a2T+a3T^2/2 +a4T^3/3+a5T^4/4+a7 S=entropy R=gas constant
specific Heat=a1+a2T+a3T^2+a4T^3+a5T^4*R
Enthalpy=(a1+a2T/2+a3T^2/3+a4T^3/4+a5T^4/5+a6/T )R*T
Entropy=a1 Int + a2T+a3T^2/2 +a4T^3/3+a5T^4/4+a7*R
THERMO DATA
O L 1/90O 1 G 200.000 3500.000 1000.000 1
2.56942078E+00 -8.59741137E-05 4.19484589E-08 -1.00177799E-11 1.22833691E-15 2
2.92175791E+04 4.78433864E+00 3.16826710E+00 -3.27931884E-03 6.64306396E-06 3
-6.12806624E-09 2.11265971E-12 2.91222592E+04 2.05193346E+00
Parse reading structure nasa data .m
1)f1=fopen('THERMO.dat','r')
fopen=open file & obtain information
r=read the file
2)for i=1:5;
fgetl(f1); this loop used for only read first line
end
fgetl(f1)=f1=(fileId) Read line from file removing new line characters
3)for i=1:53 this process repeted for 53 times
4)a=fgetl(f1); read the line
6)b=strsplit(a,' '); split string line
specise name =b{1} b=splited string line
to find out temp range
low temp=str2double (b{end-3}) end =is line end of the temp range, str2double=convert strings to double precision value
7)species name=b{1}=this name use for molecules['H','C','N','O','A']
8)to find out temp range for
low temp=str2double(b{end-1});=is line end of the temp range,str2double=convert strings to double precision value
9)to find out maximum temp range for Maximum temp= str2double(b{end-2}); end =is line end of the temp range str2double=convert strings to double precision value
10)to find out medium temp =medium_temp=str2double(b{end-1});end =is line end of the temp range str2double=convert strings to double precision value
11)%create temp range T=linspace(low temp,maximum temp,1000) T=array created to showing diffrent temp range in ploting process ,lower temp value=200 ,maximum temp =3500 ,1000 values in between low temp to max temp
12)C=strsplit(line,' ')=this command use for split a string value into single string
13)C1=strfind (line,'E')this command use for find a location 'E' line no 1 E=location denoted under 'E'
%To find out coefficient position
14)a1=line1(c1(1)-10:c1(1)+3) line1 =operation performance on line no 1 C1(1) 'E' location value =11 -10 getting the first value location of coefficent C1(1)+3 ='E' location value +3 means last location value all over coefficents on line1,line2,line3 are find with this method
R=Universal gas constant value 8.134
we have first plotting for the specific heat and temperature then required specific heat values
Function=specific heat
14)function cp value =specific heat (a1,a2,a3,a4,a5,a8,a9,a10,a11,a12,T,R,medium_temp) T=temp array R=Universal gas constant
if(T<=medium_temp)= if Temp array less than medium temp value 1000 then performing a first formula
Cp_value=R*(a8+(a9*T)+(a10*(T.^2))+(a11*(T.^3))+(a12*(T.^4)));
else
if Temp array gratter than medium temp value 1000 then performing a Second formula
Cp_value=R*(a1+(a2*T)+(a3*(T.^2))+(a4*(T.^3))+(a5*(T.^4)));
end
end
Function=Entropy
Creating function for the entropy %parse reading structure nasa data for Entropy function
function S_value=entropy(a1,a2,a3,a4,a5,a6,a7,a8,a9,a10,a11,a14,T,R,medium temp)
If(T<=medium_temp)
if above condition is true then perform this condition
S_value=((a7.*log(T))+(a8.*T)+((a9.*(T.^2))/2)+((a10.*(T.^3))/3)+((a11.*(T.^4))/4)+a14)*R;
else
if the condition is fail then perform this equation
S_value=((a1.*log(T))+(a2.*T)+((a3.*(T.^2))/2)+((a4.*(T.^3))/3)+((a5.*(T.^4))/4)+a7)*R;
end
end
Function=enthalpy
function H_value =enthalpy (a1,a2,a3,a4,a5,a6,a8,a9,a10,a11,a12,a13,T,R,medium range)
If (T=>medium temp)
if above condition is true then perform this condition
H_value=(a8+(a9.*T/2)+(a10.*T.^2/3)+(a11.*T.^3/4)+(a12.*T.^5/5)+(a13./T))*R.*T;
else
if the condition is fail then perform this equation
H_value=(a1+(a2.*T/2)+(a3.*T.^2/3)+(a4.*T.^3/4)+(a5.*T.^5/5)+(a6./T))*R.*T;
end
end
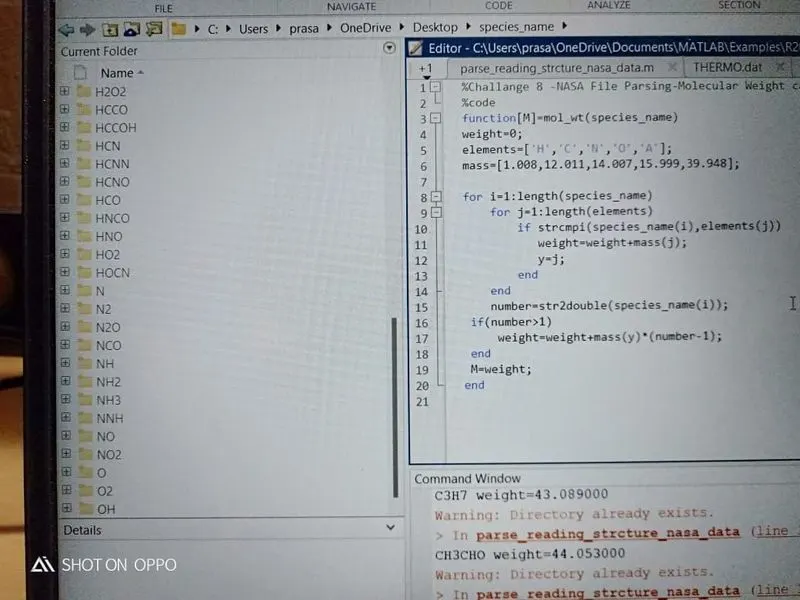
*Making function for the weight calculation of molecules
function=[M]=mol_wt(species_name
weight=0 =is a neutral condition
species name=AR,C,C2,H
elements=['H','C','N','O','A'];
mass=[1.008,12.011,14.007,15.999,39.948];
for i=1:length(species_name) 'i' is taking access of all species name
for j=1:length(elements) 'j'is taking access of all elements
if strcmpi(species_name(i),elements(j)) strcmpi=strcmpi(s1,s2) compares s1 and s2, ignoring any differences in letter case. The function returns 1 (true) if the two are identical and 0 (false) otherwise. Text is considered identical if the size and content of each are the same, aside from case. The return result tf is of data type logical.The input arguments can be any combination of string arrays, character vectors, and cell arrays of character vectors.
weight=weight+mass(j);
y=j;
end
end
number=str2double(species_name(i)); to convert the string value into species value
if(number>1)
weight=weight+mass(y)*(number-1);
end
M=weight;
end
%plotting
%temprature vs specific heat This plotting showing a value of temprature on 'x axis & value on specific heat on 'Y axis'
figure(1)
plot(T,Cp_value,'LineWidth',5,'Color','g') Created a plot between T=temperature & S_value =entropy
grid on
xlabel('temperature')
ylabel('specific Heat(j/k)')
title('Temperature vs Specific Heat ');
image=getframe(gcf); captures the figure identified by fig. Specify a figure if you want to capture the entire interior of the figure window, including the axes title, labels, and tick marks. The captured movie frame does not include the figure menu and tool bars.
gcf=Current figure handled
imwrite(image.cdata,'Temperature vs Cp.png') imwrite= writes image cdata to the file specified by 'Temperature vs Cp.png', inferring the file format from the extension. imwrite creates the new file in your current folder. The bit depth of the output image depends on the data type of A and the file format. For most formats:
plotting
%temprature vs entropy This plotting showing a value of temprature on 'x axis & value on entropy on 'Y axis'
figure(2)
plot(T,S_value,'LineWidth',5,'Color','g') Created a plot between T=temperature & S_value =entropy
grid on
xlabel('temperature')
ylabel('Entropy')
title('Temperature vs Entropy ');
image=getframe(gcf);
Captures the figure identified by fig. Specify a figure if you want to capture the entire interior of the figure window, including the axes title, labels, and tick marks. The captured movie frame does not include the figure menu and tool bars.
gcf=Current figure handled
imwrite(image.cdata,'Temperature vs S.png') imwrite= writes image cdata to the file specified by 'Temperature vs Cp.png', inferring the file format from the extension. imwrite creates the new file in your current folder. The bit depth
%plotting image depends on the data type of A and the file format. For most formats:
%plotting
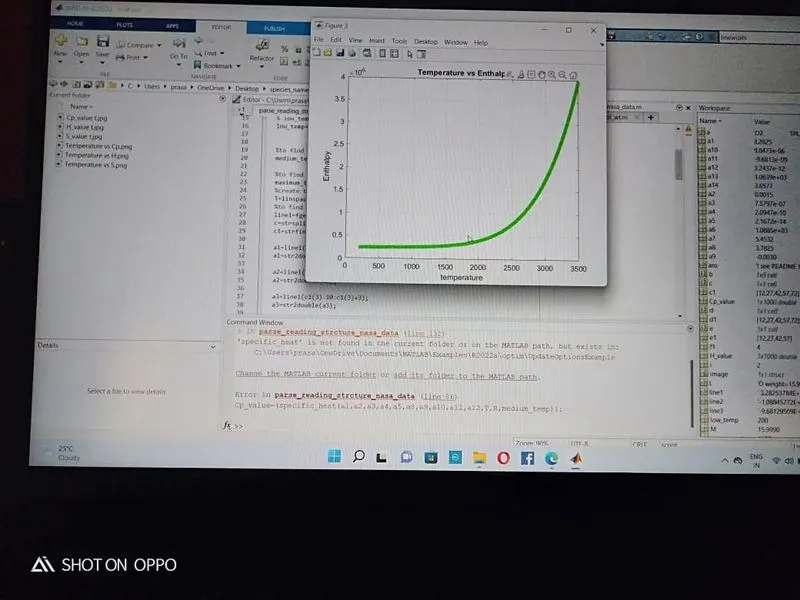
%temprature vs enthalpy This plotting showing a value of temprature on 'x axis & value on enthalpy on 'Y axis'
figure(3) figure= finds a figure in which the Number property is equal to n, and makes it the current figure. If no figure exists with that property value, MATLAB® creates a new figure and sets its Number property to
plot(T,H_value,'LineWidth',5,'Color','g') Created a plot between T=temperature & H_value =enthalpy 'linewidth'=5
grid on
xlabel('temperature')
ylabel('Enthalpy')
title('Temperature vs Enthalpy');
image=getframe(gcf); Captures the figure identified by fig. Specify a figure if you want to capture the entire interior of the figure window, including the axes title, labels, and tick marks. The captured movie frame does not include the figure menu and tool bars. gcf=Current figure handled
imwrite(image.cdata,'Temperature vs H.png')
imwrite= writes image cdata to the file specified by 'Temperature vs Cp.png', inferring the file format from the extension. imwrite creates the new file in your current folder. The bit depth image depends on the data type of A and the file format. For most formats:
M=mol_wt(species_name); Function calling
L=sprintf('%s weight=%f',species_name,M); sprintf=string printf is the formatspecifier. text convert in the string
disp(L) = displays the value of variable L without printing
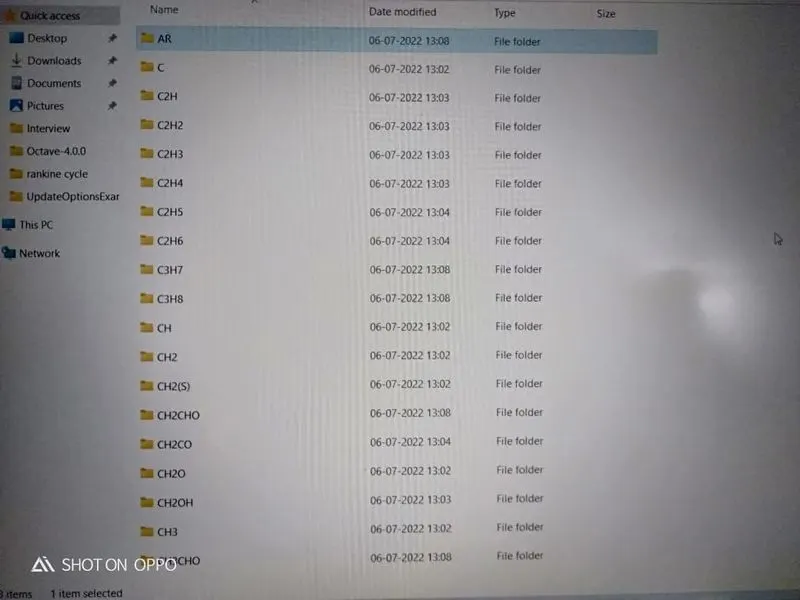
%creating folder
mkdir(['C:\Users\prasa\OneDrive\Desktop\species_name\',species_name]); mkdir=making a new folder folder name
%changing directory
cd(['C:\Users\prasa\OneDrive\Desktop\species_name\',species_name]); cd=changing folder
%saving
saveas(figure(1),'Cp_value t.jpg') saveas=save the figure at specific format specify the file name as a character vector string that includes a file extension for example myplot,jpg the file extension defines the file format if you do not
specify on extension
saveas(figure(2),'S_value t.jpg')
saveas(figure(3),'H_value t.jpg')%To find out molecular Weight
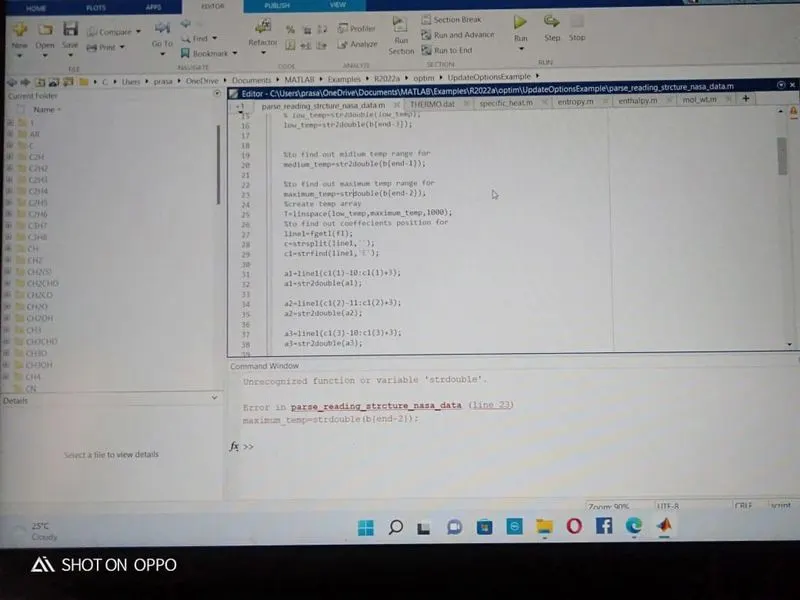
Error -some error in maximum temp command strdouble (b{end-2});
solve-str2double (b{end-2});mentioning 2
Error forgotting adding path during running program
solve -choose path option then program will performed very well