Week 3 - Solving second order ODEs
clear all
close all
clc
b=0.02;
g=9.81;
l=1;
m=0.1;
%initial condition
theta_0=[0;5];
%time points
t_span=linspace(0,50,500);
%solve ODE
[t,results]=ode45(@(t,theta)ode_func(t,theta,b,g,l,m),t_span,theta_0);
plot(t,results(:,1))
hold on
plot(t,results(:,2))
xlabel('time')
ylabel('plot')
legend({'displacement','velocity'})
%To defined pivot point of pendulam & plot it
X0=0;
Y0=0;
plot(X0,Y0,'marker','o')
%To extract the first column of a result and assigned it to 'Y'
Y=results(:,1);
% To create images for each time value and stored it in array 'm'
ct=1;
for i=1:length(t_span)
X1=1*sin(Y(i));
Y1=-1*cos(Y(i));
plot([X0,X1],[Y0,Y1],'LineWidth',3,'Marker','o')
hold on
plot(X1,Y1,'Marker','o','Color','g','MarkerSize',30,'MarkerFaceColor','g')
hold off
title({'simple harmonic motion';'of a pendulam'},'color','r')
axis([-1 1 -2 0])
pause(0.03)
xlabel('time')
ylabel('angular displacement & angular velocity')
M(ct)=getframe(gcf);
ct=ct+1;
end
%function commands
function [dtheta_dt]=ode_func(t,theta,b,g,l,m)
theta1=theta(1);
theta2=theta(2) ;
dtheta1_dt=theta2;
dtheta2_dt=(-b/m)*theta2-(g/l)*sin(theta1);
dtheta_dt=[dtheta1_dt;dtheta2_dt];
end
Errors i found while programing
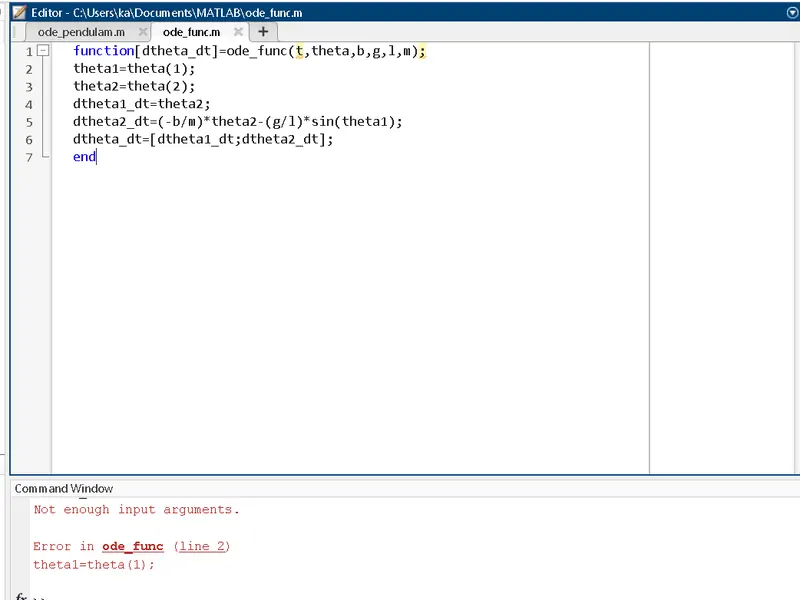
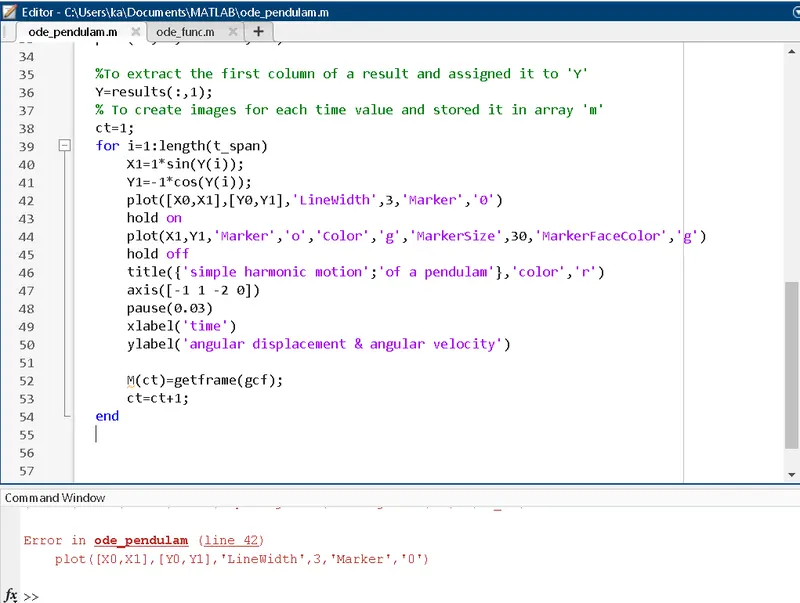
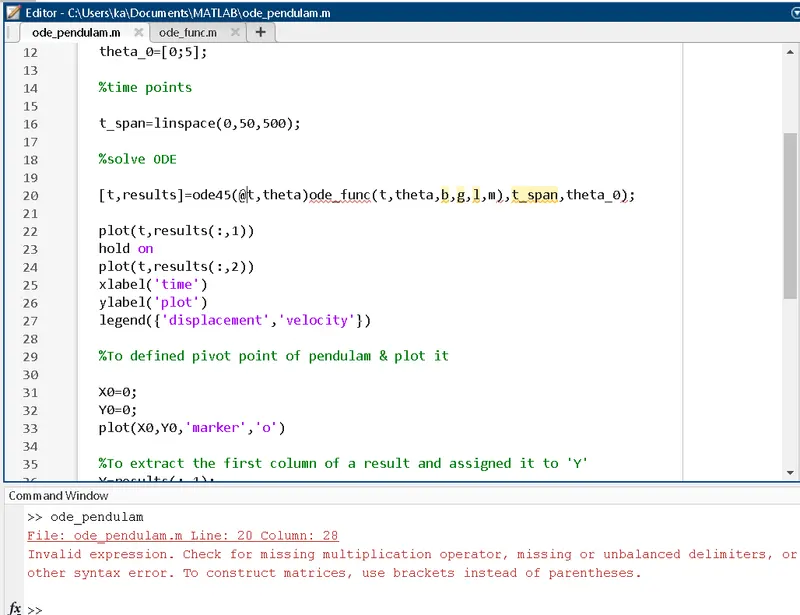 op
opEXPLANATIONS:
First i create a new script on my matlab application and generally i type clear all ,close all,clc for cancel not connectivity to other programs .then named the inputs b,g,l,m.the initial conditions that theta mention named as [0;5].time point arround (0,10,500).by solving ODE the function commands where used in next file with this program continuvity.in the function command we use to solve ode45 command
ode45(@(t,theta)ode_func(t,theta,b,g,l,m),t_span,theta_0) the plot the graph displacement and velocity.then finally we program for define pivot point of pendulam named as x0&y0 as 0 and plot it .the
To extract the first column of a result and assigned it to 'Y' named as Y=results(:,1).To create images for each time value and stored it in array 'm' use ct=1 for provid each and every frames.then we create for loop option then named as value x1=1*sin(Y(i) & Y1=-1*cos(Y(i),then plot it after we use hold on command to hold the plot full X1,Y1,'Marker','o','Color','g','MarkerSize',30,'MarkerFaceColor','g' the use hold off .titlte it using title commands as simple harmonic motion of a pendulam the arrage the axis from -1,1,-2,0 and pause it for 0.03 sec then label the x and y as time and angular displacement & angularvelocity all the figures are converting into frames and are getting stored in arrray called M as M(ct)=getframe(gcf) then the output will display ...........