Project 1 - Parsing NASA thermodynamic data
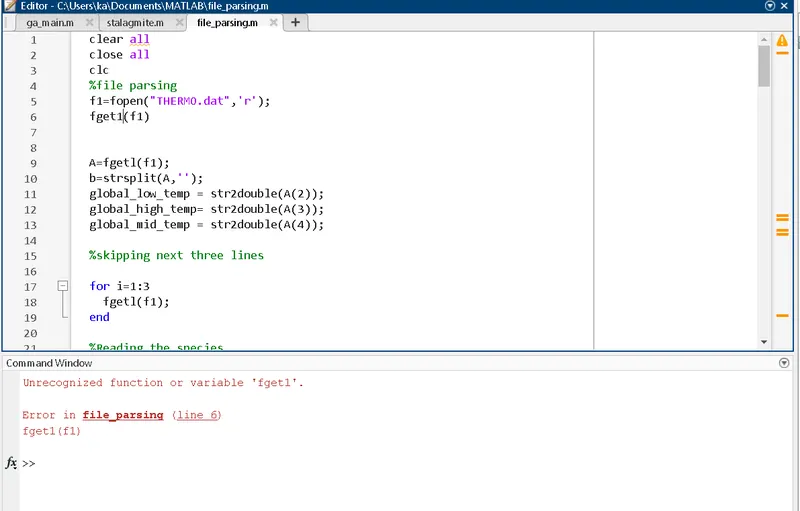
clear allclose allclc%file parsingf1=fopen("THERMO.dat",'r');fgetl(f1)A=fgetl(f1);b=strsplit(A,'');global_low_temp = str2double(A(2));global_high_temp= str2double(A(3));global_mid_temp = str2double(A(4));%skipping next three linesfor i=1:3fgetl(f1);end%Reading the speciesfor i=1:53header=fgetl(f1);X=strsplit(header,' ');species_name=(X{1});Z=length(X);local_low_temp = str2double(X{Z-3});local_high_temp= str2double(X{Z-2});local_mid_temp = str2double(X{Z-1});t1=local_low_temp;t2=local_mid_temp;t3=local_high_temp;%getting first line coeffecients (a1-a5)line_1 =fgetl(f1);a=strfind(line_1,'E');a1=str2double(line_1(1:a(1)+3));a2=str2double(line_1(a(1)+4:a(2)+3));a3=str2double(line_1(a(2)+4:a(3)+3));a4=str2double(line_1(a(3)+4:a(4)+3));a5=str2double(line_1(a(4)+4:a(5)+3));%getting second line coeffecients (a6-a10)line_2 =fgetl(f1);a_1=strfind(line_2,'E');a6=str2double(line_2(1:a_1(1)+3));a7=str2double(line_2(a_1(1)+4:a_1(2)+3));a8=str2double(line_2(a_1(2)+4:a_1(3)+3));a9=str2double(line_2(a_1(3)+4:a_1(4)+3));a10=str2double(line_2(a_1(4)+4:a_1(5)+3));%getting third line coeffecients (a10-a14)line_3 =fgetl(f1);a_2=strfind(line_3,'E');a11=str2double(line_3(1:a_2(1)+3));a12=str2double(line_3(a_2(1)+4:a_1(2)+3));a13=str2double(line_3(a_2(2)+4:a_1(3)+3));a14=str2double(line_3(a_2(3)+4:a_1(4)+3));% creating foldermkdir(['C:\Users\ka\Documents\MATLAB\Species\',species_name]);t=linspace(t1,t3,1000);R=8.314;%To get array of specific heat,enthalpy and entropyfor k=1:length(t)% To compare the species temperature to assign the coefficeints% a1=a7(high temp coeff),a8-a14 (low temp coeff)if t(k)>t2% high temperature coefficientscp(k)=(a1+a2^t(k)+a3*t(k)^2+a4*t(k)^3+a5*t(k)^4*R);H(k)=(a1+(a2*t(k))/2+(a3*t(k)^2)/3+(a4*t(k)^3)/4+(a5*t(k)^4)/5+(a6/t(k)))*R*t(k);S(k)=(a1*log(t(k))+a2*t(k)+(a3*t(k)^2)/2+(a4*t(k)^3)/3+(a5*t(k)^4)/4+a7)*R;else % low temperature coefficientscp(k)=(a8+a9^t(k)+a10*t(k)^2+a11*t(k)^3+a12*t(k)^4*R);H(k)=(a8+(a9*t(k))/2+(a10*t(k)^2)/3+(a11*t(k)^3)/4+(a12*t(k)^4)/5+(a13/t(k)))*R*t(k);S(k)=(a8*log(t(k))+a9*t(k)+(a10*t(k)^2)/2+(a11*t(k)^3)/3+(a12*t(k)^4)/4+a14)*R;endend% plotting the graphsfigure(1);plot(t,cp);grid on;title (species_name);xlabel('temperature');ylabel('specific heat');figure(2);plot(t,H);grid on;title (species_name);xlabel('temperature');ylabel('enthalpy');figure(3);plot(t,S);grid on;title (species_name);xlabel('temperature');ylabel('entropy');cd(['C:\Users\ka\Documents\MATLAB\Species\',species_name]);% Changing the directory and saving the filesaveas(1,'specific heat','jpg');saveas(2,'enthalpy','jpg');saveas(3,'entropy','jpg');endfclose(f1)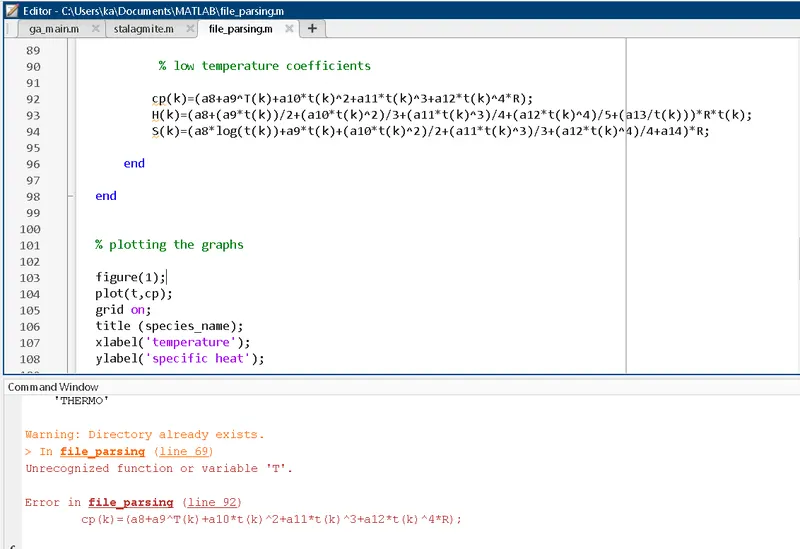
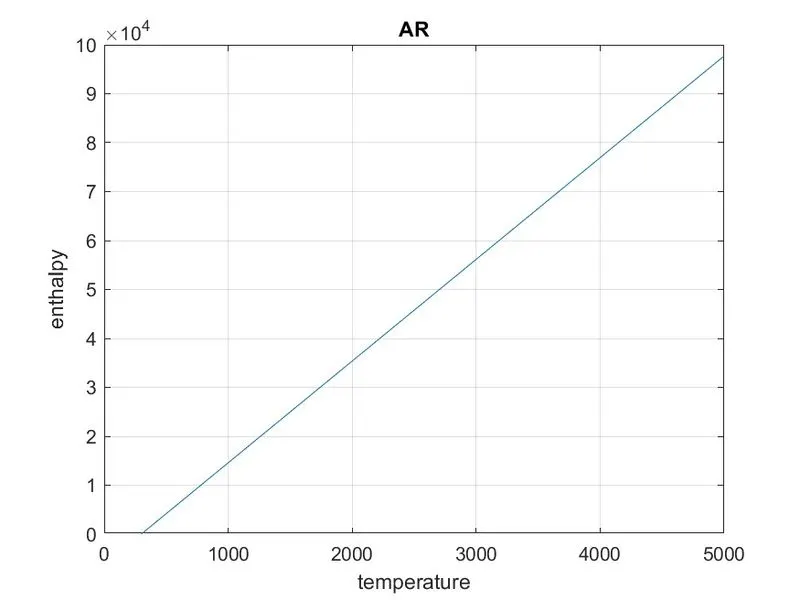
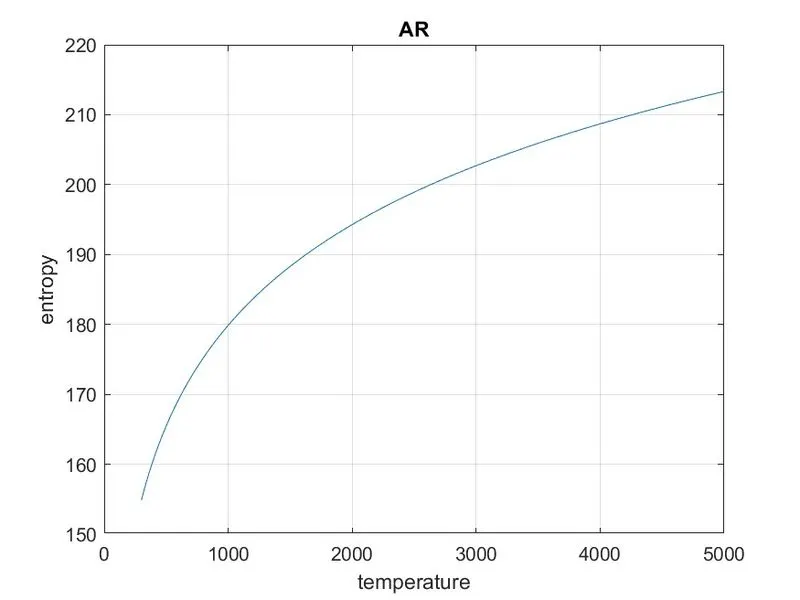
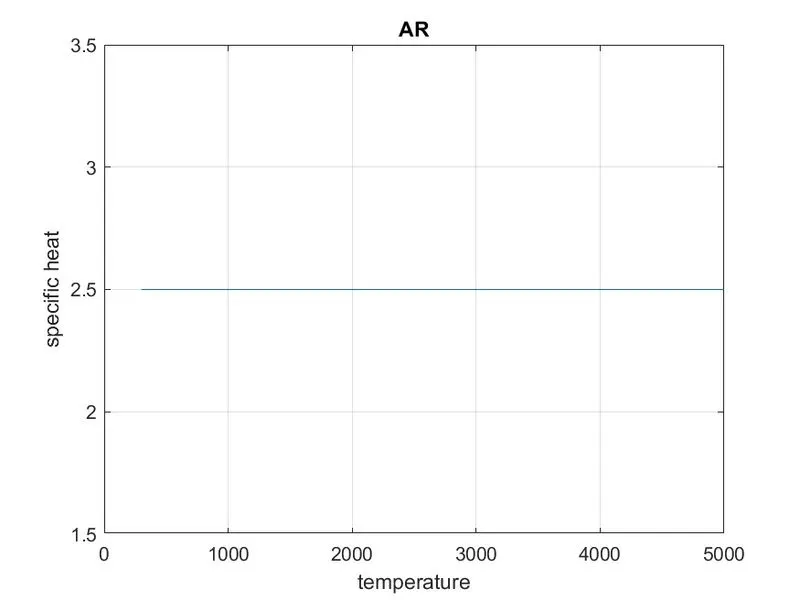
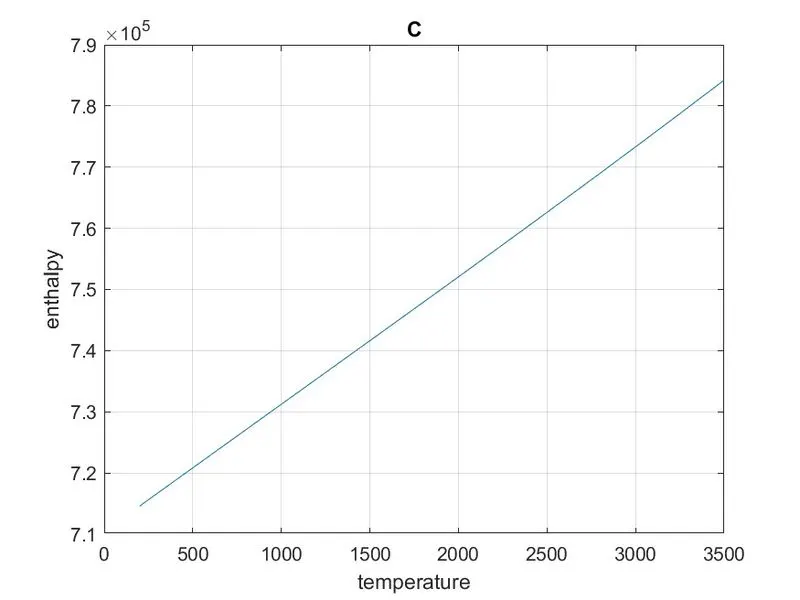
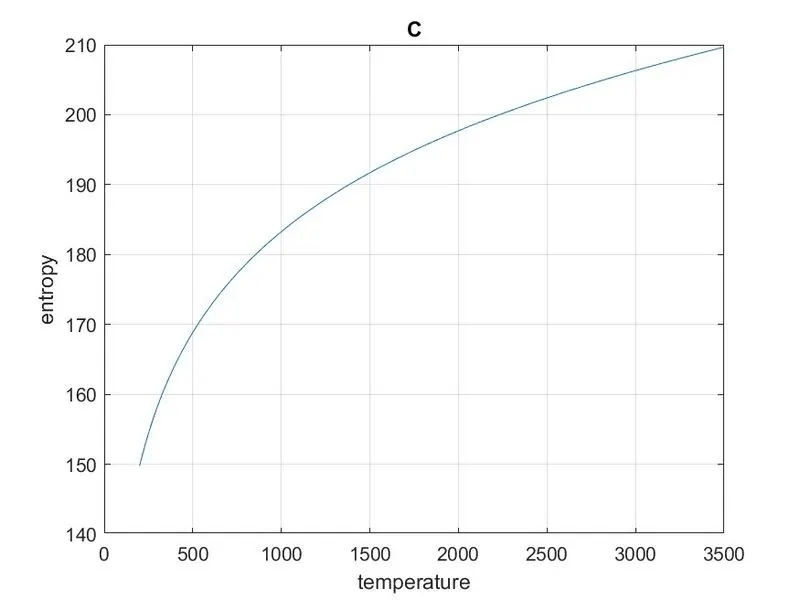
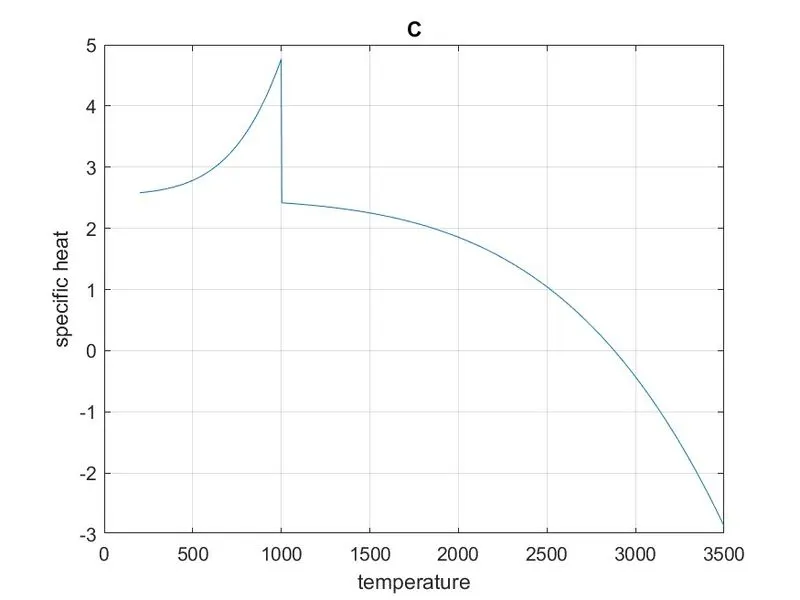
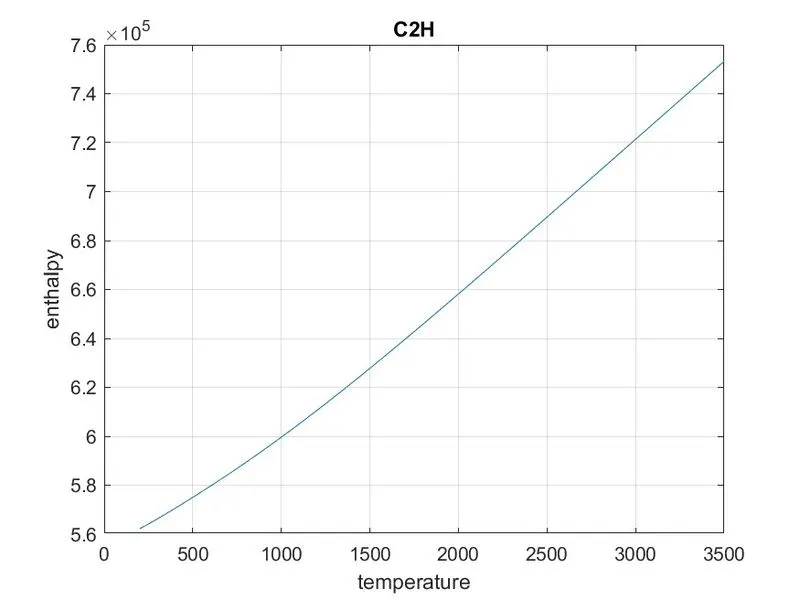
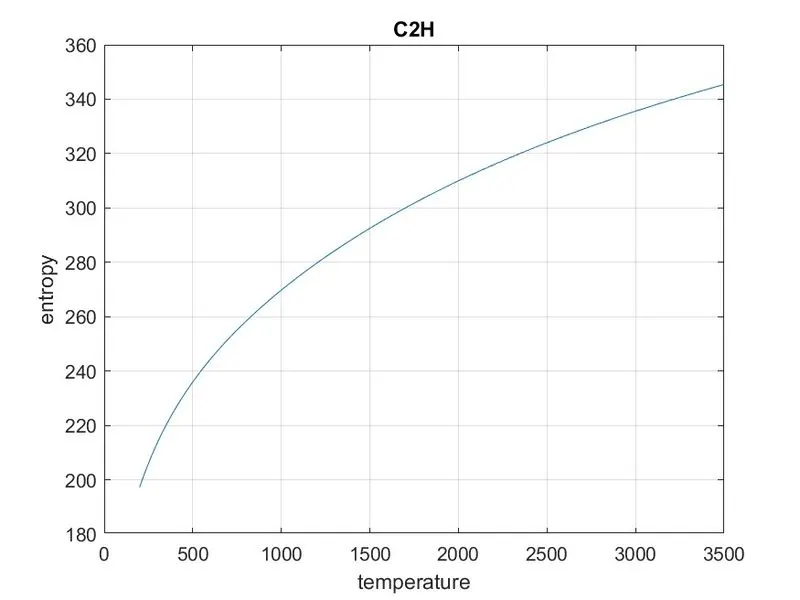
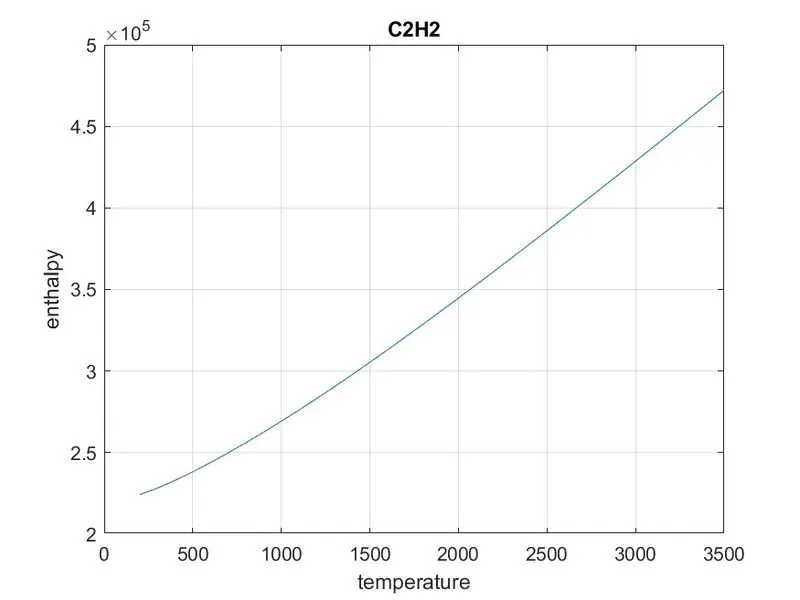
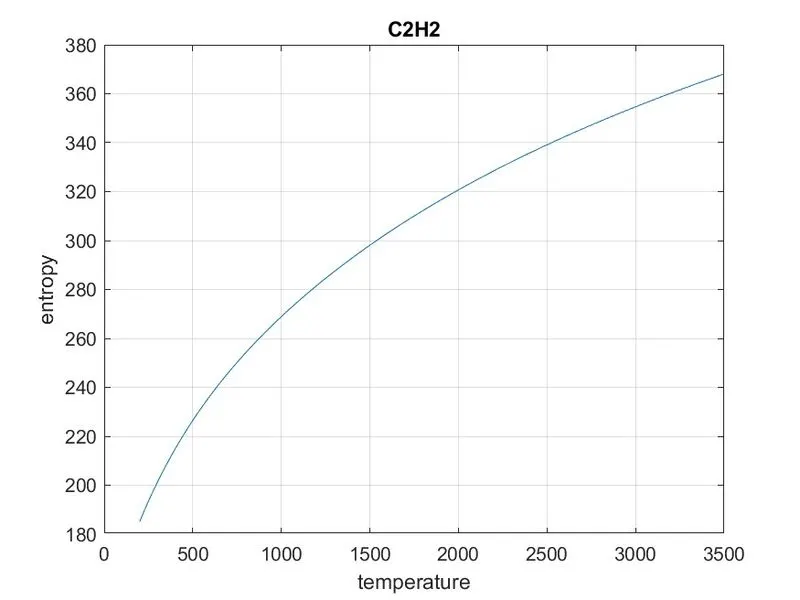
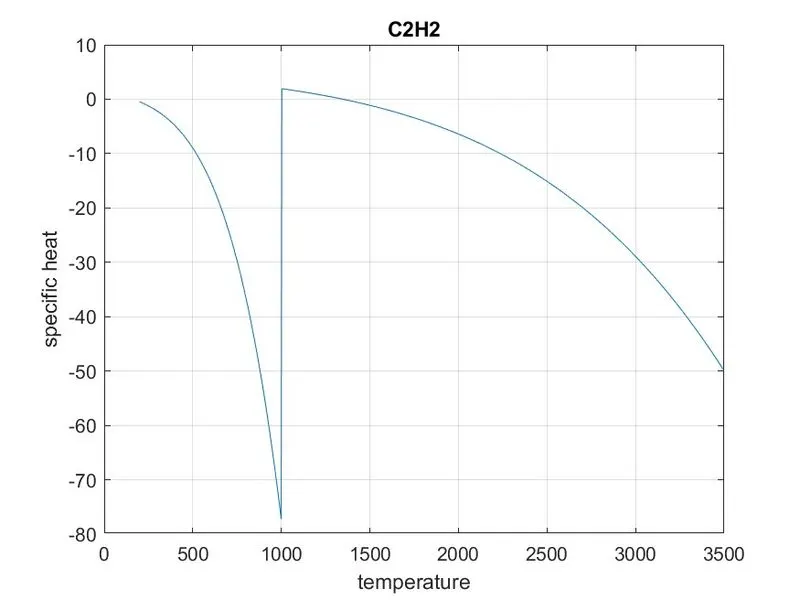
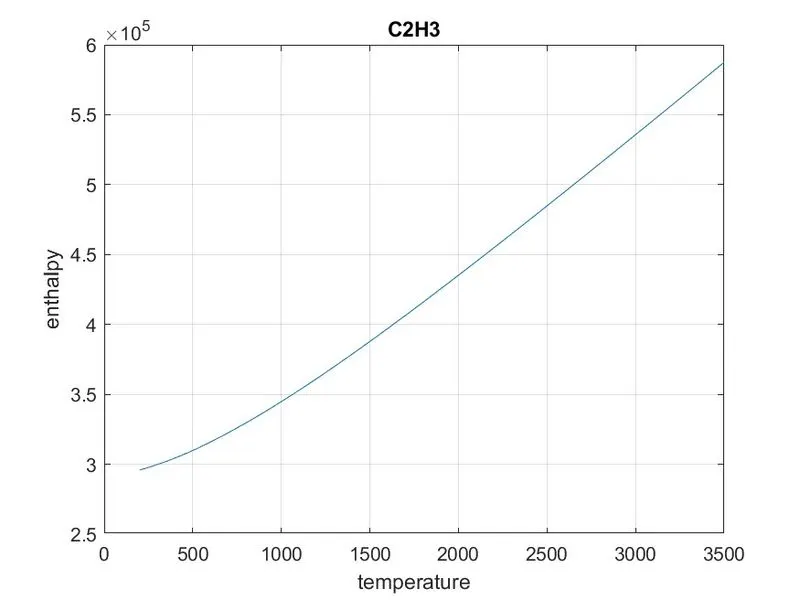
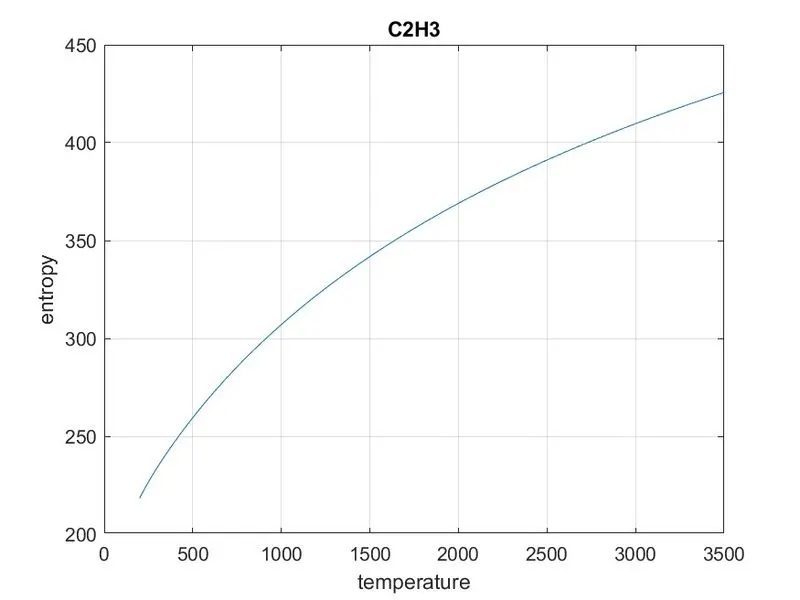
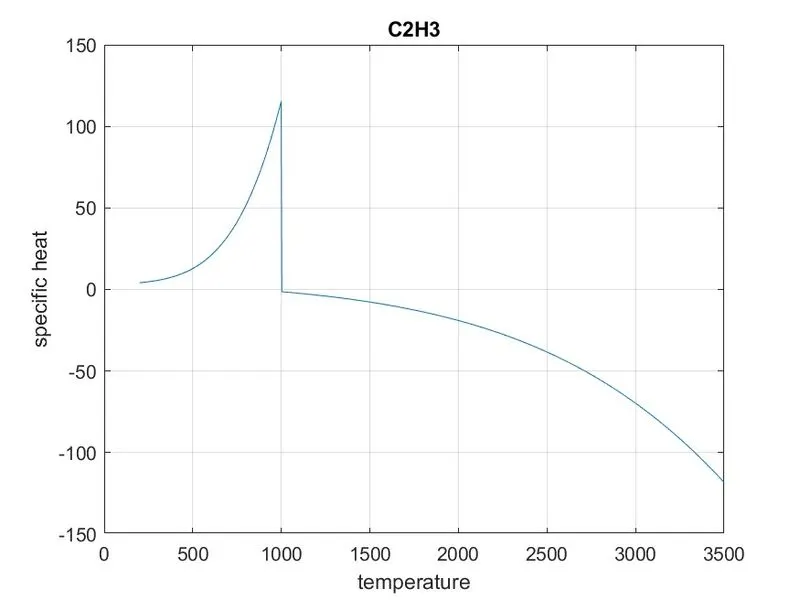
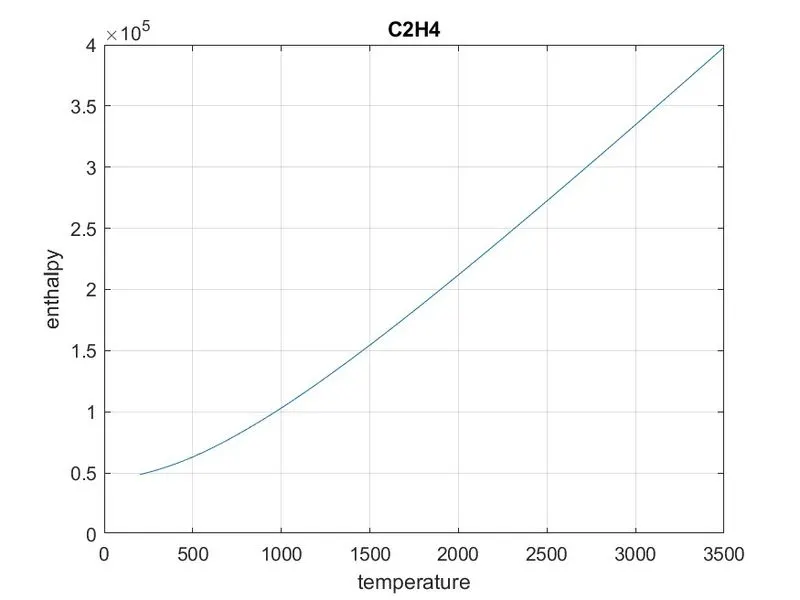
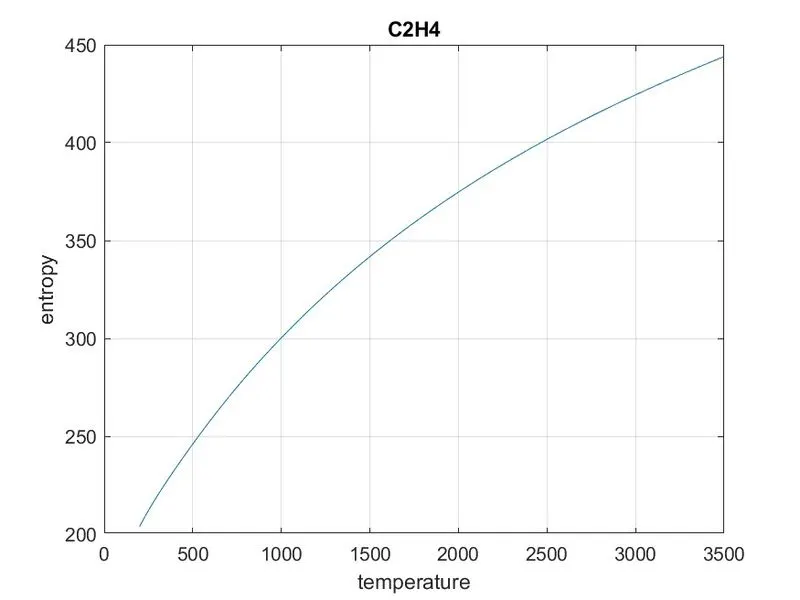
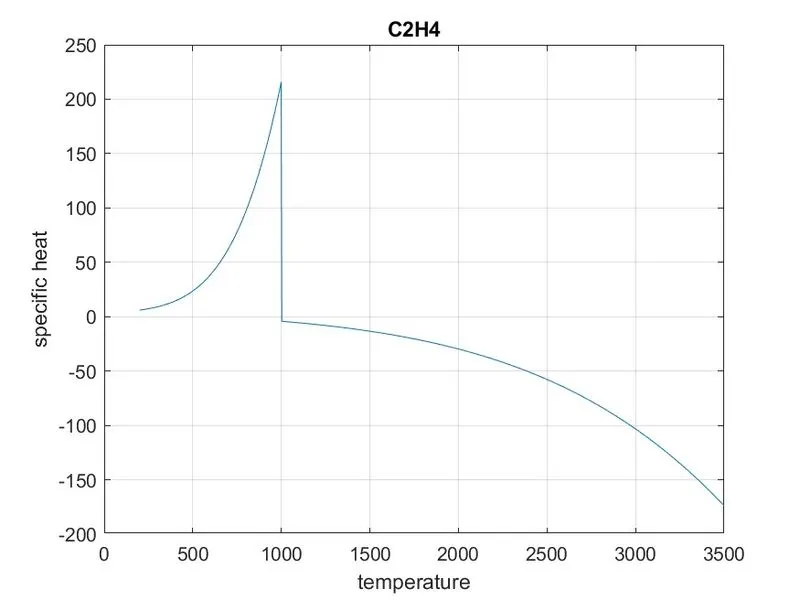
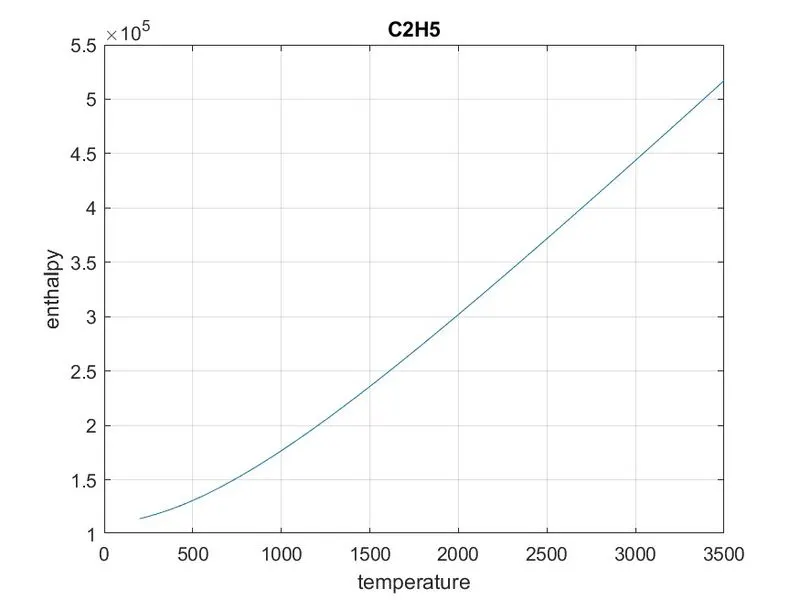
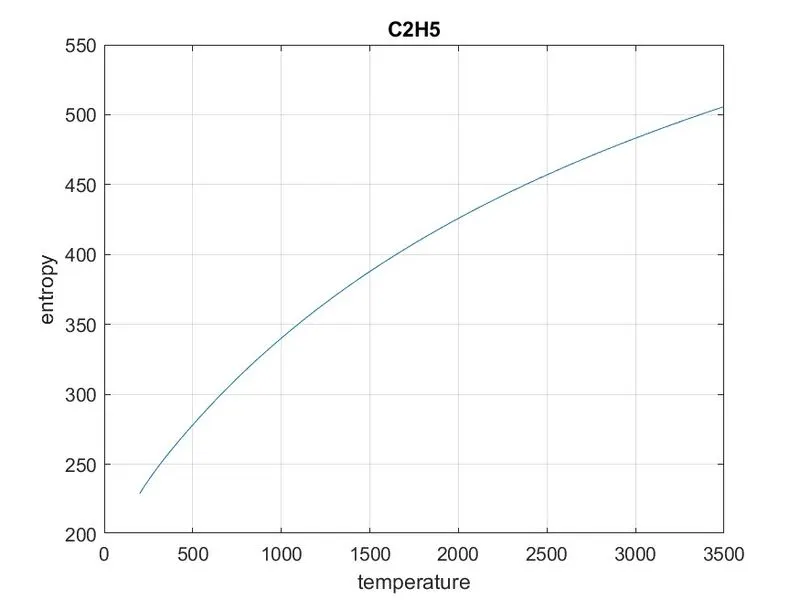
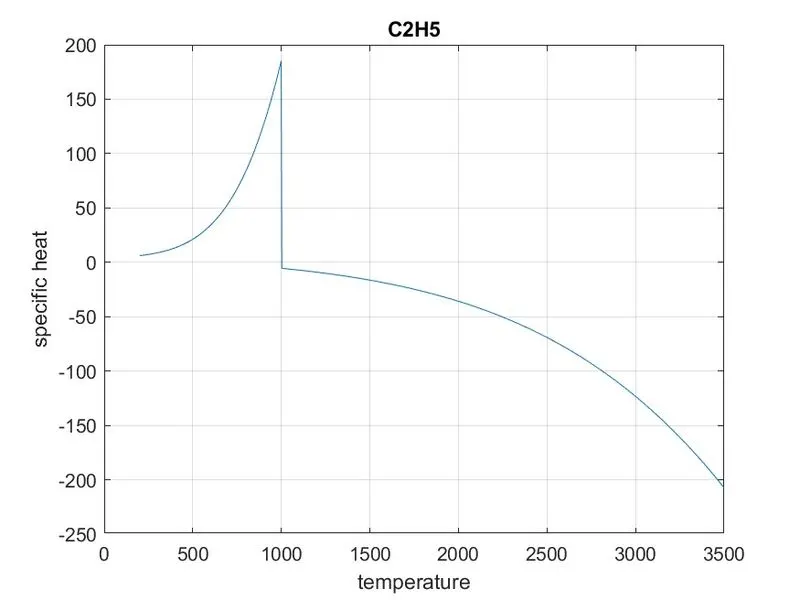
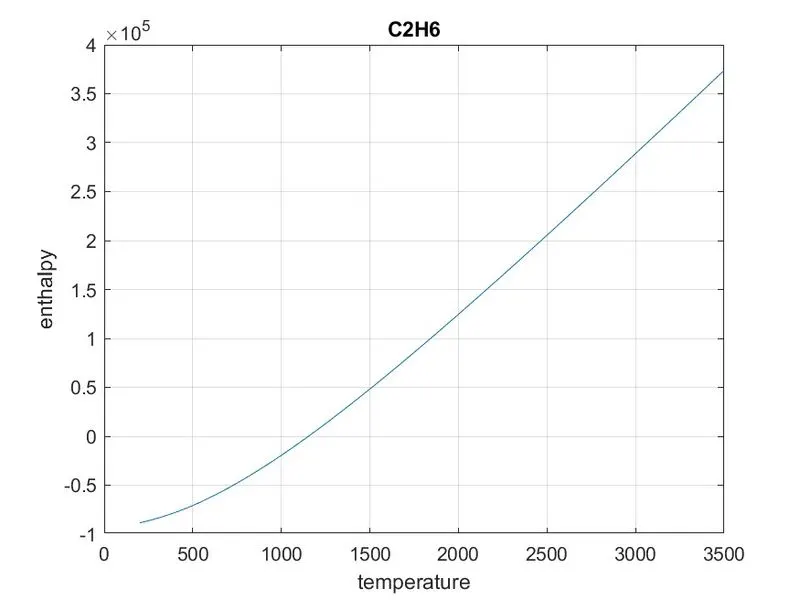
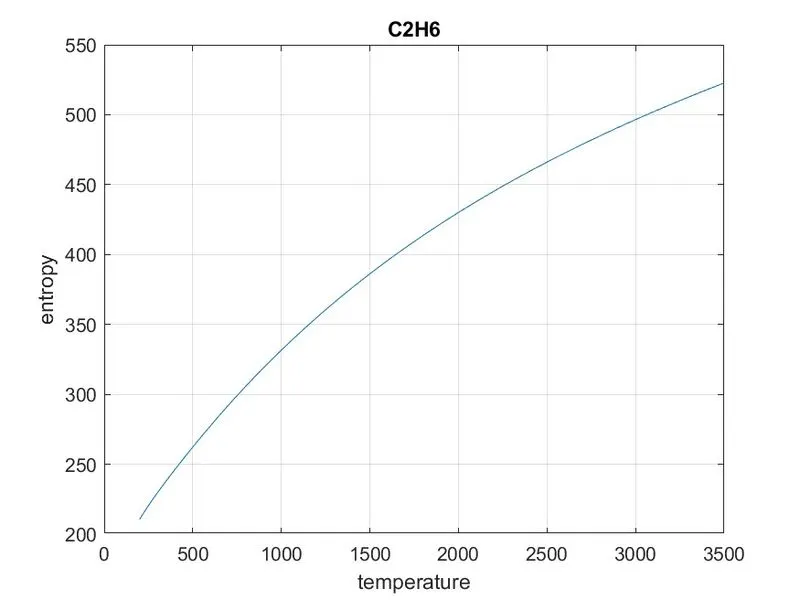
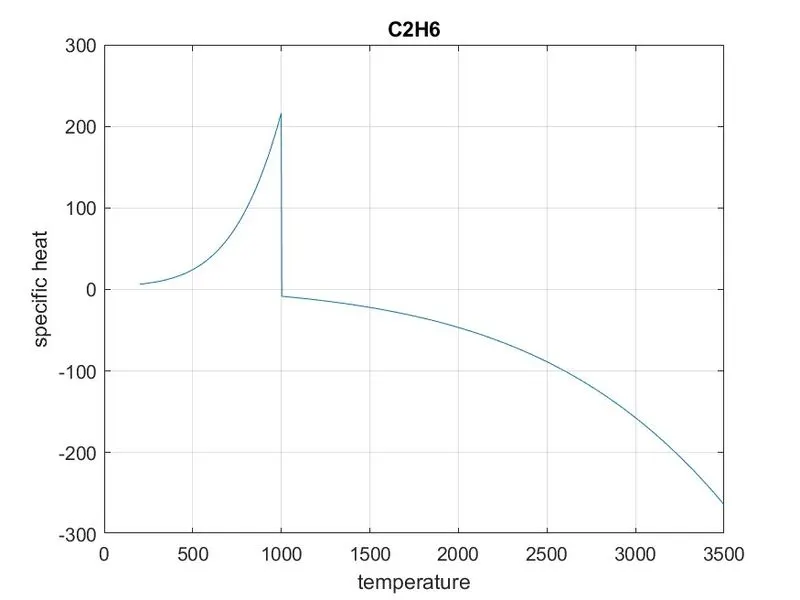
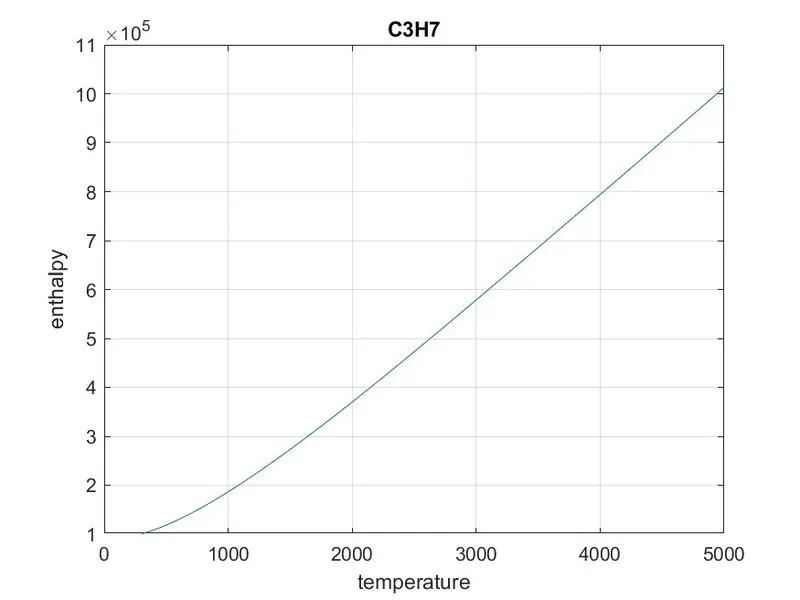
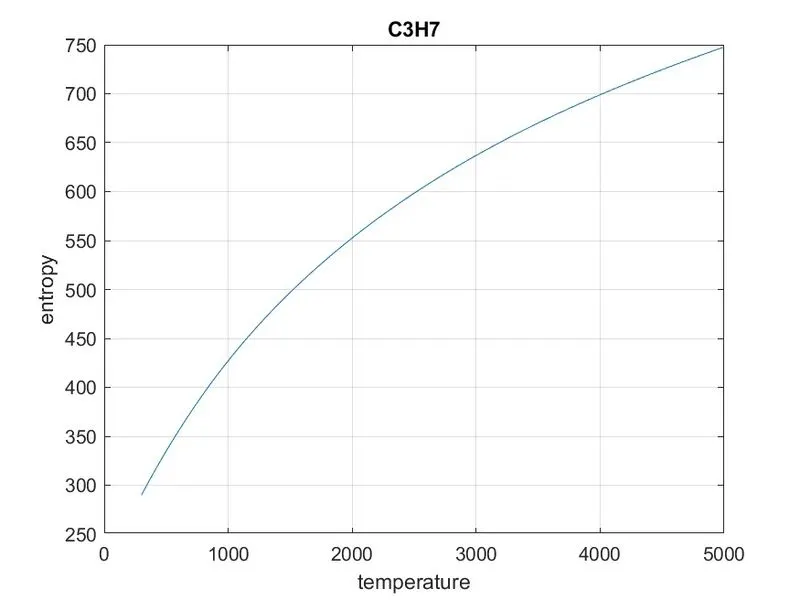
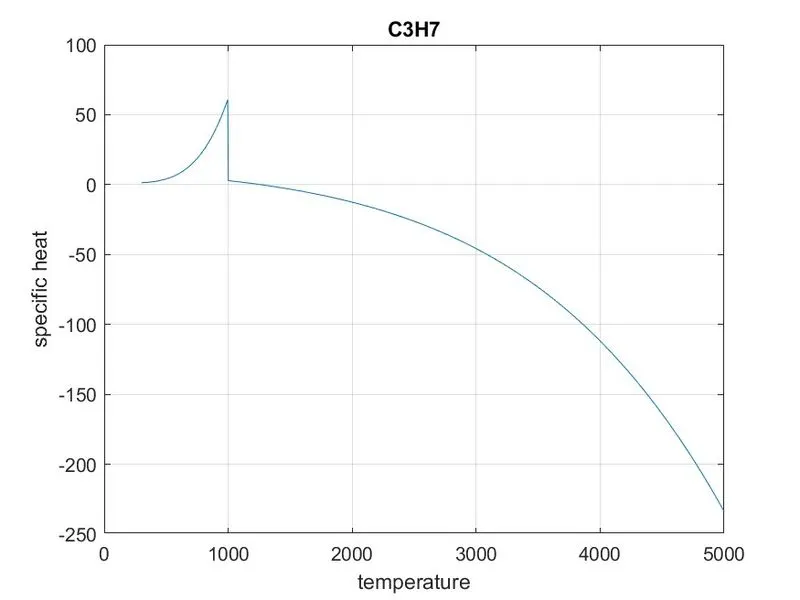
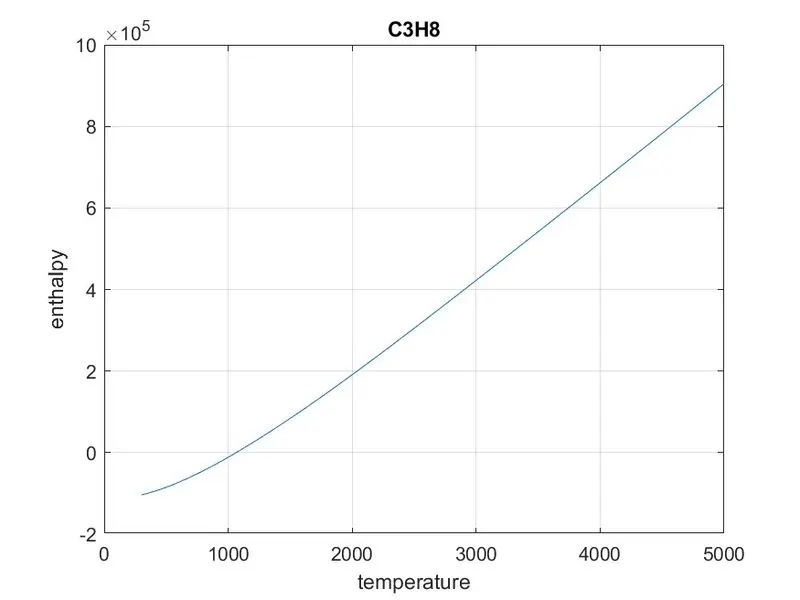
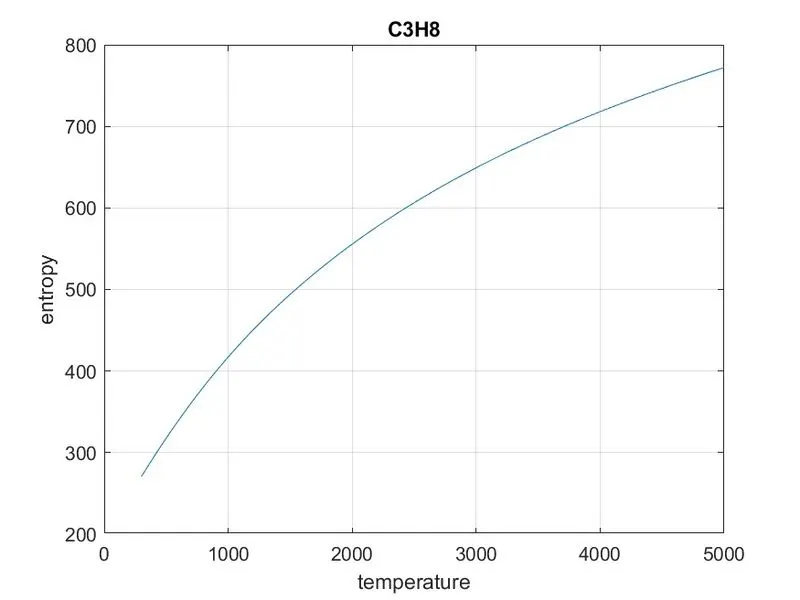
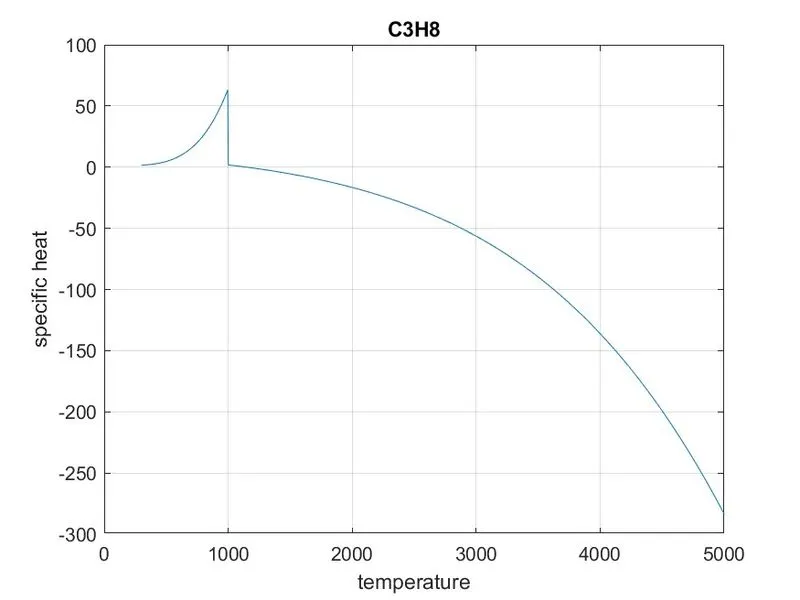
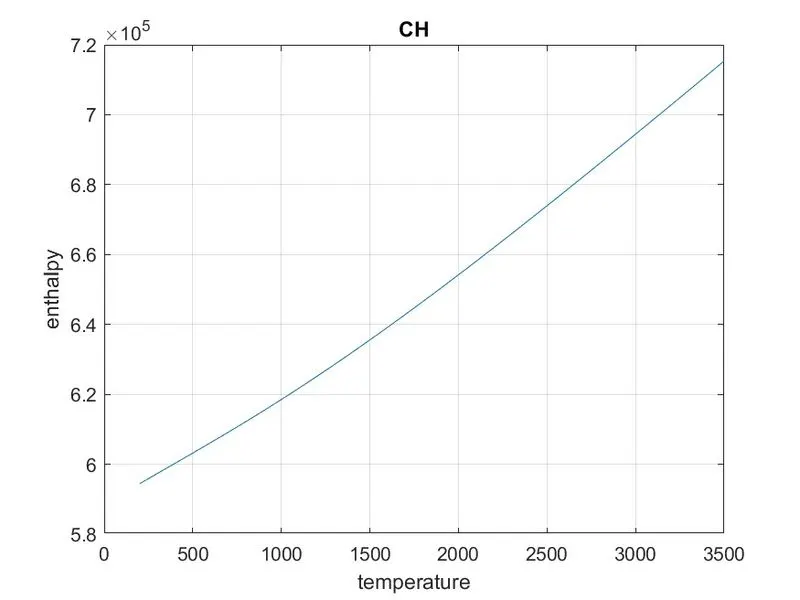
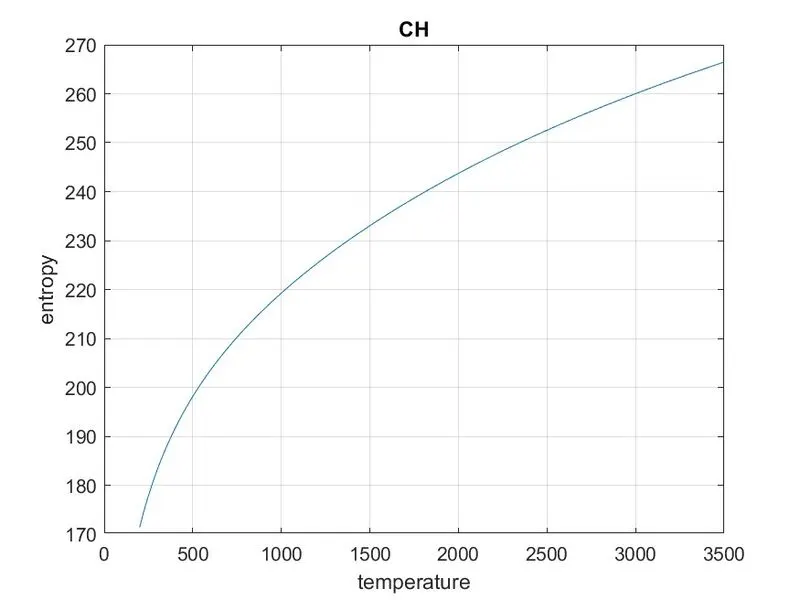
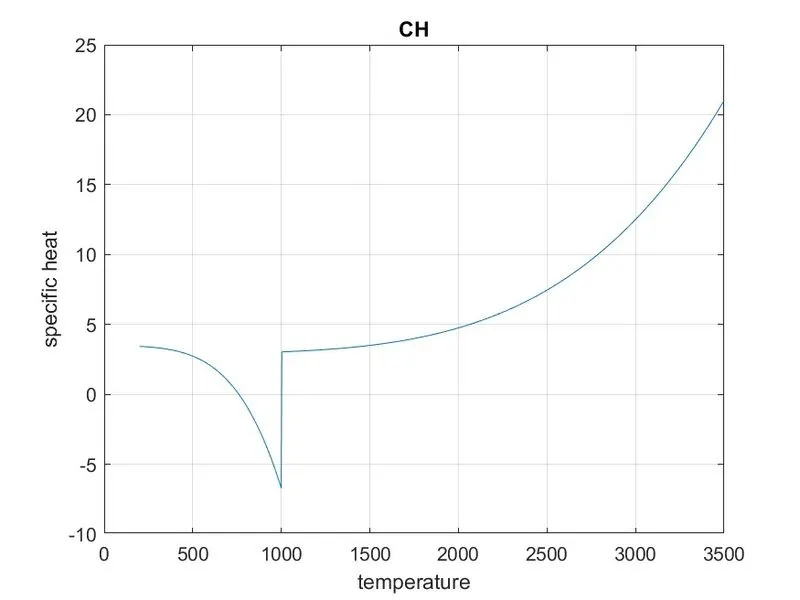
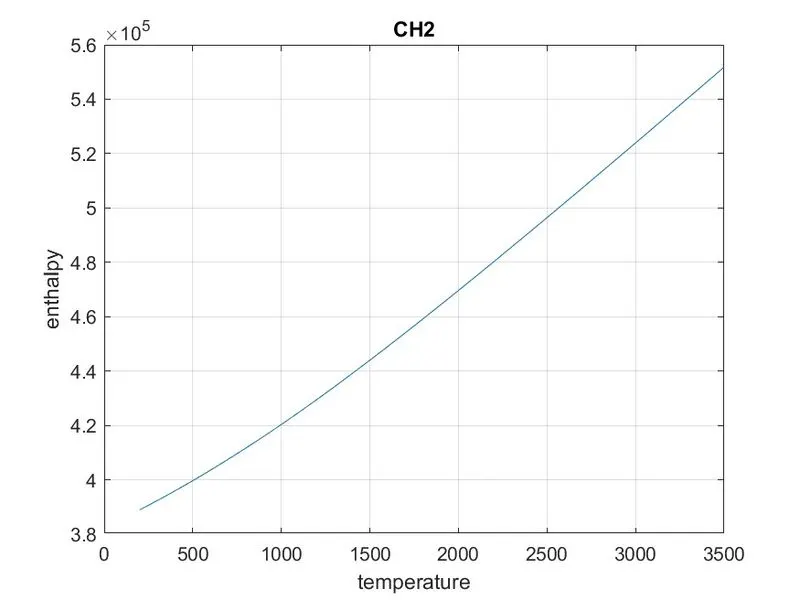
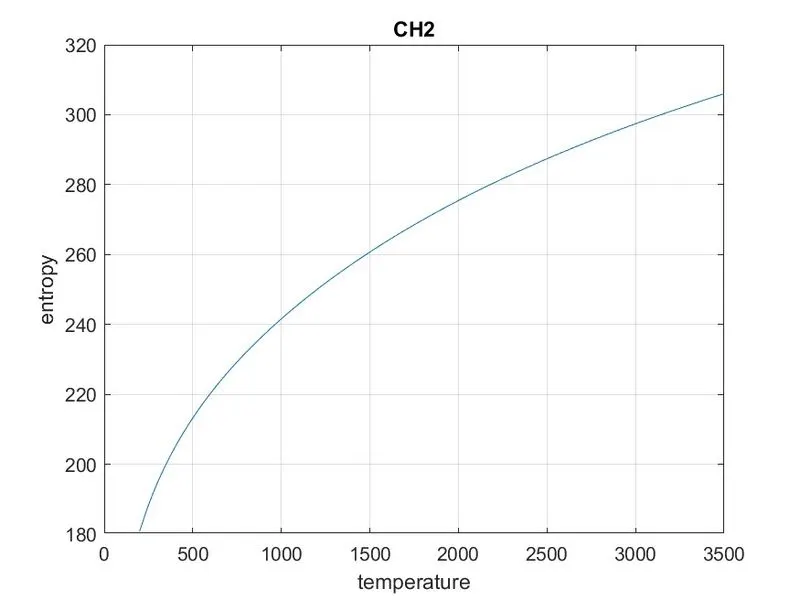
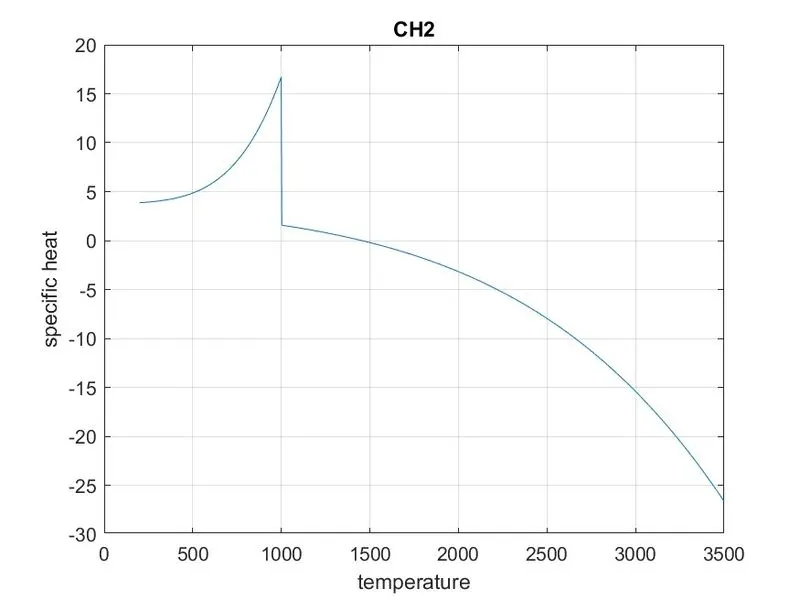
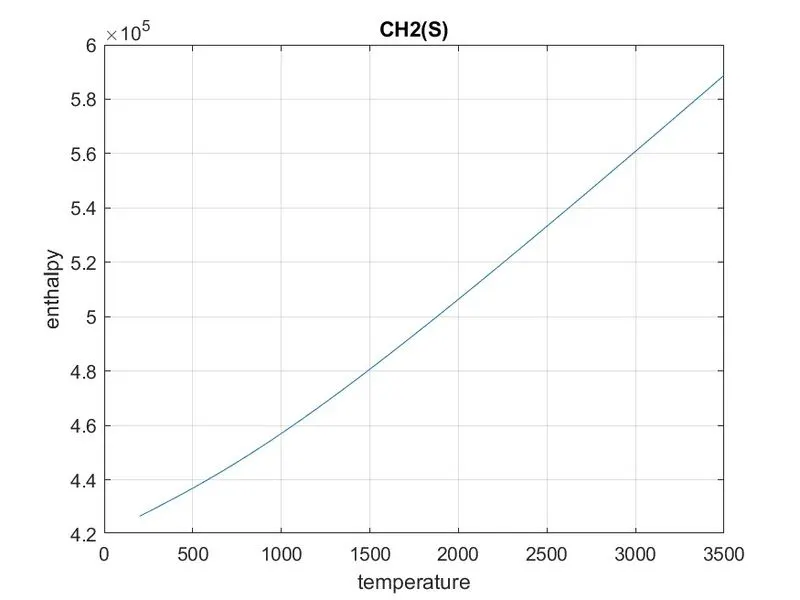
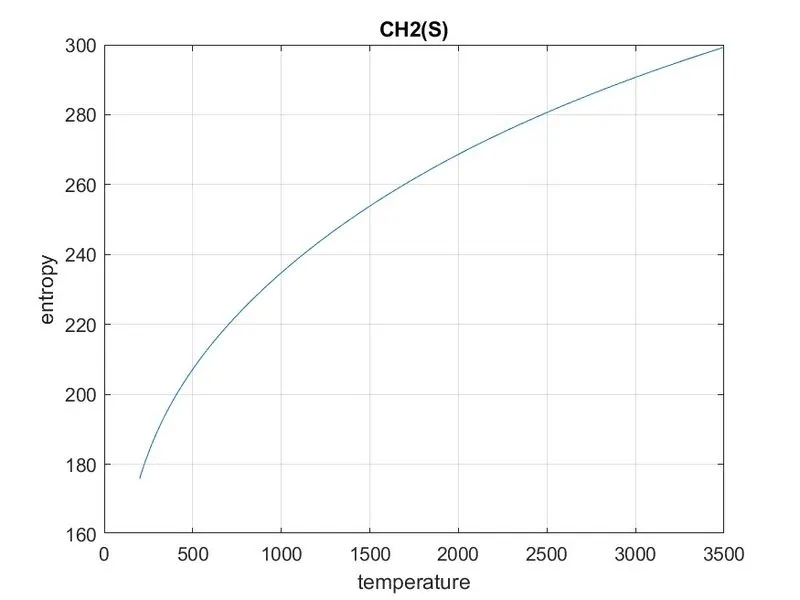
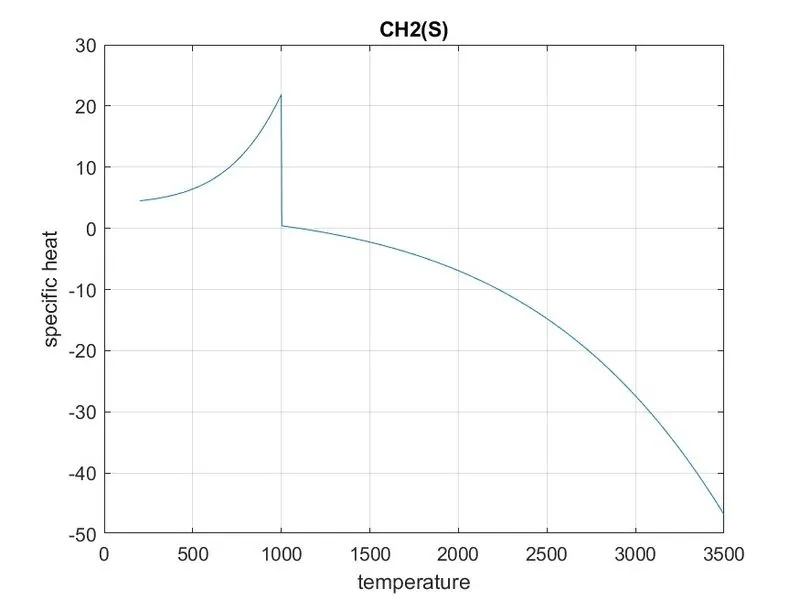
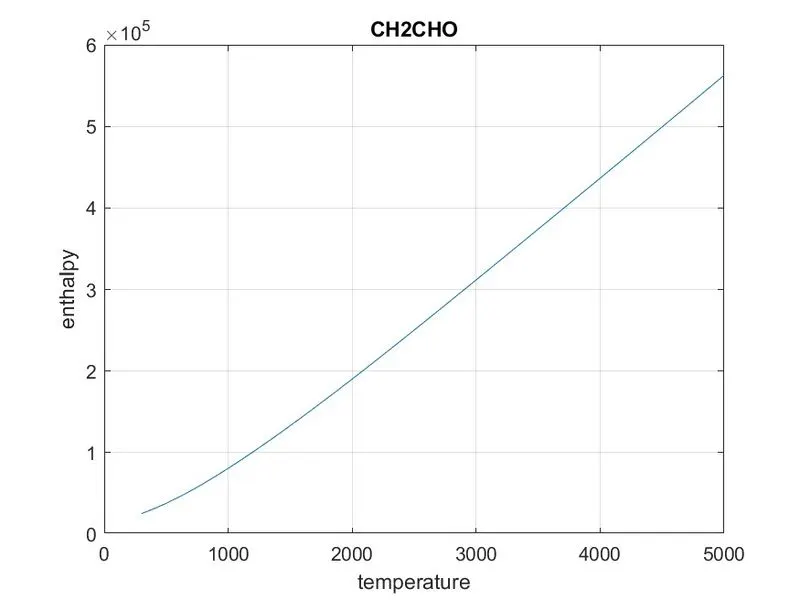
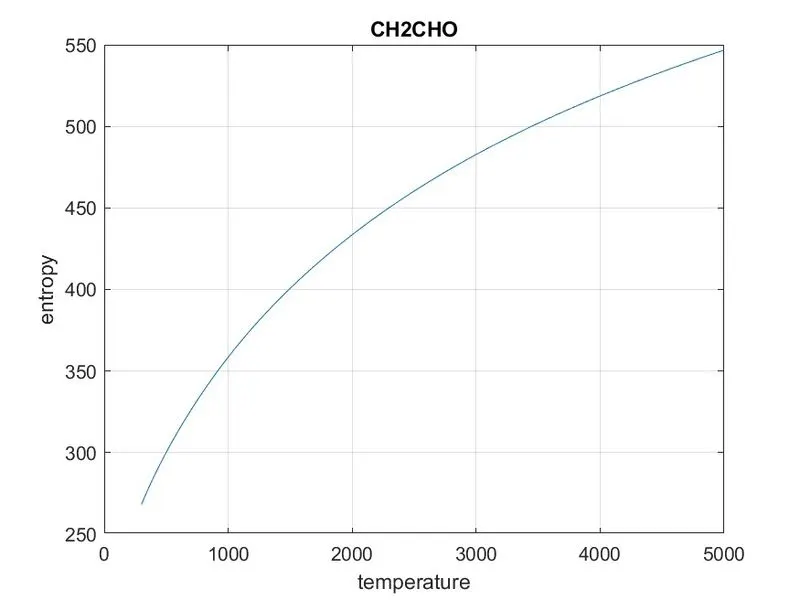
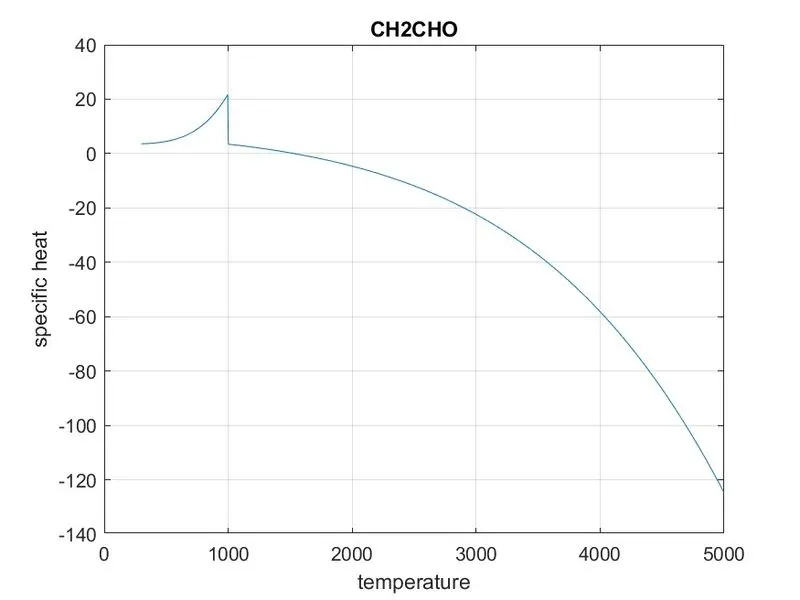
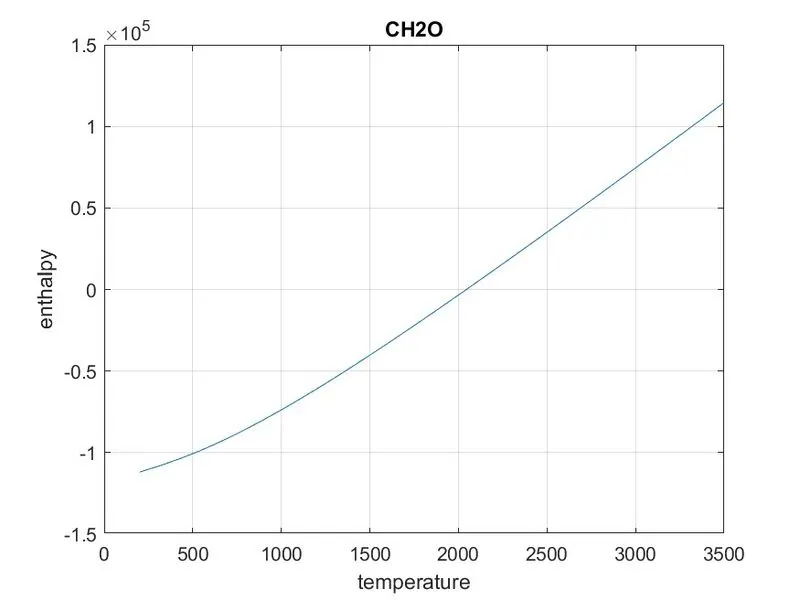
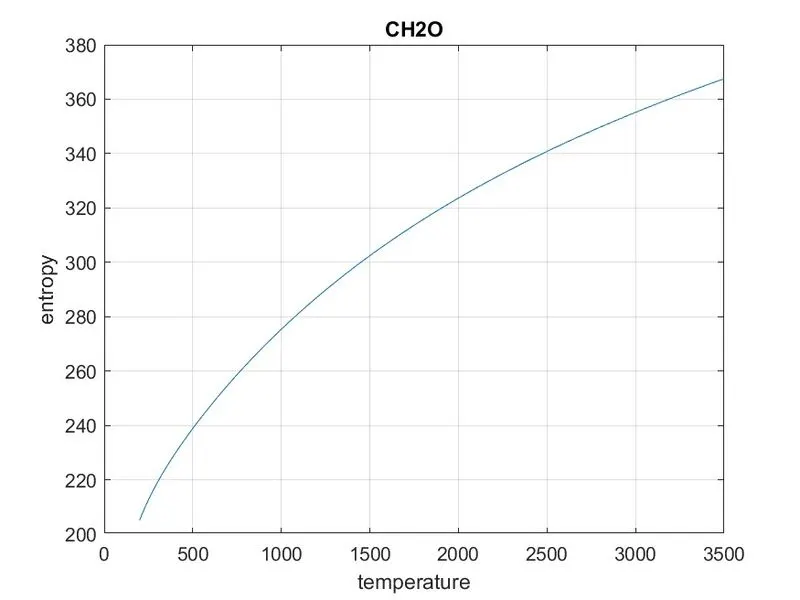
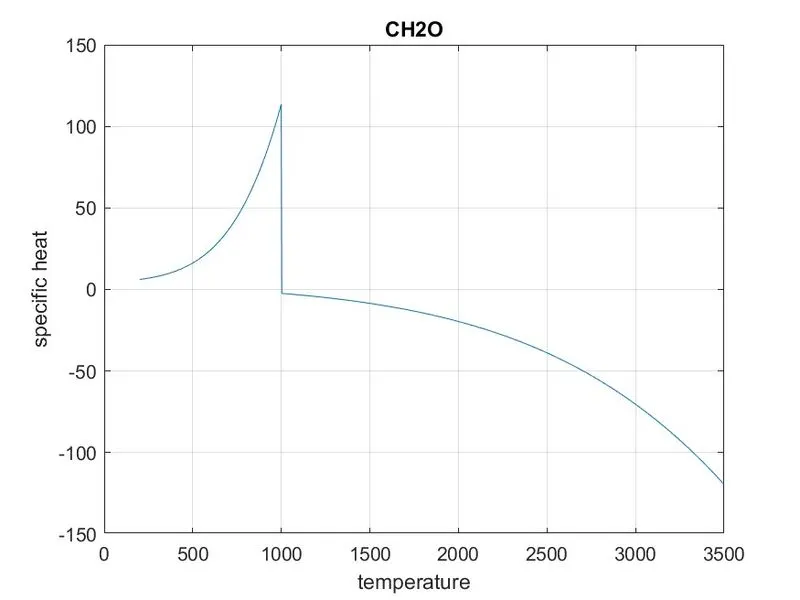
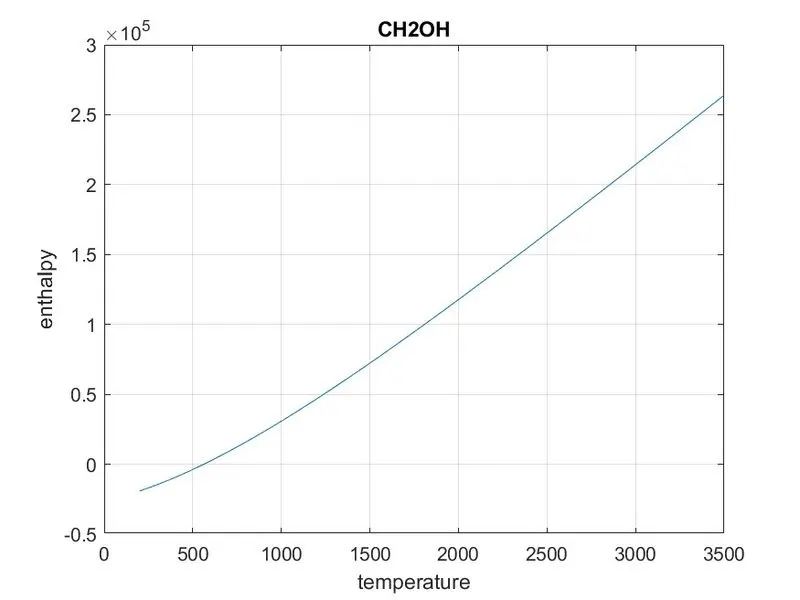
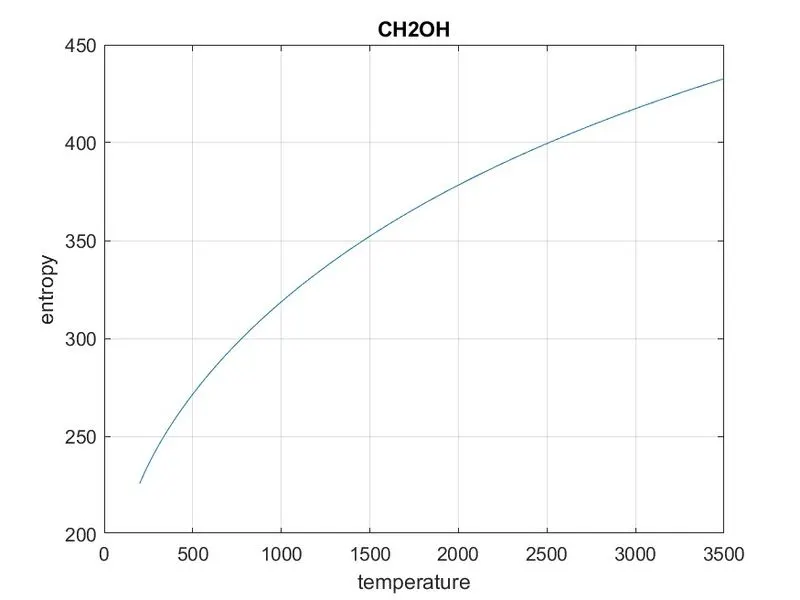
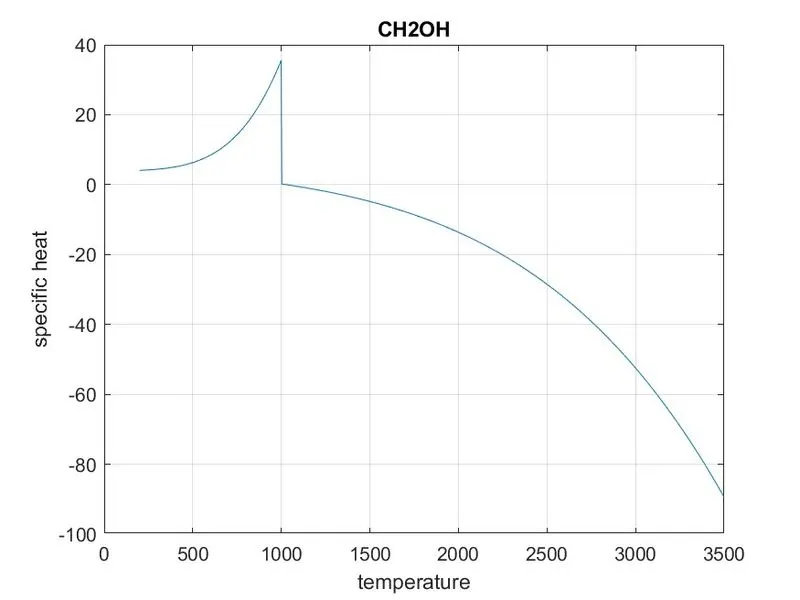
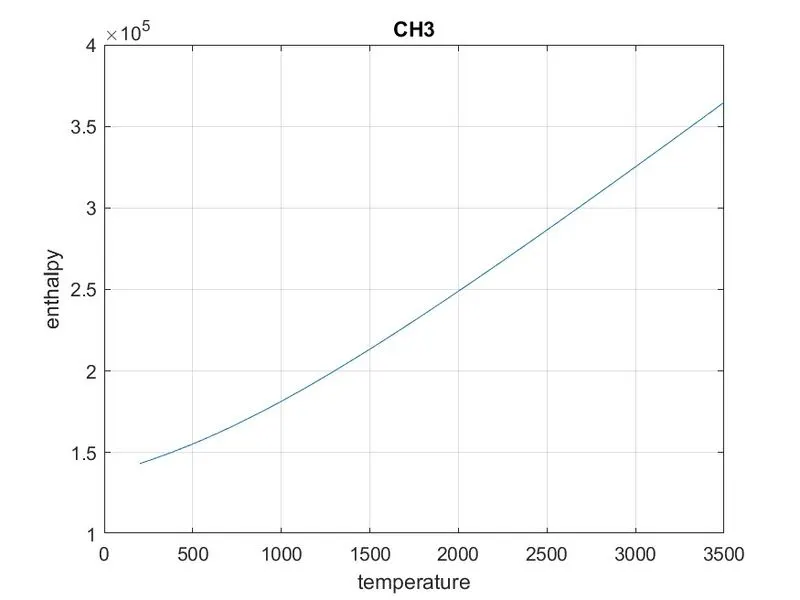
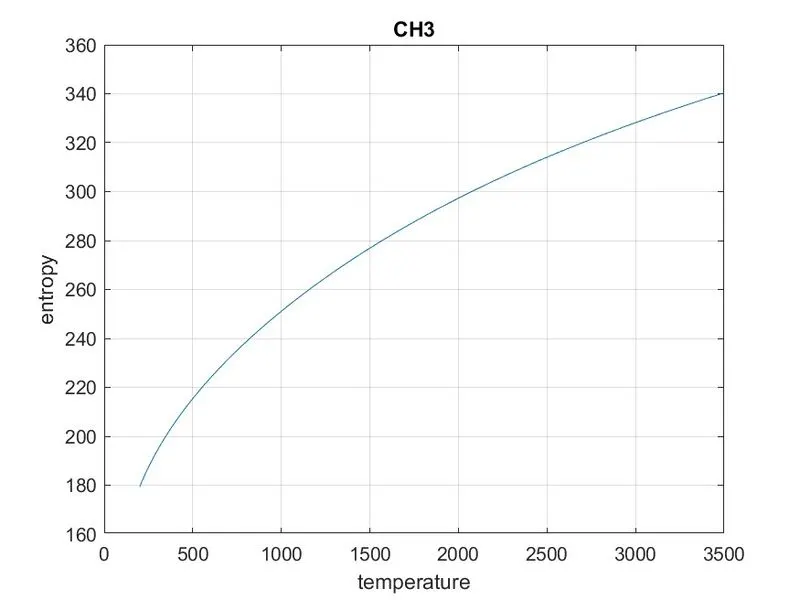
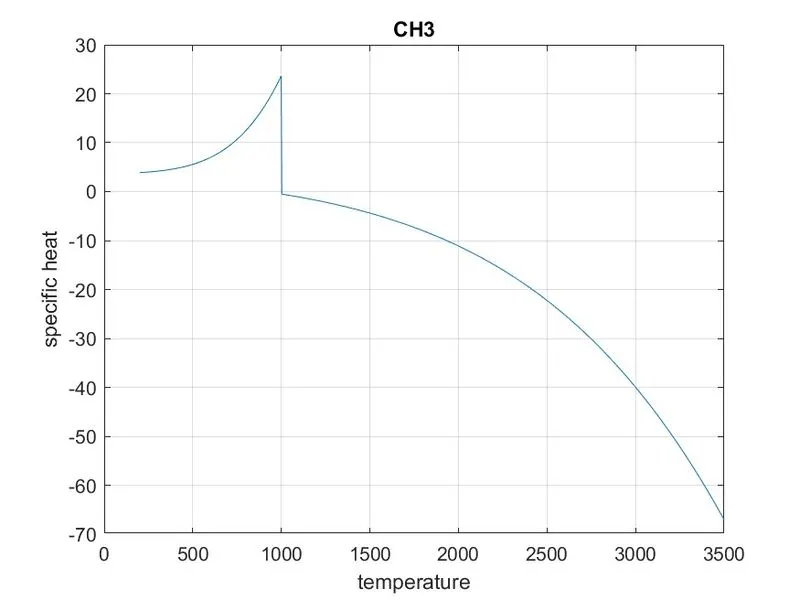
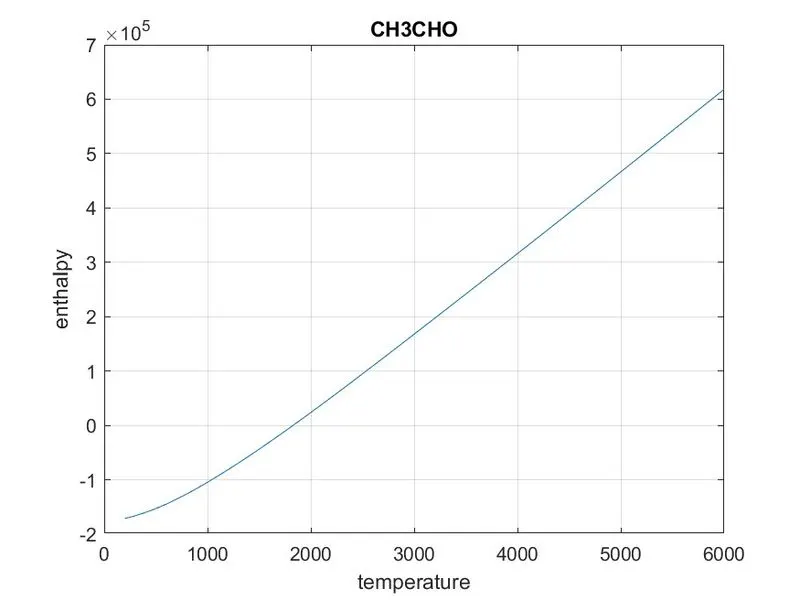
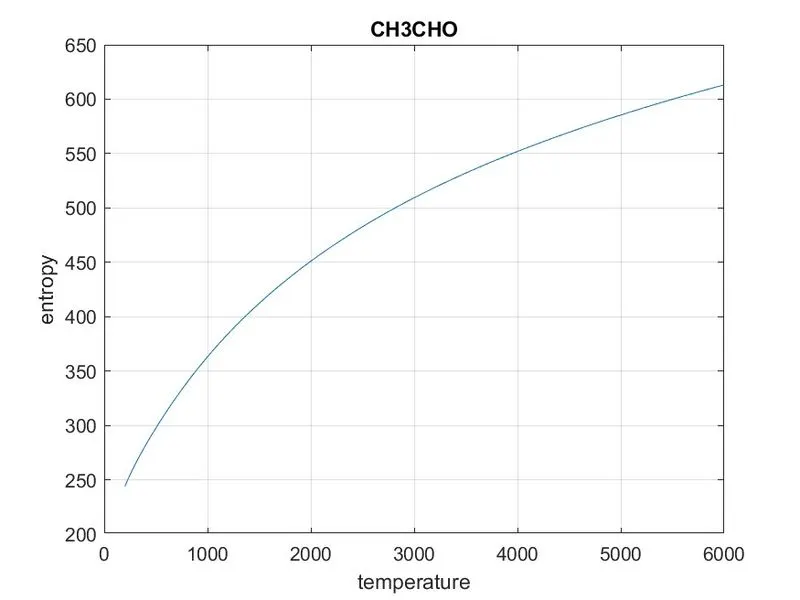
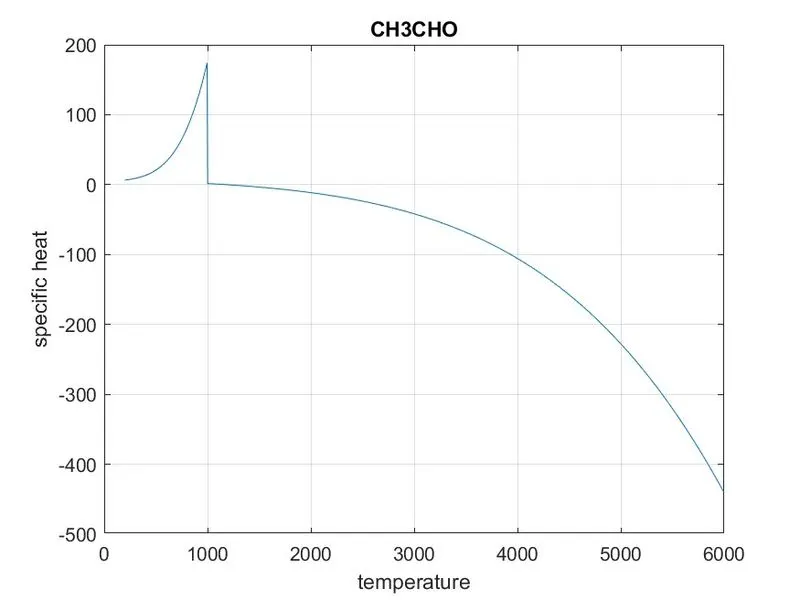
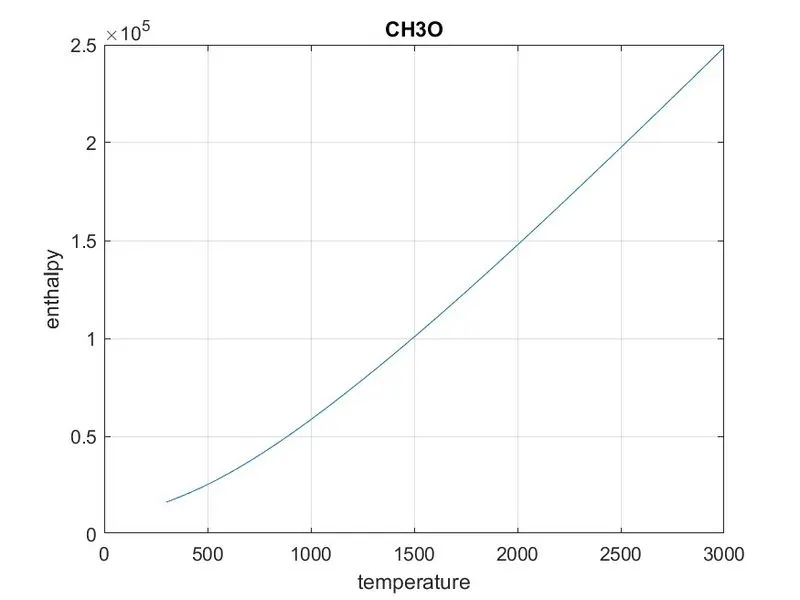
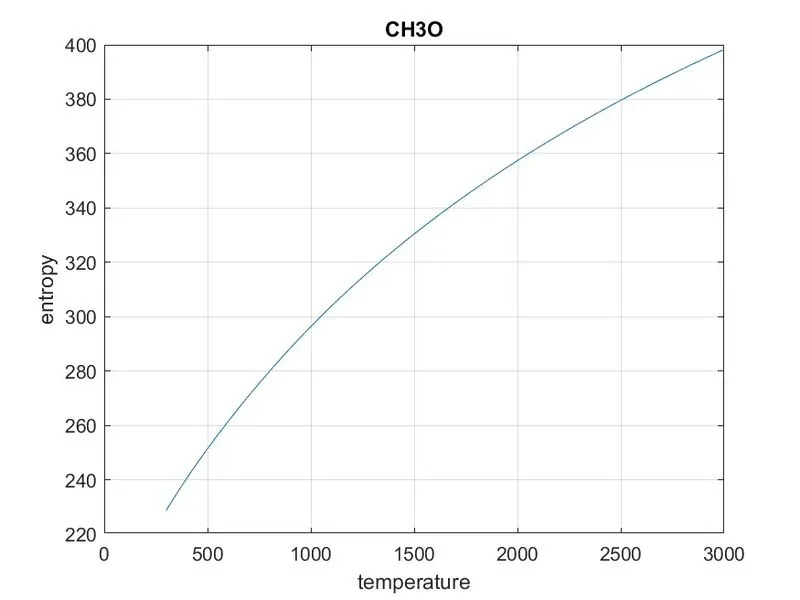
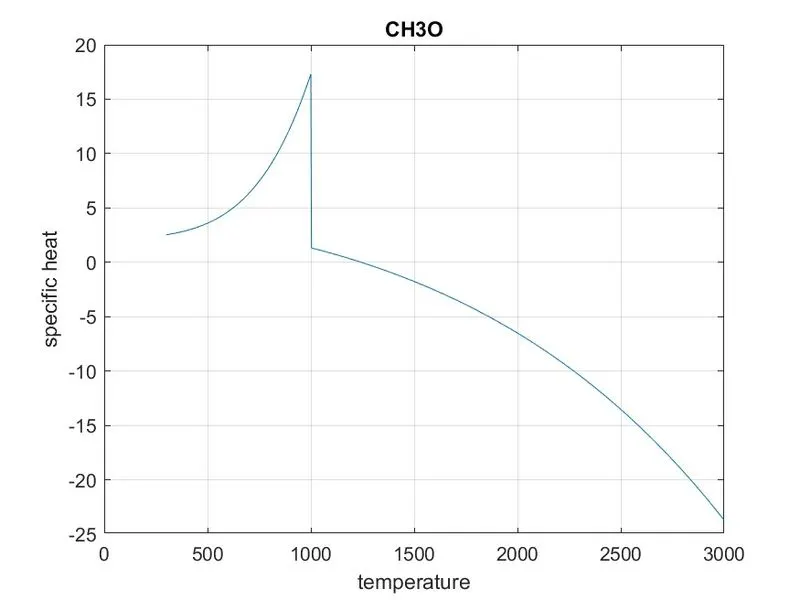
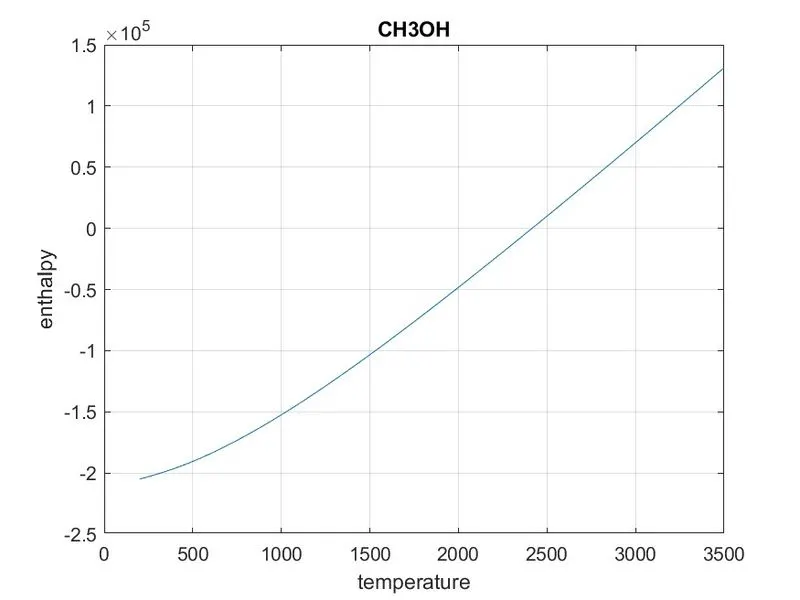
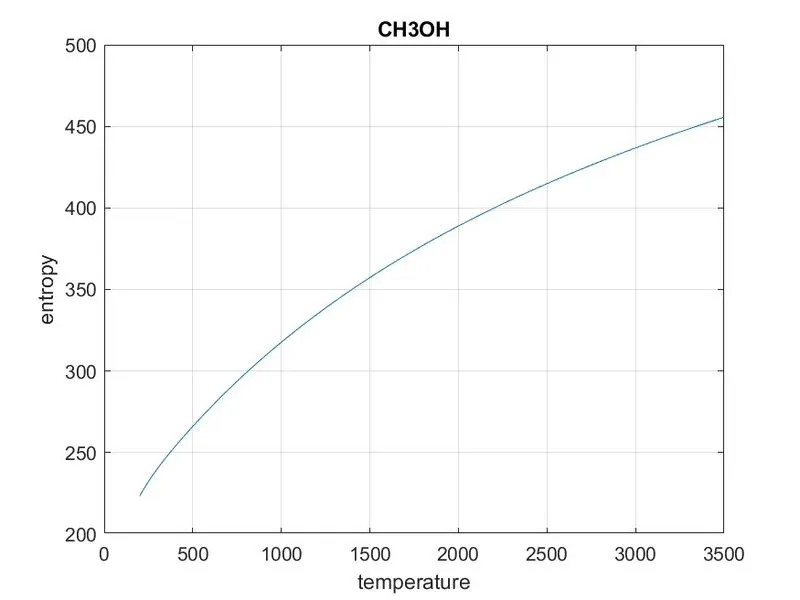
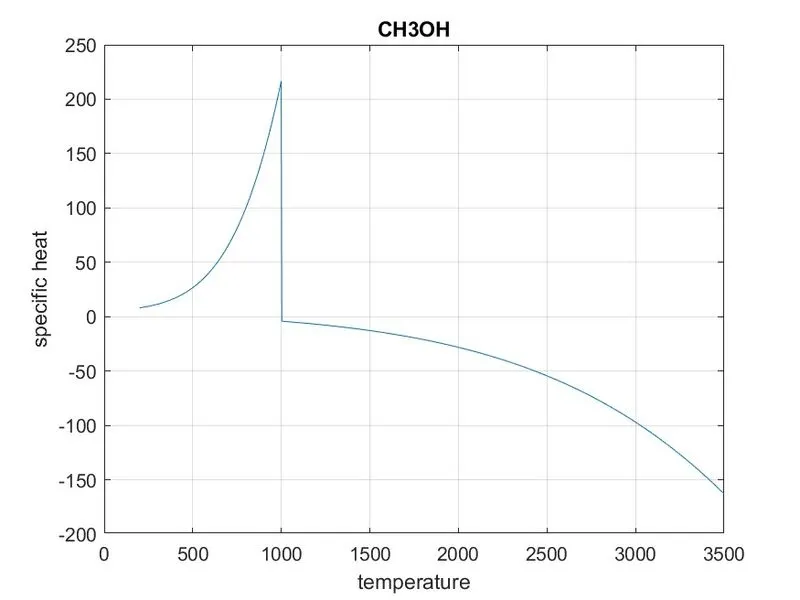
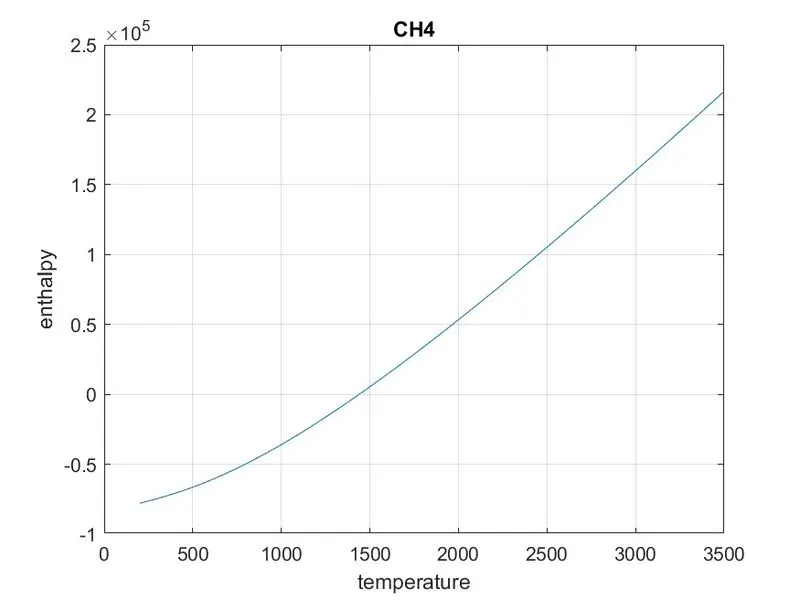
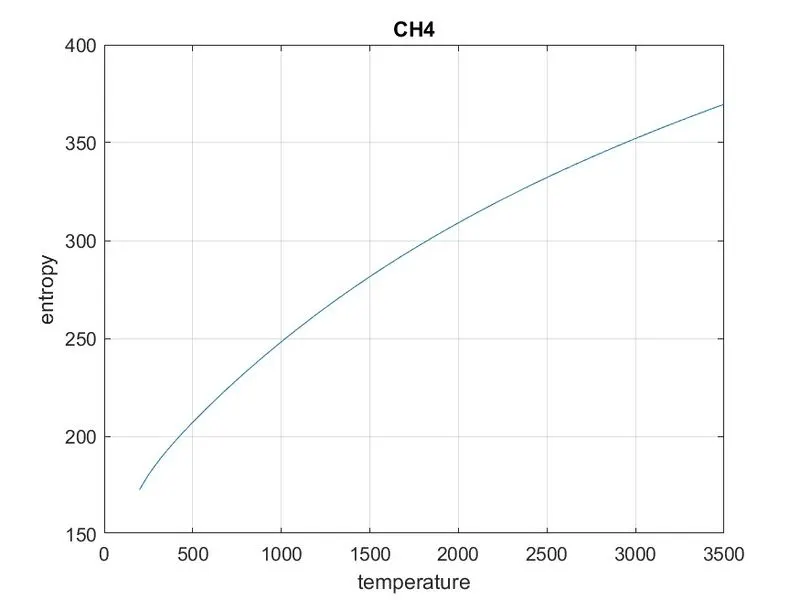
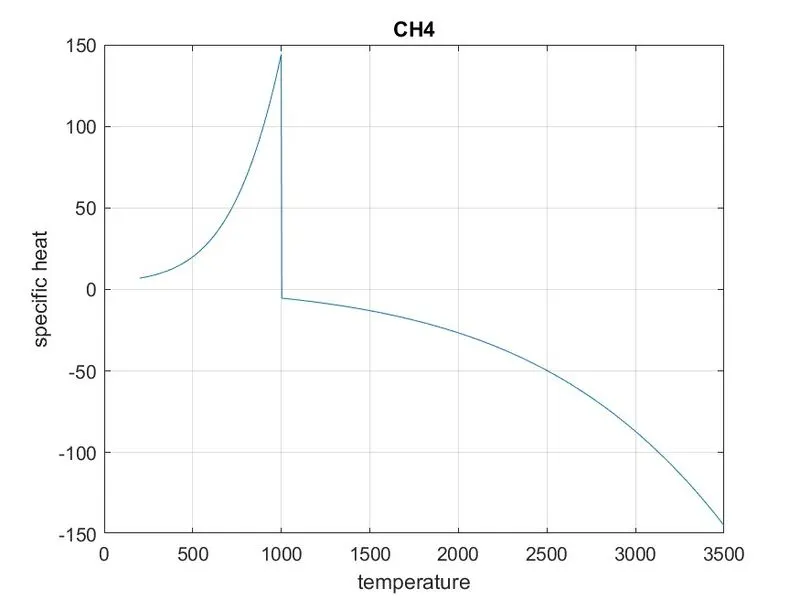
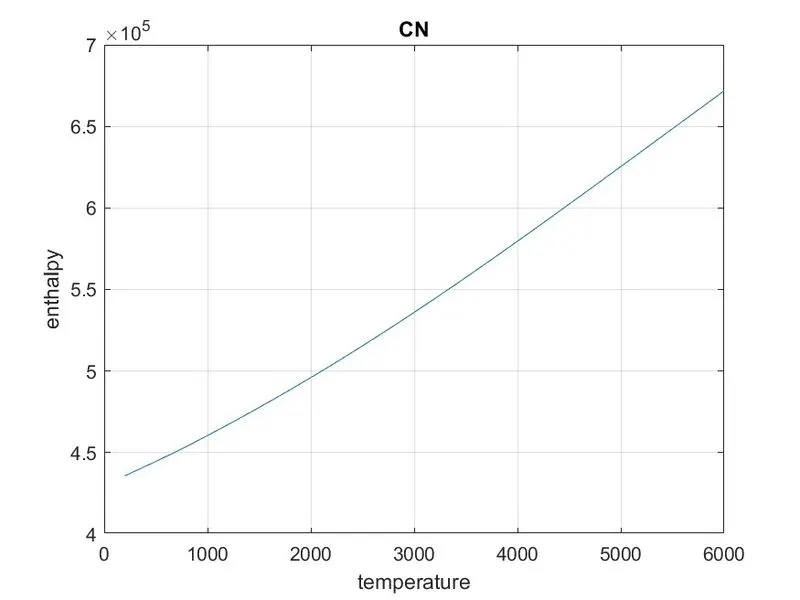
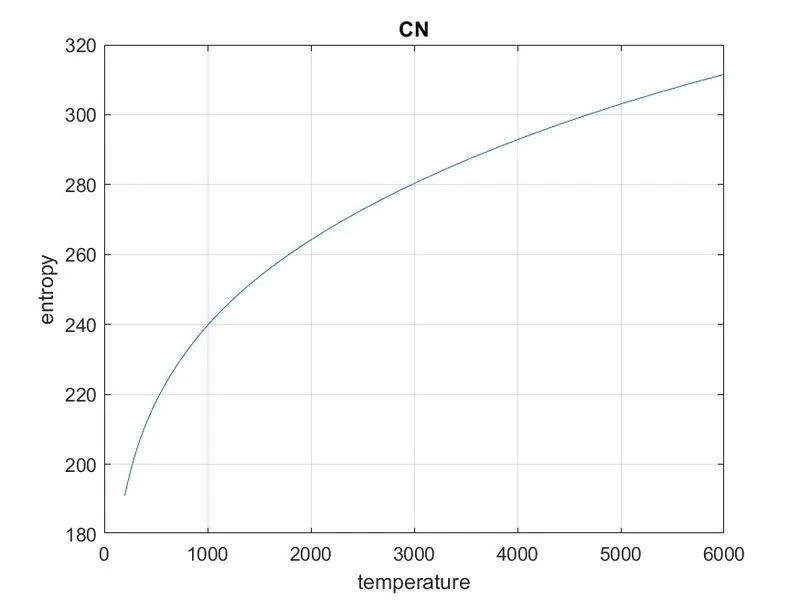
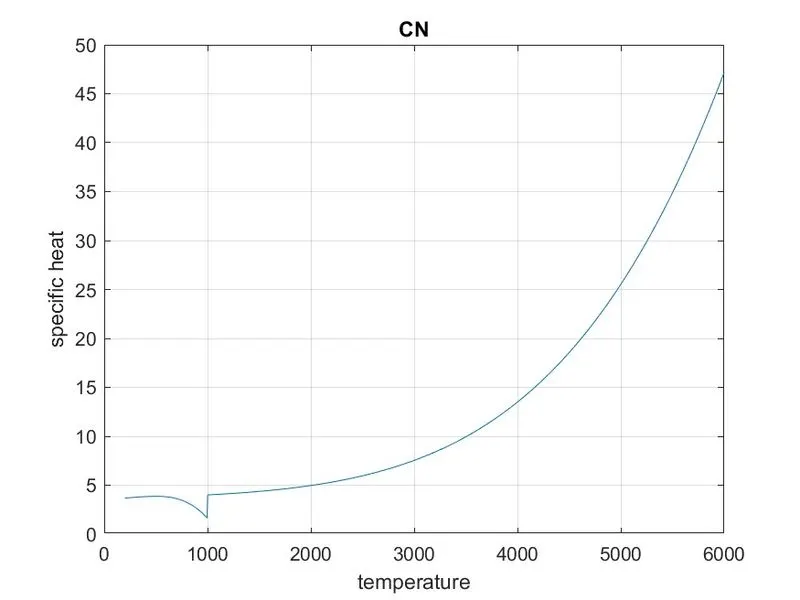
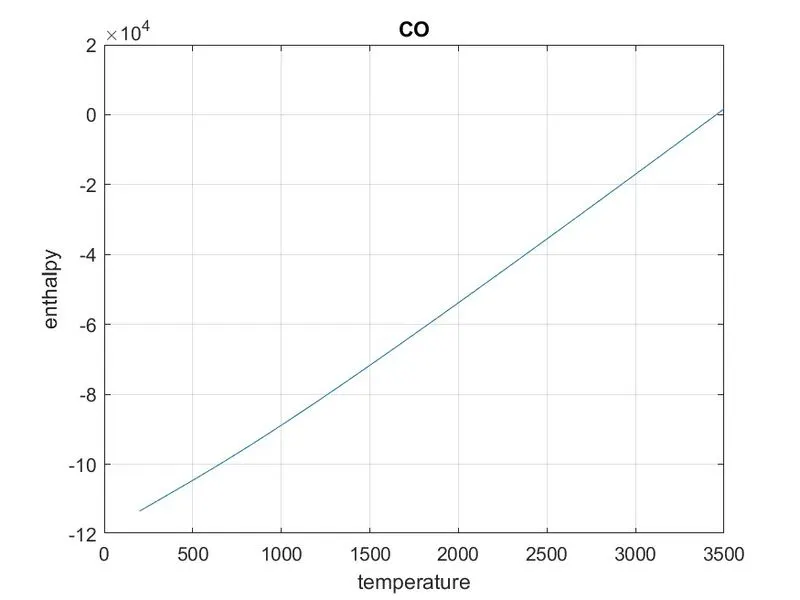
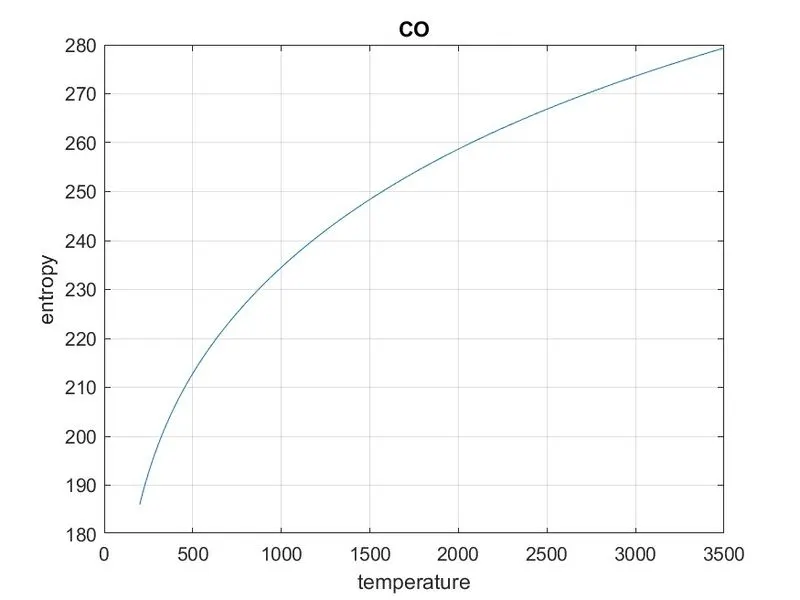
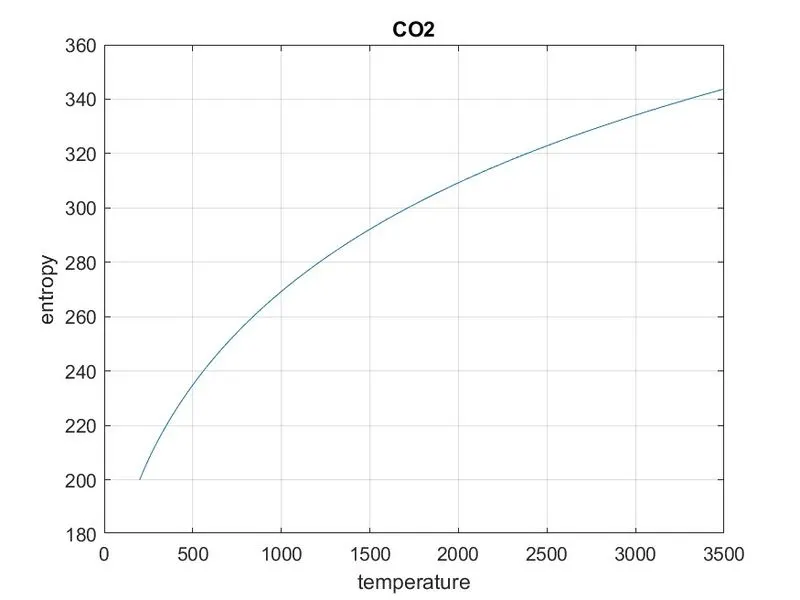
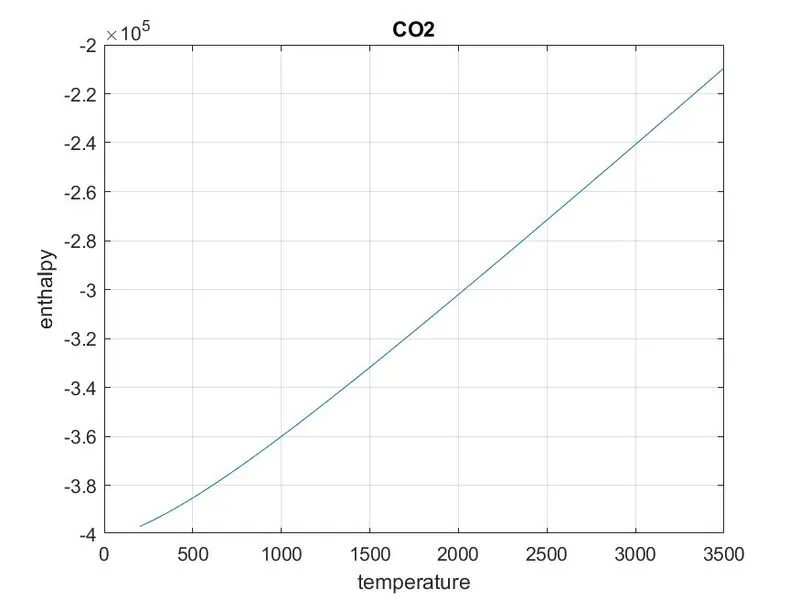
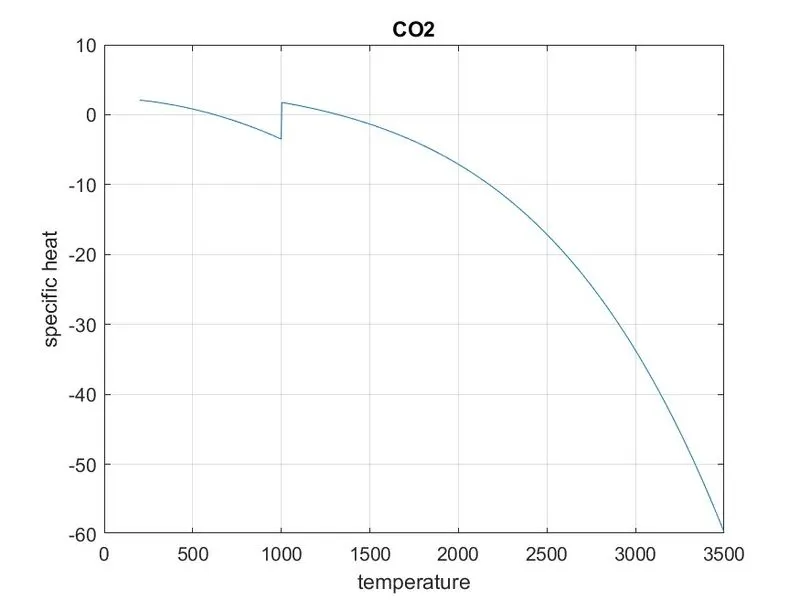
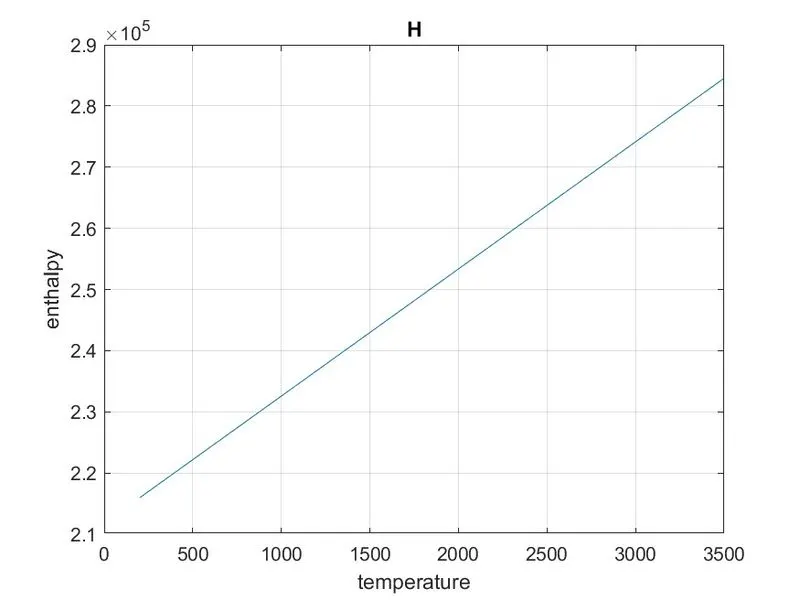
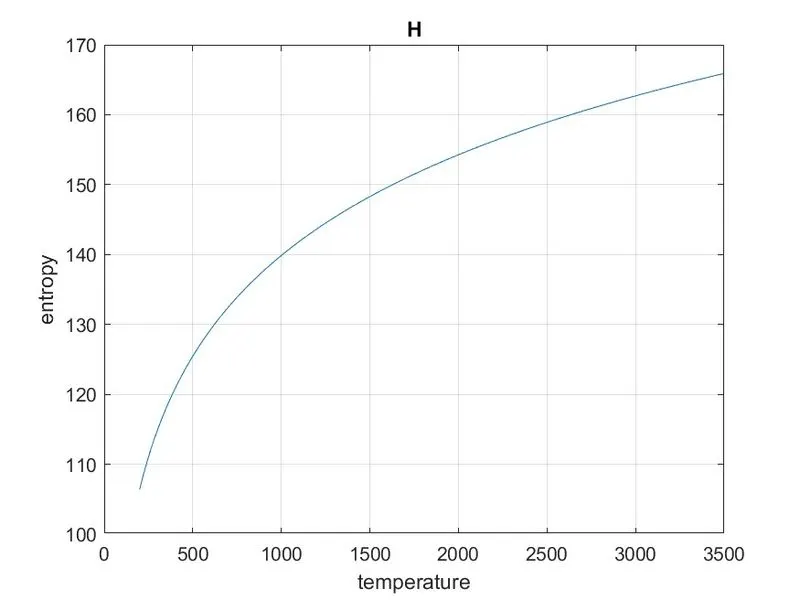
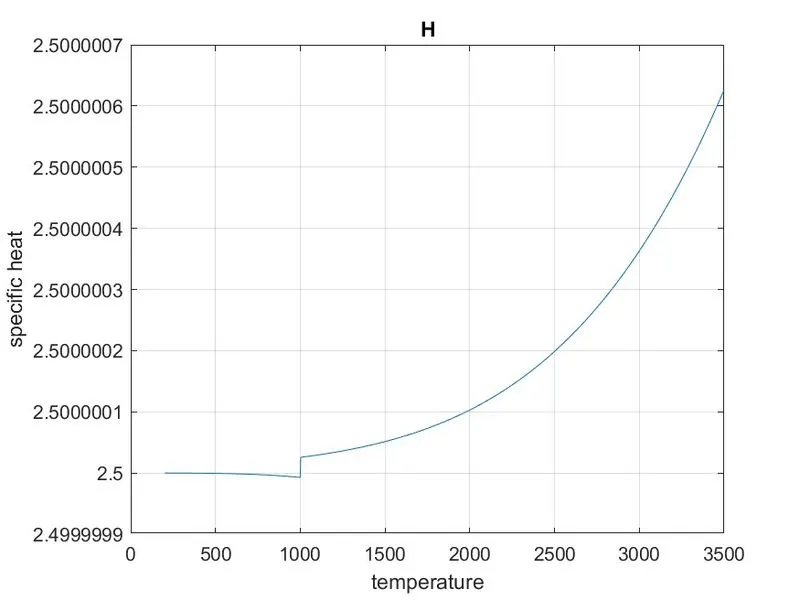
all the outputs are uploaded in the file.......EXPLANATIONS:First of all we create a new script and type that clear all close all clc. getting the data file that can be given in the question named as THERMO that can me save in tht same folder that matlab program as me saved .first we use fopen command to open the thermo file . the reading the header information as A=fget the skipping next threelines create for loop conditions i=1:3 the read the species while calling for loop options nominatee these options then named the temperature as t1,t2,t3 then getting first line coeffecients as a1-a5.line 1 as fget(f1)as the procedure getting the equation about second line coefficients and third line coefficients the create a folder that can be saved in matlab folder copy the ip address of the folder and paste tht in the program that command about mkdir and linspace as t1,t3,100 named as R=8.314.th get array of specific heat ,enthalpy and entropy.as high temperature and low temperature.then we getting into plotting the graph figure 1 as plot (T,cp),figure 2 as plot (T,H),figure 3 as plot (T,S)
then finally use the command as the folder ip address as paste inthe mkdir .changing the directory and saving file as 1 specific heat ,2 as enthapy,3 entropy....then end the for loop and close the file by using fclose (f1) command............