Week 3 - Solving second order ODEs
of 3m/s at t = 0 using Python.
Introduction:
Simple pendulum equation:
`(d^2 theta)/dt^2 + b/m(d(theta))/dt + g/Lsin(theta) = 0`
Where,
g = gravity in m/s2,
L = length of pendulum in m,
m = mass of the ball in kg,
b = damping coefficient
Assuming,
`theta = theta_1`
we get,
`(d(theta))/dt = (d(theta_1))/dt = theta_2` Equation 1
`(d^2(theta_2))/dt^2 =(d^2(theta_1))/dt^2= d/dt((d(theta_1))/dt) = d/dt(theta_2)` Equation 2
Substituting these two equations in the main equation, we obtain
`(d(theta_2))/dt + b/m(theta_2)+g/Lsin(theta_1)=0` Equation 3
Thus, the second-order ODE is converted into the first-order ODE which can now be used in the function.
Code for the program;
Code for plotting the graph
import math
import numpy as np
from scipy.integrate import odeint
import matplotlib.pyplot as plt

# Defining the function that returns dz/dt
def model(theta,t,b,g,l,m):
    theta1 = theta[0]
    theta2 = theta[1]
    dtheta1_dt = theta2
    dtheta2_dt = -(b/m)*theta2 - (g/l)*math.sin(theta1)
    dtheta_dt = [dtheta1_dt, dtheta2_dt]
    return dtheta_dt


# Inputs
b = 0.05
g = 9.81
l = 1
m = 0.1

# Initial conditions
theta_0 = [0,3]   # [displacement,velocity]

# Time points
t = np.linspace(0,10,150)  # Creating a time array

# Solving the ode
theta = odeint(model, theta_0, t, args = (b,g,l,m))  # odeint is a function that integrates ode (system, initial conditions, time, args = (b,g,l,m))

# Plotting the results
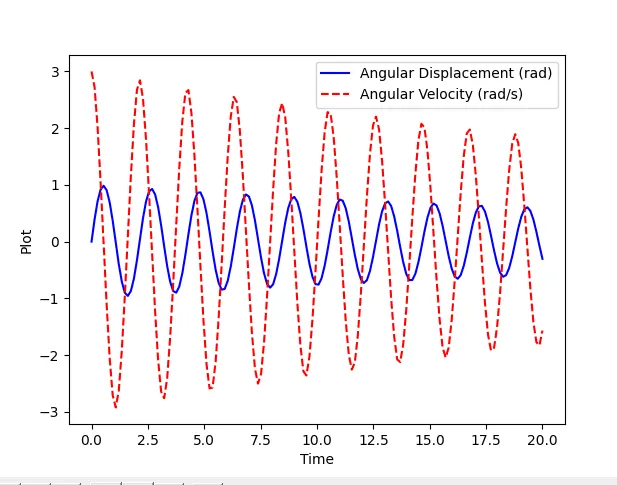
plt.plot(t,theta[:,0],'b-',label=r'$\frac{d\theta_1}{dt}=\theta2$')
plt.plot(t,theta[:,1],'r--',label=r'$\frac{d\theta2}{dt}=-\frac{b}{m}\theta_2-\frac{g}{l}sin\theta_1$')
plt.xlabel('Time')
plt.ylabel('Plot')
plt.legend(('Angular Displacement (rad)','Angular Velocity (rad/s)'), loc='best')
plt.show()
Code for creating the animation:
import math
import numpy as np
from scipy.integrate import odeint
import matplotlib.pyplot as plt

# Defining the function that returns dz/dt
def model(theta,t,b,g,l,m):
    theta1 = theta[0]
    theta2 = theta[1]
    dtheta1_dt = theta2
    dtheta2_dt = -(b/m)*theta2 - (g/l)*math.sin(theta1)
    dtheta_dt = [dtheta1_dt, dtheta2_dt]
    return dtheta_dt


# Inputs
b = 0.05
g = 9.81
l = 1
m = 0.1

# Initial conditions
theta_0 = [0,3]   # [displacement,velocity]

# Time points
t = np.linspace(0,10,150)  # Creating a time array

# Solving the ode
theta = odeint(model, theta_0, t, args = (b,g,l,m))  # odeint is a function that integrates ode (system, initial conditions, time, args = (b,g,l,m))

# Plotting the angular displacement and angular velocity
# Angular displacement = theta_1
ct = 1
theta_1 = theta[:,0]
for t in theta_1:
    x1 = l*math.sin(t)
    y1 = -l*math.cos(t)
    x0 = 0
    y0 = 0

    filename = str(ct) + 'ode.png'
    ct+=1

    plt.figure()

    # Plotting the hinge line xlimit(-0.5 to 0.5), ylimit = (0,0)
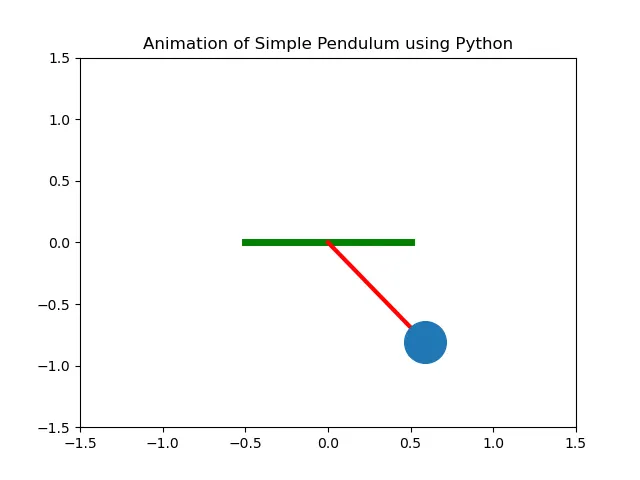
    plt.plot([-0.5,0.5],[0,0],'g',linewidth=3)

    # Plotting the support for bob from hinge (x0,x1),(y0,y1)
    plt.plot([x0,x1],[y0,y1],'r',linewidth=3)

    # Plotting the bob at (x1,y1)
    plt.plot(x1,y1,'o',markersize=30)

    # Setting up the pendulum oscillation limit
    plt.xlim([-1.5,1.5])
    plt.ylim([-1.5,1.5])
    plt.title('Animation of a Simple Pendulum using Python')

    # Saving the plot file as .png
    plt.savefig(filename)
Code explanation:
- Import the following modules - ‘numpy, ‘scipy’, ‘math’, ‘matplotlib.pyplot’, ‘odeint’ to perform the necessary functions.
- Specify the initial angular displacement and initial angular velocity along with the parameter b,g,l,m needed to solve the ODE equation.
- Use np.linspace command to run the motion for 20seconfds with 150 iterations.
- Use ‘odeint’ command to perform the ode solver function and store the value in theta in the form of an array and columns where theta[:,0] is for the angular displacement and theta[:,1] is for the angular velocity.
- For creating an animation, use a counter variable to change the position of the pendulum wrt time by assigning a variable t in theta_1(displacement)in the for loop.
- The position of the bob, hinge and support are placed using the x0,y0 and x1,y1 values.
- The x and y limits are also set to contain the pendulum movement to a certain distance.
- Save the figures in png format by using the counter variable as the filename such that fo every iteration each file is generated and then they are stitched together using ImageMagick.
- To create the animation of these images, open command window or Cygwin terminal and use cd command to locate the folder containing the images.
- Type ls to list all the content of the folder.
- Now, use convert * Simple pendulum.gif and a gif will be created in the designated folder. The gif file can be easily converted to a video.
Outputs:
Youtube link - https://youtu.be/47wfCa9eTmo