Python Challenge - Solving second order ODEs
Second-order ODE Project
Aim - write a program that solves the following ODE. This ODE represents the equation of motion of a simple pendulum with damping.
Solution:
In this project, we will write the code for a simple pendulum with spring, mass, and damper system by a second-order ODE as
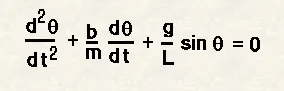
The Simple Pendulum:
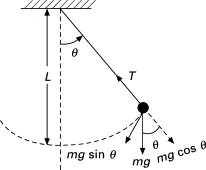
We will solve for the value of theta(Ɵ) w.r.t time(t), where
b= damping coefficient
m= mass of the ball in kg
L=length of the pendulum in m
g= gravity
Concept:
We will break down this second-order ODE to lower-order i.e., first order.
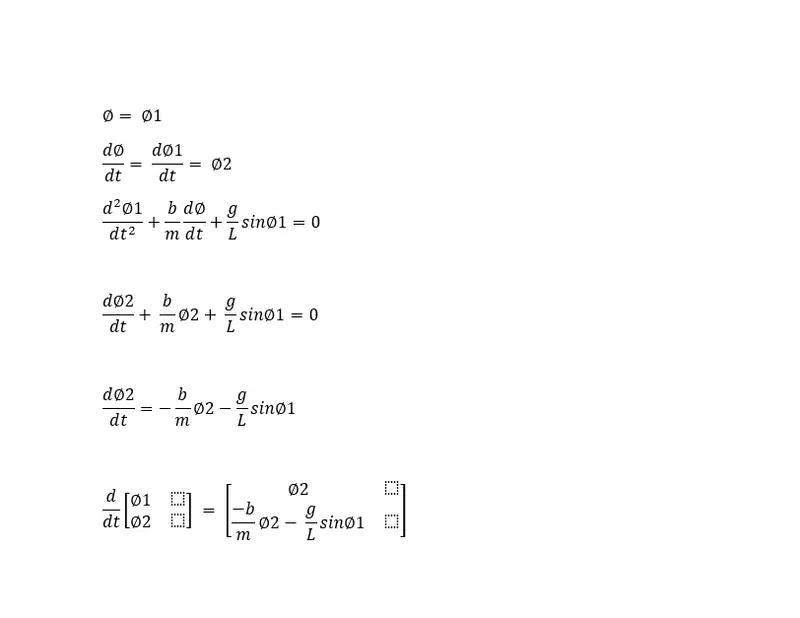
Code:
import numpy as np
from scipy.integrate import odeint
import matplotlib.pyplot as plt
import math

#Defining the function
def model(theta,t,b,g,l,m):

	theta1 = theta[0]
	theta2 = theta[1]
	dtheta1_dt = theta2
	dtheta2_dt = -(b/m)*theta2 - (g/l)*math.sin(theta1)
	dtheta_dt = [dtheta1_dt, dtheta2_dt]
	return dtheta_dt

b = 0.05
g = 9.81
l = 1
m = 1

#initial condition
theta_0 = [math.pi/2,0]

#time points
t = np.linspace(0,20,150)

#Solve ODE
theta = odeint(model,theta_0,t,args = (b,g,l,m))

#Plot result
plt.figure(1)
plt.plot(t,theta[:,0],'b-')
plt.plot(t,theta[:,1],'r--')
plt.show()

x = theta[:,0]
ct = 1
for pos in x:
	x1 = 0
	y1 = 0
	x2 = l*math.sin(pos)
	y2 = -l*math.cos(pos)
	plt.figure(2)
	plt.plot([-2,2],[0,0],linewidth = 5)
	plt.plot([x1,x2],[y1,y2],linewidth = 3)
	plt.plot(x2,y2,'o',markersize=15)
	plt.xlim([-2,2])
	plt.ylim([-2,2])
	filename = 'test%05d.png' %ct
	plt.savefig(filename)
	ct = ct+1
	plt.show()
Code Explanation:
Givens
- b= 0.05
- m= 1
- L=1
- Time interval = 0-20
- Angular displacement=0
- Angular velocity=3
Calculating
- For solving second order ODE, initial conditions should be given which are initial displacement of pendulum=0 and initial velocity=3m/s
- We will solve the second-order differential equation by defining the function model.
- In the interval of 20s, we have taken the 150 values by using the command ‘linspace’.
- We will now use command odeint which is an inbuilt command for solving a differential equations.
- Plotting the graph.
- Then, we will use the for loop, and ct command is used to change loop irritation after every motion, using marker command we can create the bob of the pendulum.
- For animating the images I’ve used the Imagemagick.
- Firstly search the folder Images where all the images of the pendulum have been saved in the command prompt.
- Now, using the command ‘magick *.png animation.gif’ we can convert all images into a gif file.
Errors faced while
Got some problems in for loop then contacted for a one-to-one session then is get resolved and some typo error.
Result:
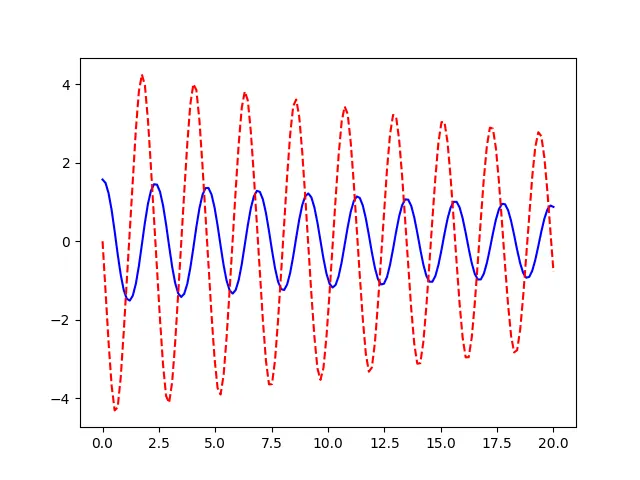
Animation Link:
https://drive.google.com/file/d/1xxoCekHSETBuik3ixbXFgabKcuTM4gRH/view?usp=sharing