Week 3 - Pitot tube
PITOT TUBE
Aim:
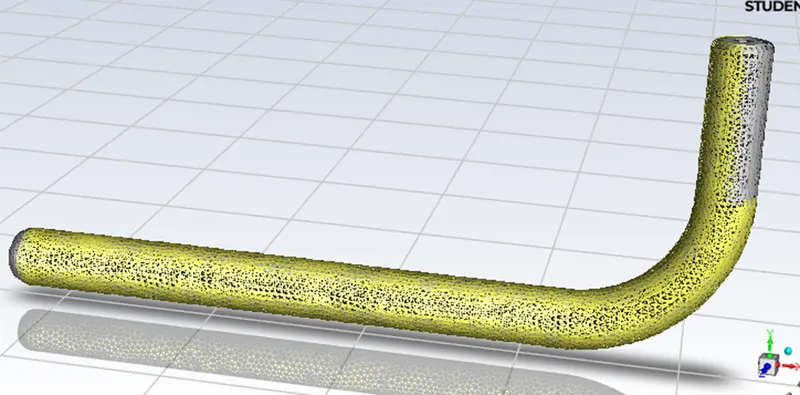
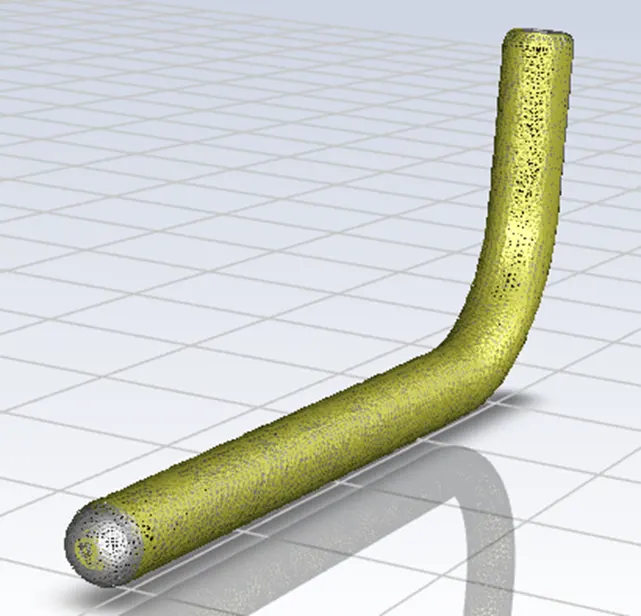
- A pitot static tube geometry is attached below.
- You are required to do a literature review of Pitot - static tube. Also establish a relationship between Total (stagnation) pressure and static pressure
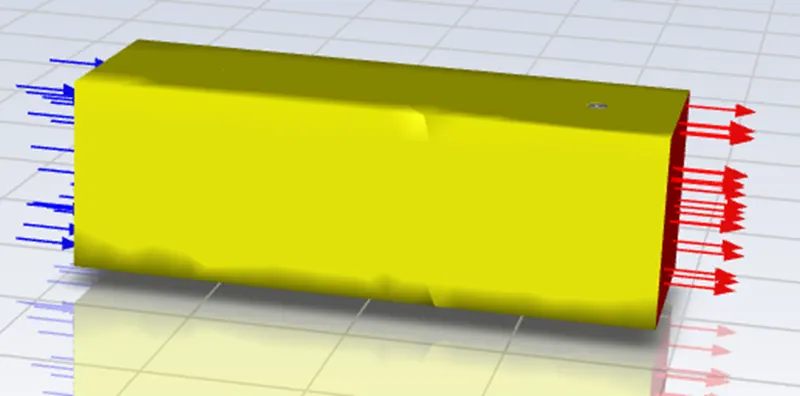
- You are required to create surfaces and fill it separately for Total pressure port and static pressure port as shown below.
- For the values of velocity given below calculate the total and static pressures and find the error in percentage for velocity.
Velocity (m/s) Gauge pressure (pa)
240 -2817
100 33287
62 65780
Theory:
Pitot tube:
A pitot tube, also known as a pitot probe, is a flow measurement device used to measure fluid flow velocity. The pitot tube was invented by the French engineer Henri Pitot in the early 18th century and was modified to its modern form in the mid-19th century by French scientist Henry Darcy. Pressure measurement is used for other readings for the pilot namely in altimeter and airspeed Measurement.
Pitot tubes are used for fluid flow measurement to find the velocity of the boat in water, the velocity of aircraft, and the velocity of gases in industries. Pitot tubes actually measure the pressure that is used in calculating the velocity of the fluid or body. Pitot tubes will not calculate the velocity directly. There are commonly three types of pitot tubes.
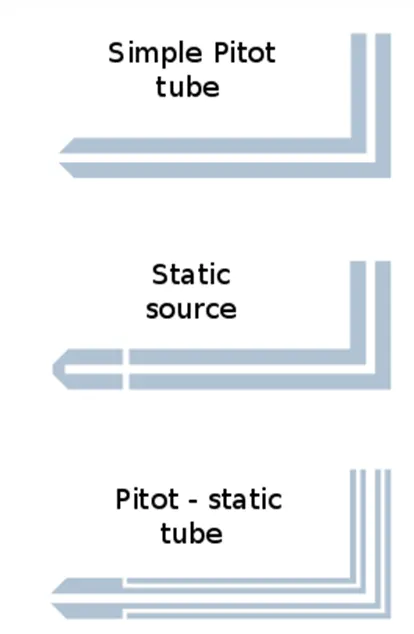
Theory of operation:
- The basic pitot tube consists of tube pointing directly into the fluid. As this tube contains fluid, a pressure can be measured.
- The moving fluid is brought to rest (stagnates) as there is no outlet to allow flow to continue.
- This pressure is the stagnation pressure of the fluid, also known as the total pressure or particularly in aviation the pitot pressure.
- The measure atagnation pressure cannot itself be used to determine the fluid flow velocity (airspeed in aviation). However, Bernoulli’s states.
Difference in static and total pressure:
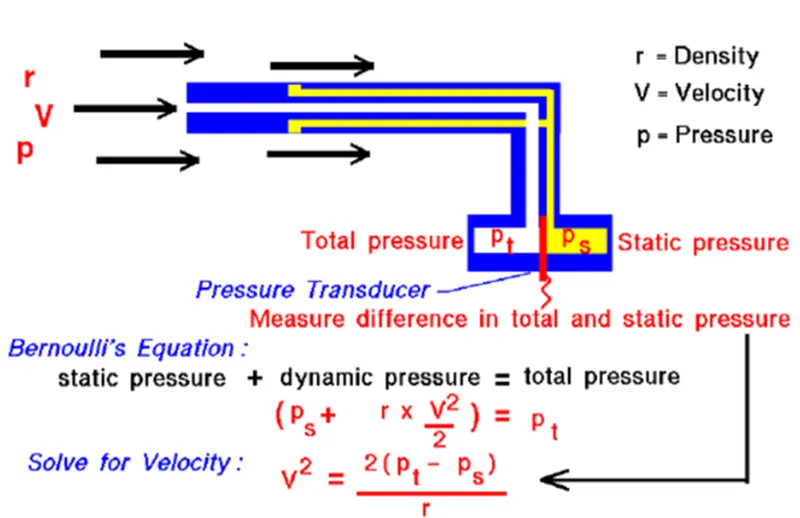
Since the outside holes are perpendicular to the flow of air, these tubes are pressurized by the local random component of the air velocity. The pressure in these tubes is the static pressure.
The center tube, however, is pointed in the direction of travel and is pressurized by both the random and the ordered air velocity.
The pressure in this tube is the total pressure discussed in Bernoulli's equation. The pressure transducer measures the difference in total and static pressure.
Measurement = pt – ps
Stagnation pressure = static pressure + dynamic pressure (the equations are shown in below picture)
The relation between the static pressure total pressure and the velocity of the fluid:
With the difference in pressures measured and knowing the local value of air density (r) from pressure and temperature measurements, we can use Bernoulli's equation to give us the velocity.
Bernoulli's equation states that the static pressure plus one-half the density times the velocity (V) squared is equal to the total pressure.
Ps + [ (1/2) ⋅ r ⋅ (V^2) ] = Pt
Solving for V:
V^2= [2 ⋅(Pt-Ps) ] / r
NOTE: The above equation applies only to fluids that can be treated as incompressible. Liquids are treated as incompressible under almost all conditions. Gases under certain conditions can be approximated as incompressible.
Geometry:
Case setup:
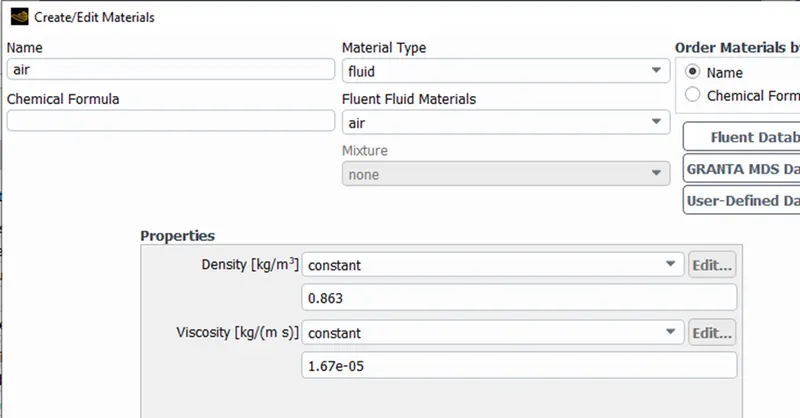
Material selection:
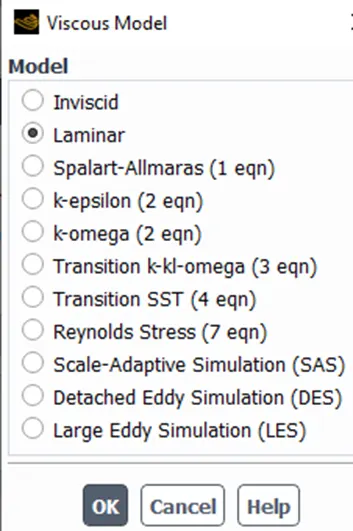
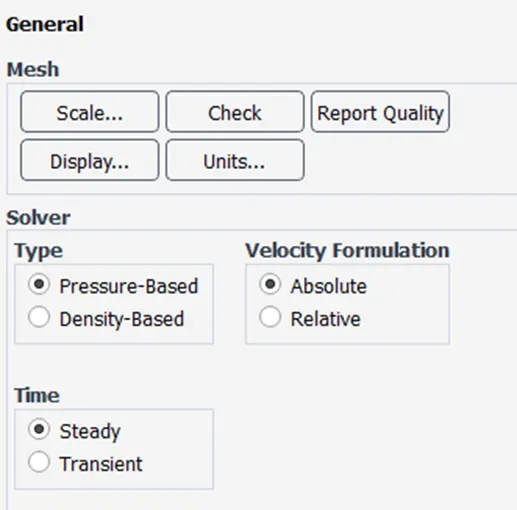
Physics set-up:
Boundary condition:
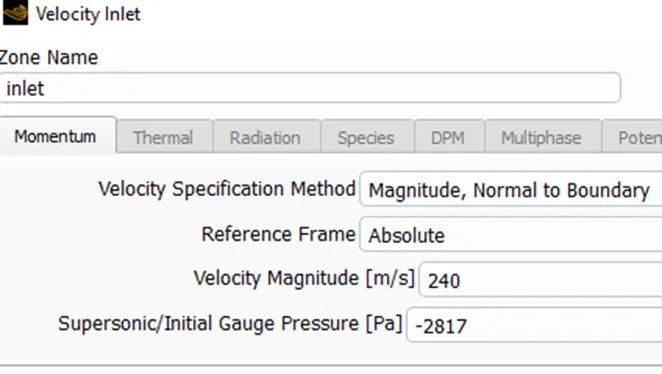
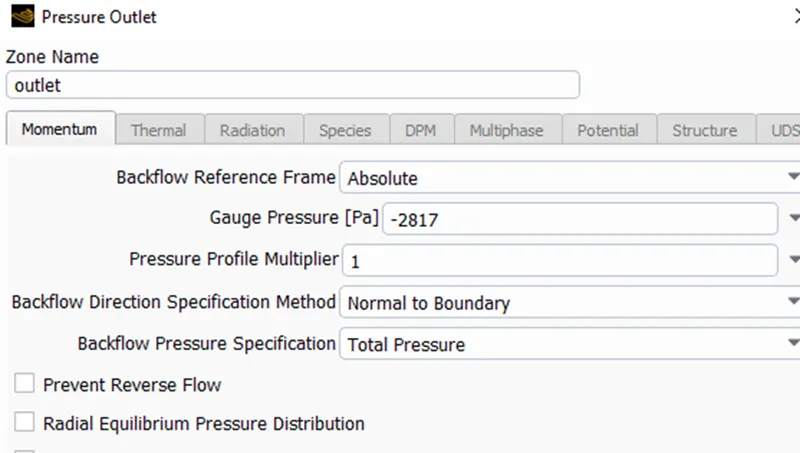

Initialization:
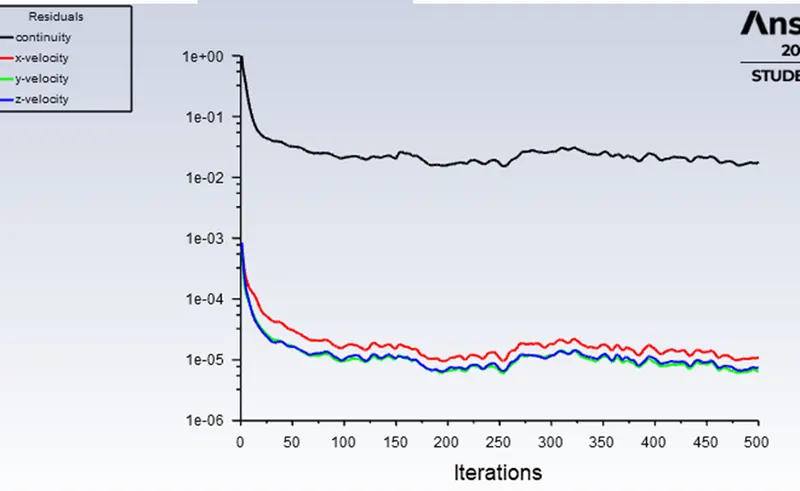
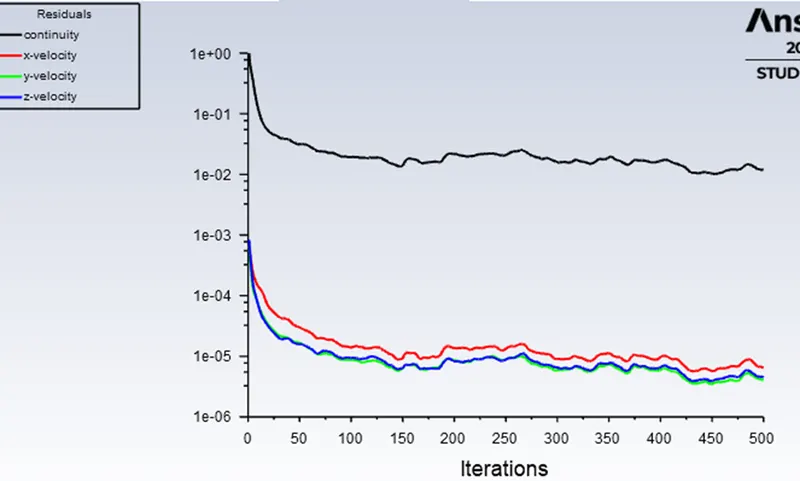
The convergence criterion is set to 1e-3.FMG- initialization.
Results:
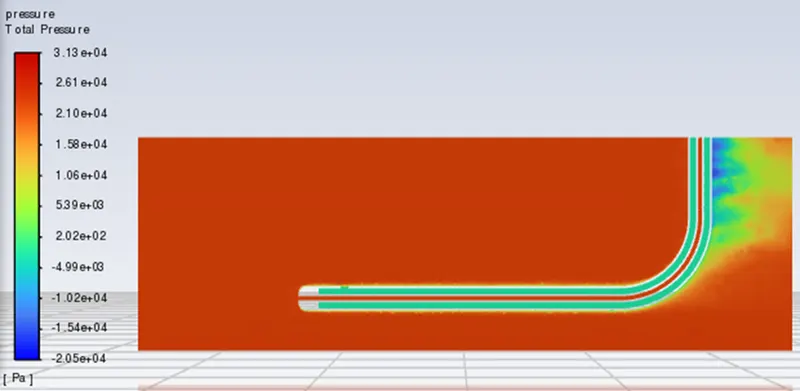
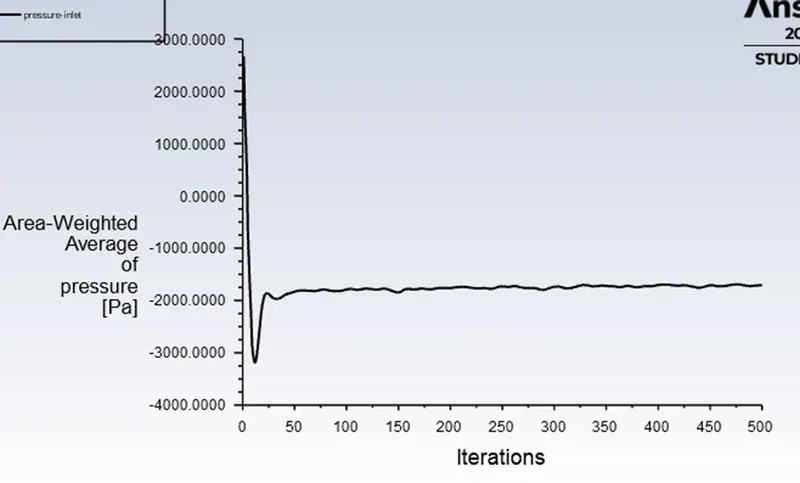
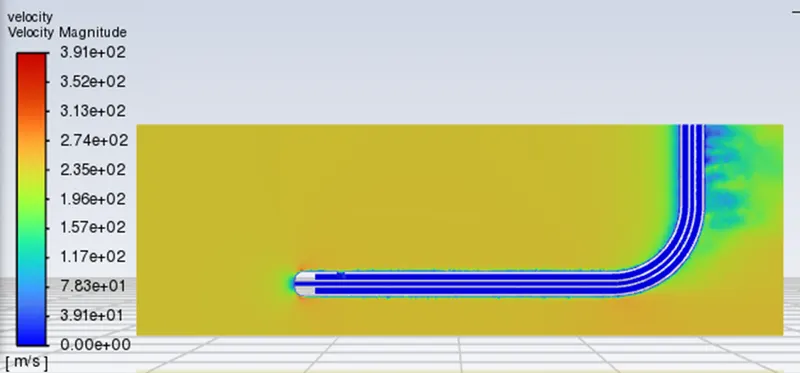
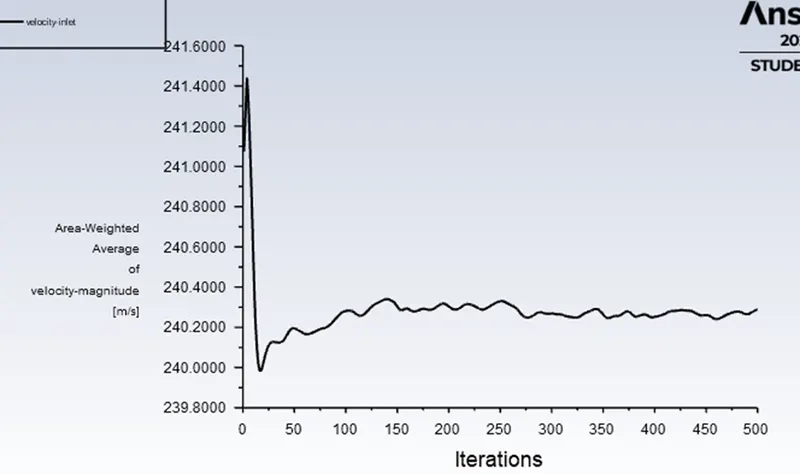
Case-1: velocity = 240 m/s, pressure = -2817 pa.
Residuals:
Pressure:
Total pressure:
Static pressure:
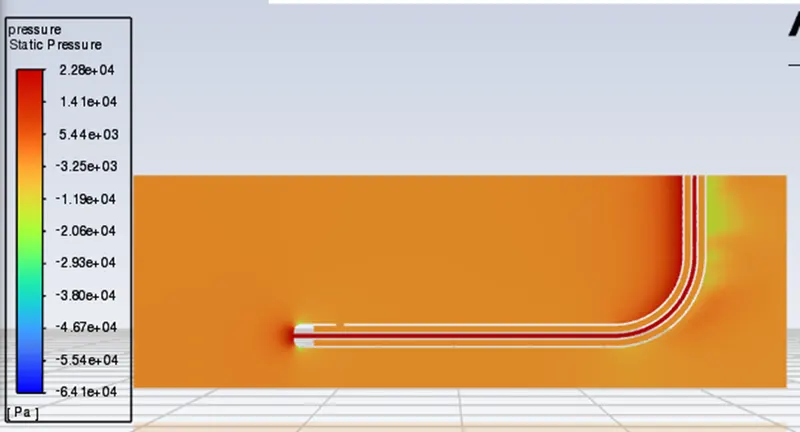
Pressure plot:
Velocity contour:
Velocity plot:
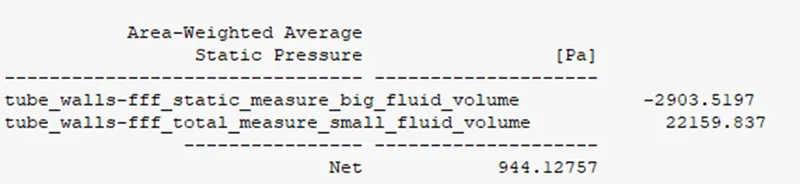
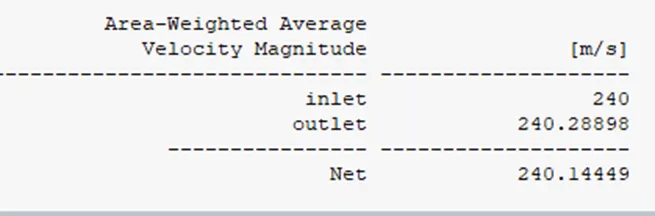
Velocity (Vth) = [2 ⋅(Pt-Ps) ] / r}^(1/2).
= (2*(22159.837 – (- 2903.5197) / 0.863)^ ½.
= 228.097.
Error = 100% - [Vth / Ve *100]
= 100-(0.9540*100)
= 4.96
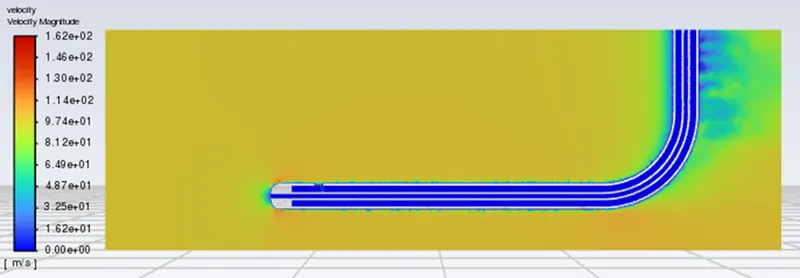
Case- 2: velocity = 100 m/s, pressure = 33287 pa
Residuals:
Pressure:
Static pressure:
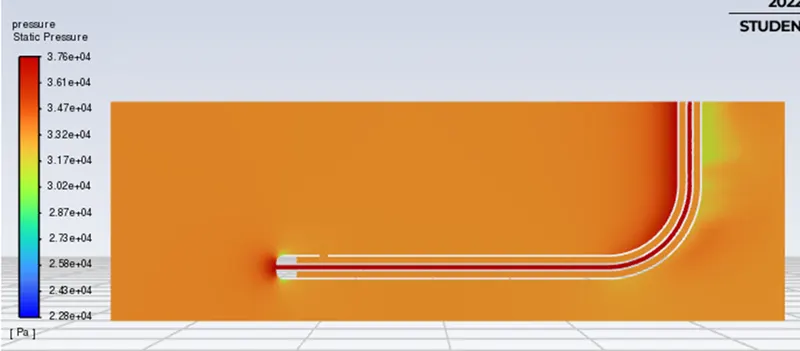
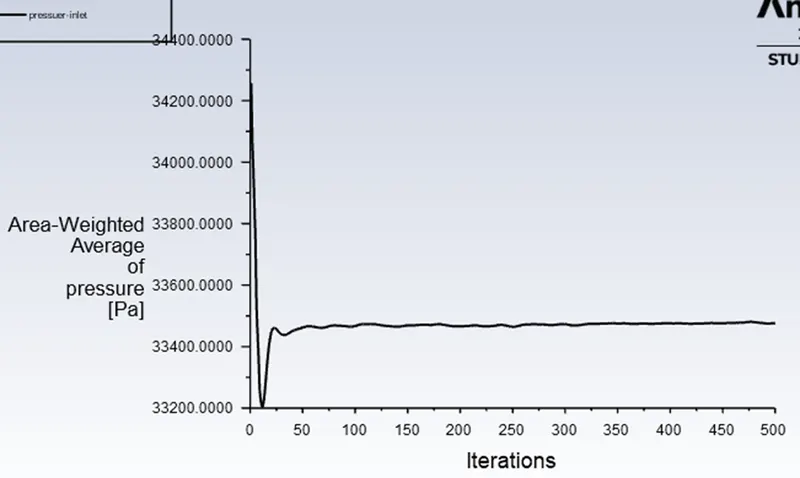
Total pressure:
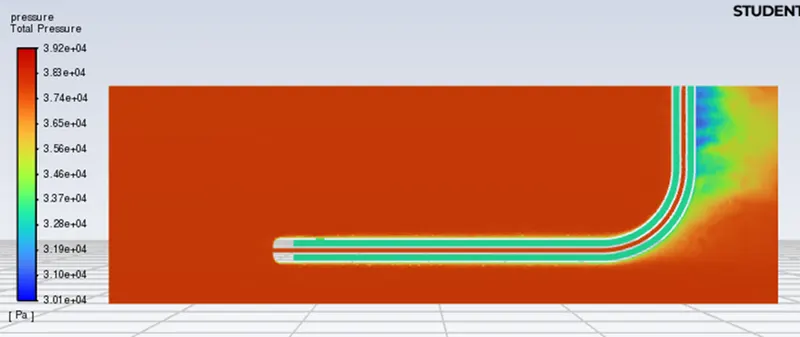
Pressure plot:
Velocity contour:
Velocity plot:
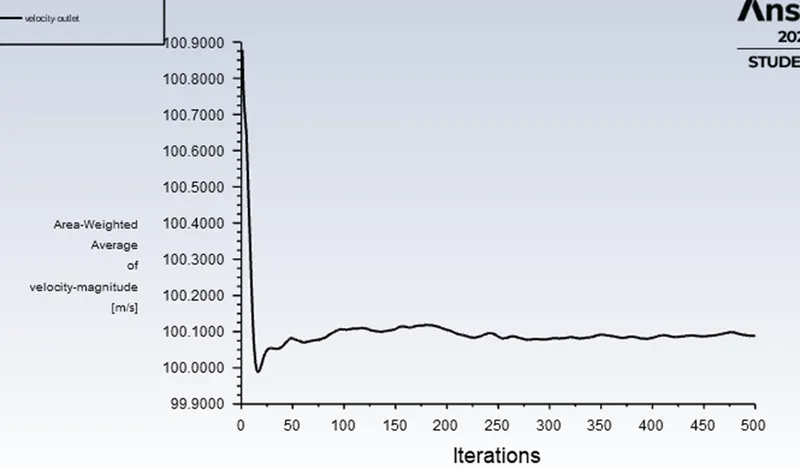
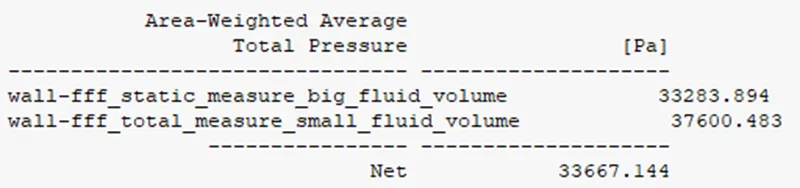
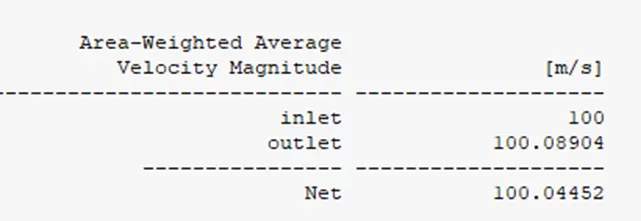
Velocity (Vth) = [2 ⋅(Pt-Ps) ] / r}^(1/2).
= (2*(37600.483 – 33283.894 / 0.863)^ ½.
= 100.0184
Error = 100% - [Vth / Ve *100]
= 100 - (1*100)
= 0.2
Case- 3: velocity = 62 m/s, pressure = 65780 pa
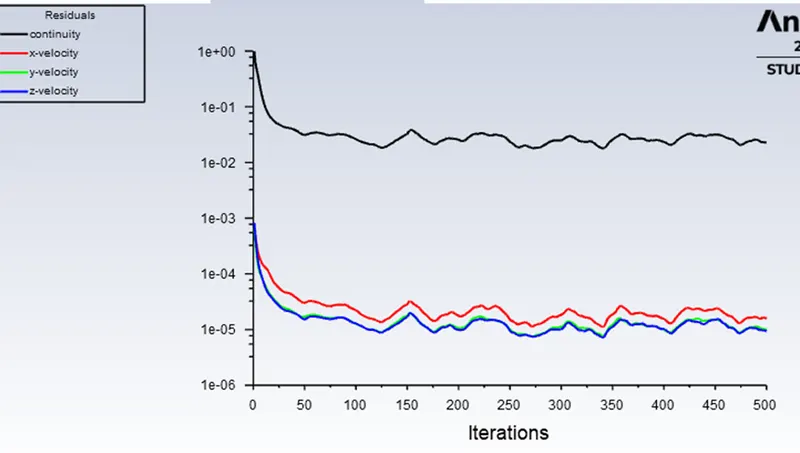
Residuals:
Pressure:
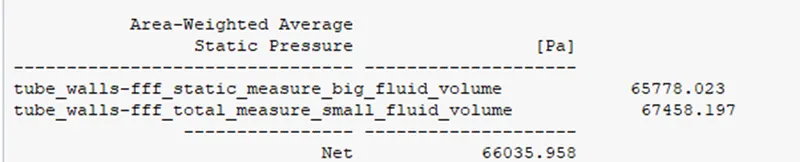
Static pressure:
Total pressure:
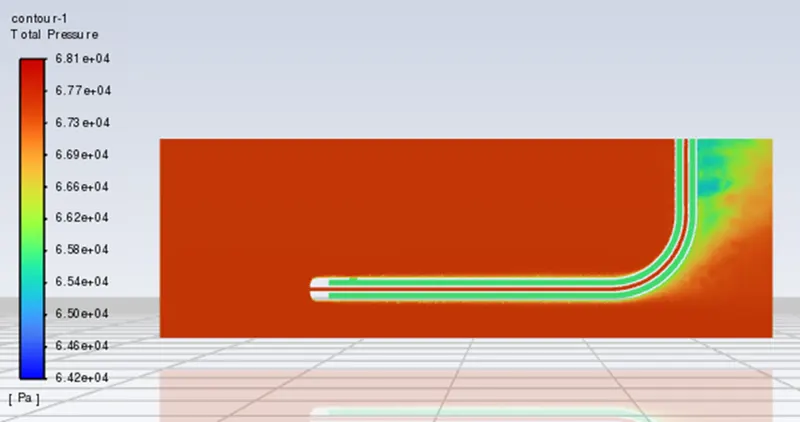
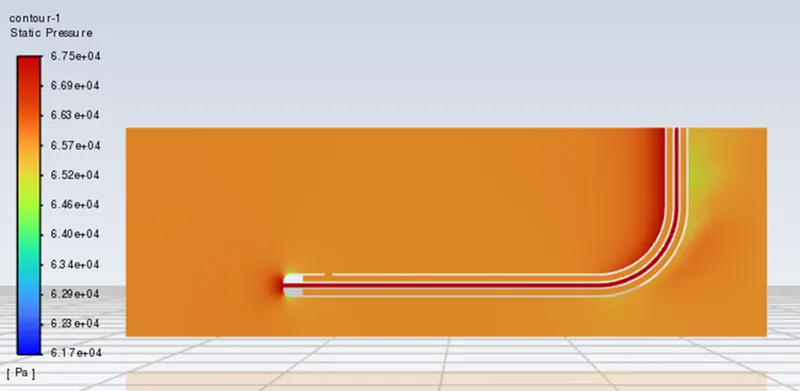
Pressure plot:
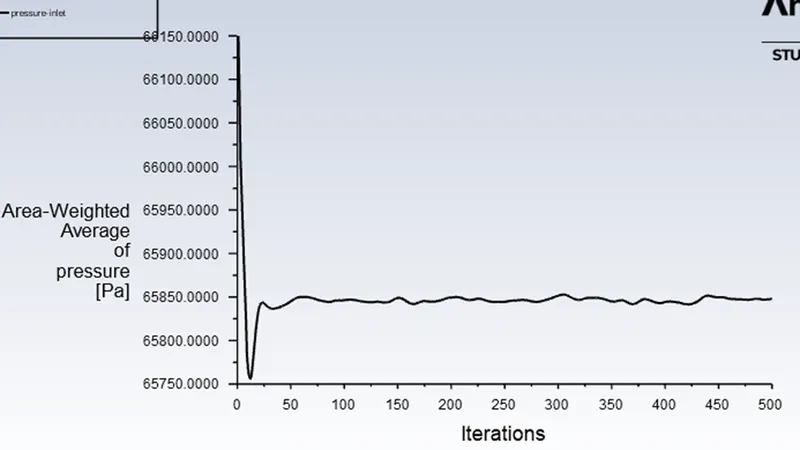
Velocity contour:
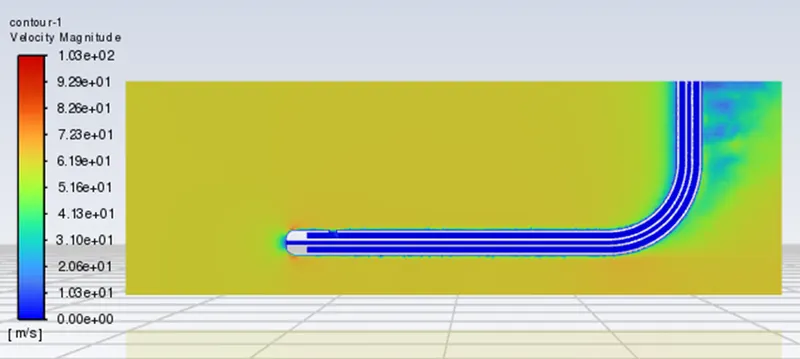
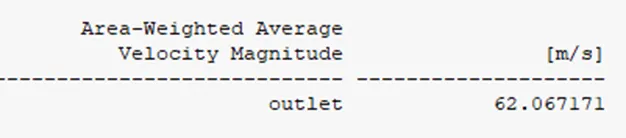
Velocity plot:
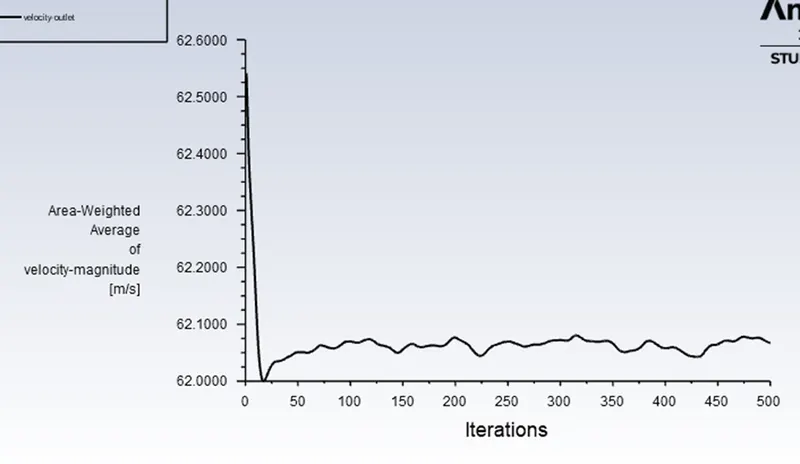
Velocity (Vth) = [2 ⋅(Pt-Ps) ] / r}^(1/2).
= (2*(67458.197 – 65778.023) / 0.863)^ ½.
= 62.40030
Error = 100% - [Vth / Ve *100]
= 100 - (1.0064*100)
= 0.64
Conclusion:
The pitot tube simulation is carried out with different velocities to predict the static and total pressure at outlet. The variation of error is marginal and lies within the acceptable region.