Week 3 - External flow simulation over an Ahmed body.
AIM- External flow simulation over and Ahmed Body. Determining Forces and velocity acting on body (Drag coeffcient , Lift coefficient velocity etc) and perform grid independent test.
Results Expected
- Velocity and Pressure contours.
- The Drag coefficient & Lift coefficient for grid independent cases.
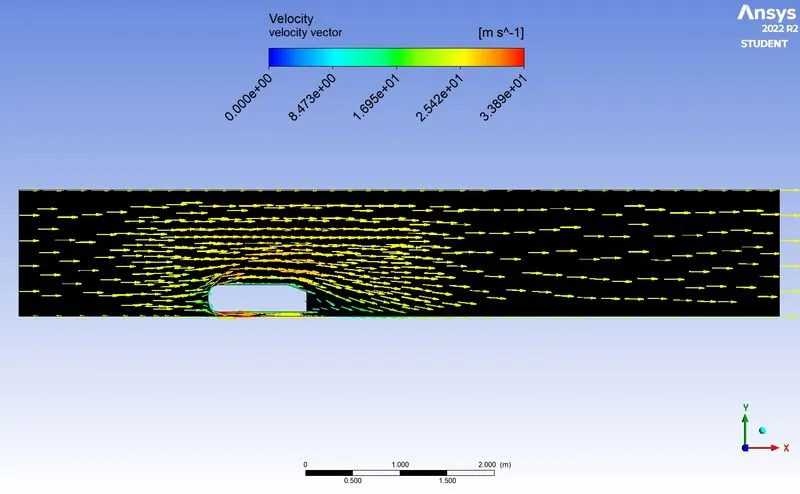
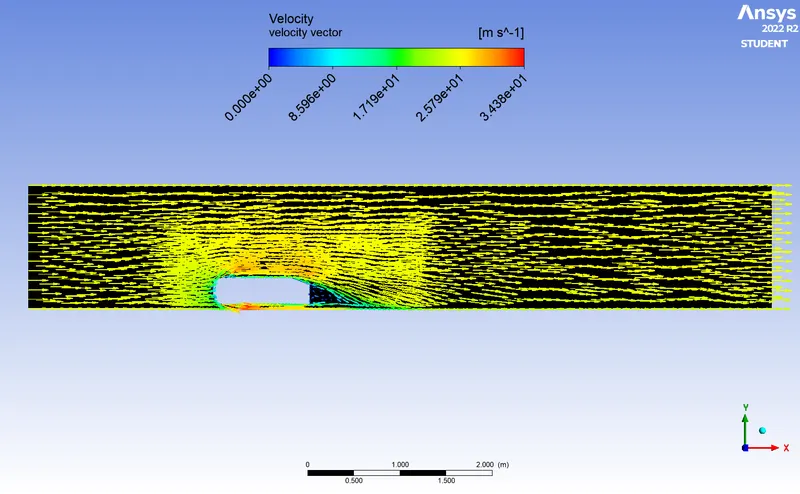
- Vector plot showing Wake region.
- Provide values for each grid independent cases.
THEORIES
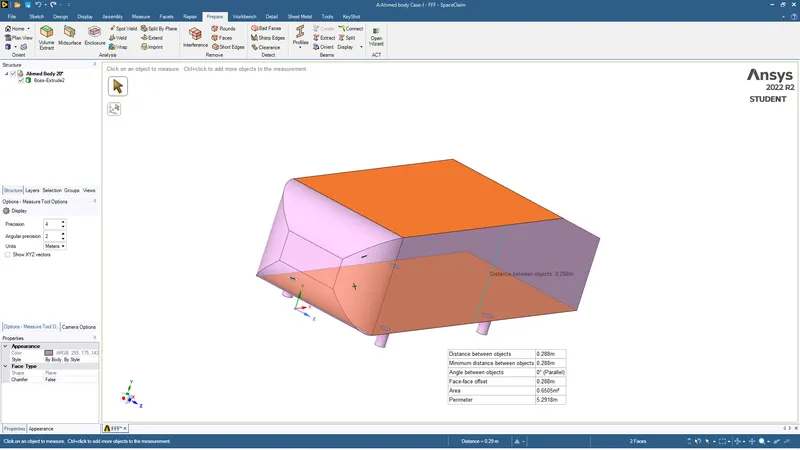
Ahmed Body: It was created by S.R ahmed .Its main purpose was to act as aerodynamic simulation tool which can give us scientific data for Real life usage aerodynamic act validation.The sketch below shown has length of 1.044 m, Height of 0.288 metres and Width of 0.389 m & cylinderical legs of 50 mm size.
The flow for the model is turbulent which is based on velocity and body length for default mesh size fo which ANSYS Fluent will use k-epsillon model.
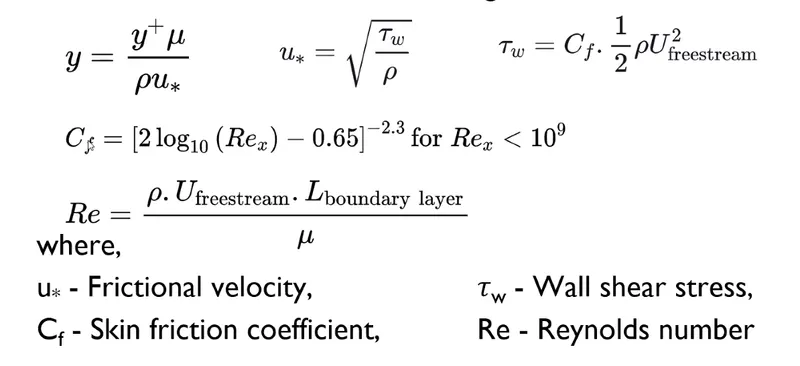
The Selction of Model is based on Y+ model which is notjing but behaviour study of flow near the wall .In general terms when we need details regarding viscous forces and implications on wall we use k-omega model and when our focus is on outlet of flow we use k-epsilon. The calculation can be done as shown below
IMPORTANCE OF AHMED BODY
The drag force is an important foctor considering fuel consumption. As the drag force increases fuel consumtion which is main issue for consumer. As fossils fuels are becoming an issue due to its shortage.
As drag force is dependent on frontal area different designs can give different output thats where the Ahmed body is important for validating the simulating tools. Taking ahmed bosy as prortotye data we try to minimize frontal Area and drag , Also find optimum clearence so Lift force is also reduced.
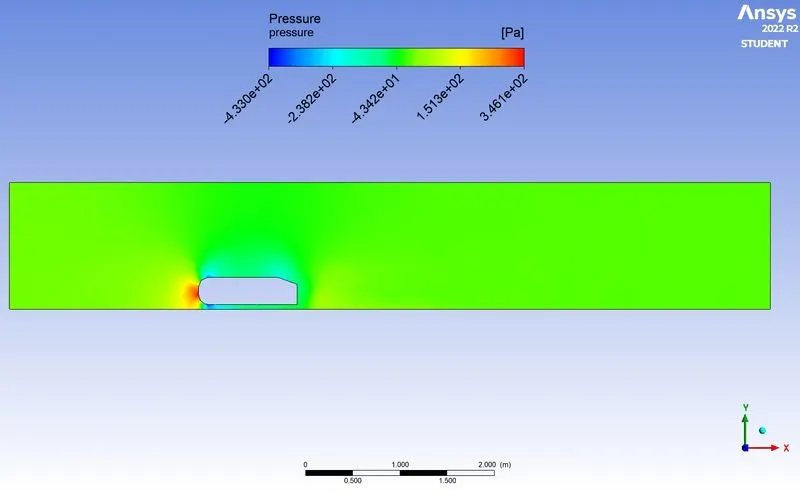
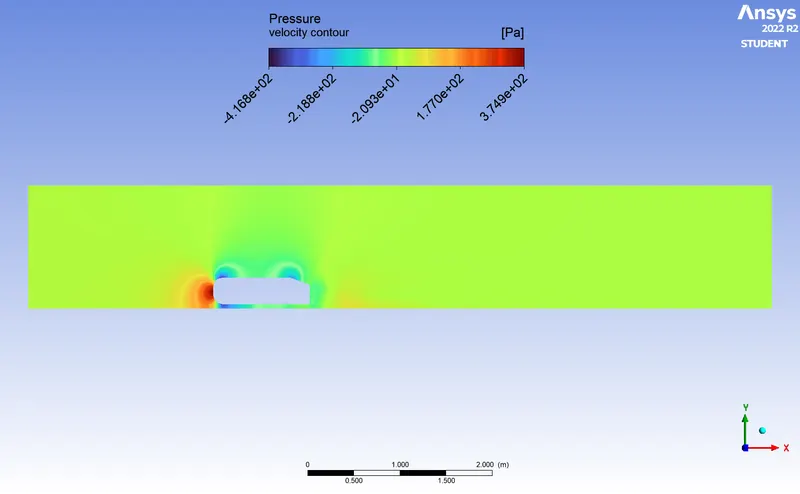
Negative pressure in the wake region
When the Air is moving over the vehicle at rear end it leaves a large low pressure turbulent region behing the vehicle which is known as wake. This contributes to formation of pressure drag which effects vehicle performance.
This happen because fluid move along the surface of vehicle when it reaches rear end It detaches from the surface of body causing negative pressure or called WAKE REGION . The movement of fluid depend on geometry of car and reynolds number.
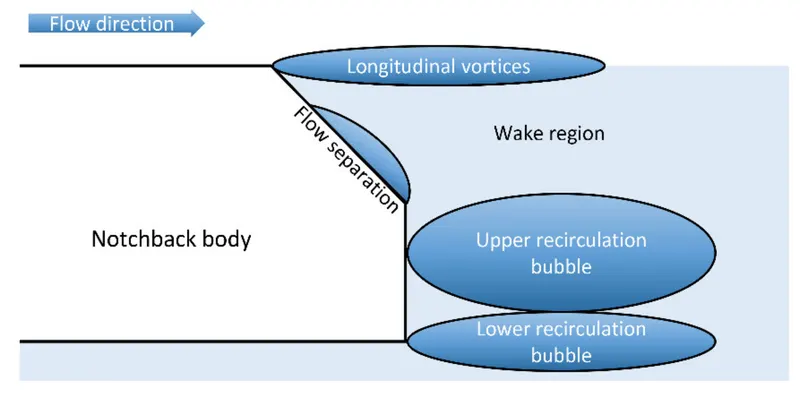
AS we know The pressure moves from high to low it causes lift in vehicles As we will see later that below the vehicle the pressure is high .Same is the reason for airplane lifting movement while taking off into air.
In order to reduce the sepration of fluid from boundary layer we uses smooth edge or In many case you may see vehicle using spoilers to reduce the low pressure generation.
Point of sepration
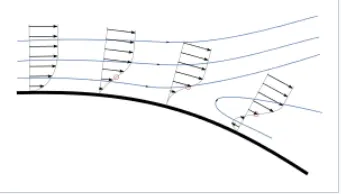
Sepration occurs due to adverse pressure gradient encountered as the flow expands causing an extended region of seprated flow. The part of flow that seprates recirculating flow and flow through central region is called dividing streamline.The stramline attaches to the wall again is called reattachment point. As the flow reaches an equilibrium state we will have no reverse flow in that condition.Wen bounday layer seprates,its remnants form a shear layer and presense of seprated flow region between shear layer and surface layer which modifies potential flow and pressure field .
Modeling Approach
- Ahmed body is loaded into spaceclaim.
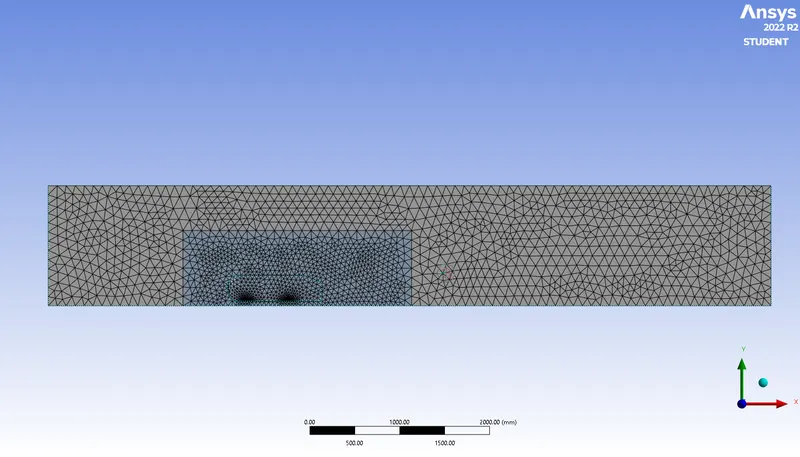
- Double enclosure is drawn near geometry for studing grid independency.
- Supress ahmed body for physics
- Now we load geometry in meshing.
- A simulation is done for 3 cases
Case-1= Outer enclosure mesh element size= 250mm & 100mm
Case-2= Outer enclosure mesh element size= 100mm & 50mm
Case-3= Outer enclosure mesh element size= 50mm & 30mm - Differnet mesh size is given using sizes and inflation data we use first layer method where first layer length is calculated using Y+ calculator.
- Name selection is created inlet,outlet,wall & symmetry.
- We open geometry in ANSYS FLUENT solver .
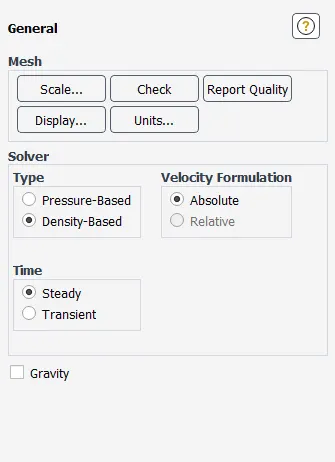
- Steady state and density based solver is selected.
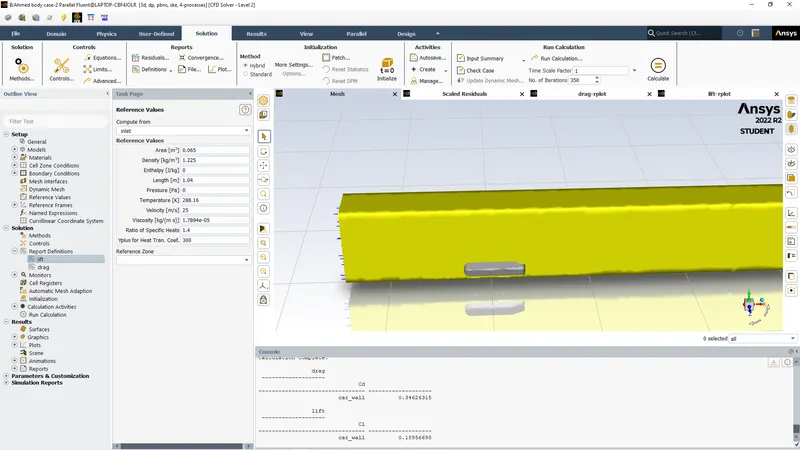
- Reference values are updated as per conditions.
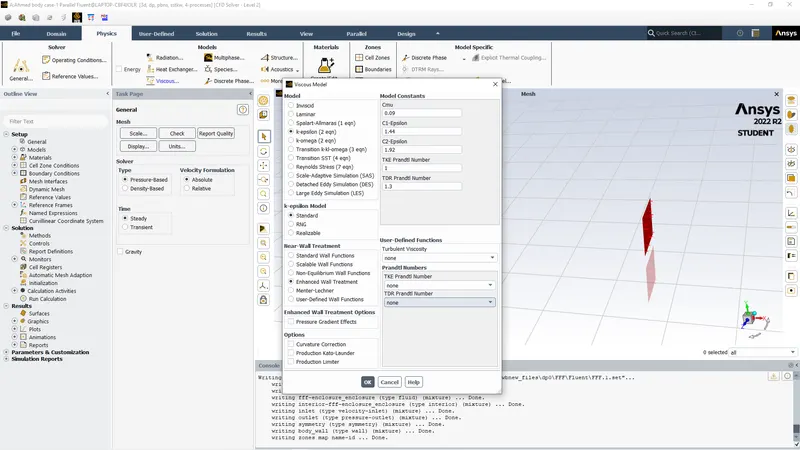
- we select k-epsiolon solver and enhanced wal based mode.
- In inlet boundary conditions 25m/s inlet velocity is given.
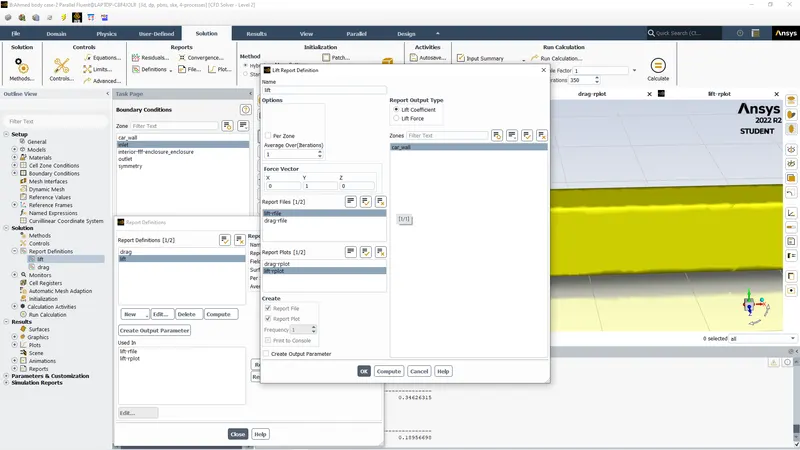
- Drag & lift coefficient plots are created by setting the reference as car walls.
- Hybrid initialization is selected.
- We run solution for 300 iterations
- We calculate and then plot results like contours & vector using result .
- Repeat the process for CASE-1,2,3 and compare the results in tabular form.
PROCEDURE & RESULTS
CASE-1 : Mesh size for enclosure 1 = 250mm & for enclosure 2 = 100mm ,Model =k-epsilon
Ahemd body model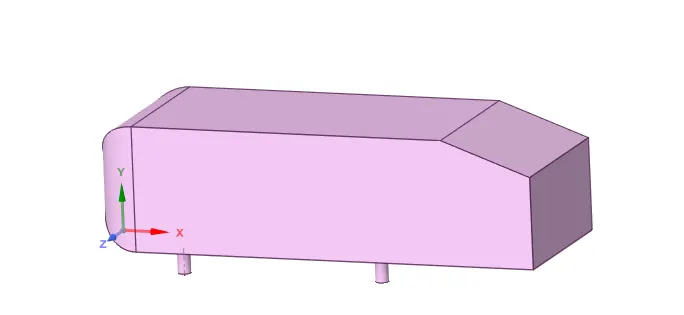
Crreating an enclosure across Ahmed body
We create enclosure by clicking at prepare and selcting enclosure unclick the symmetric option in left side tree bar to have all side dimension control and assign the data. Atlast click green check for implementing.
Enclosure 1
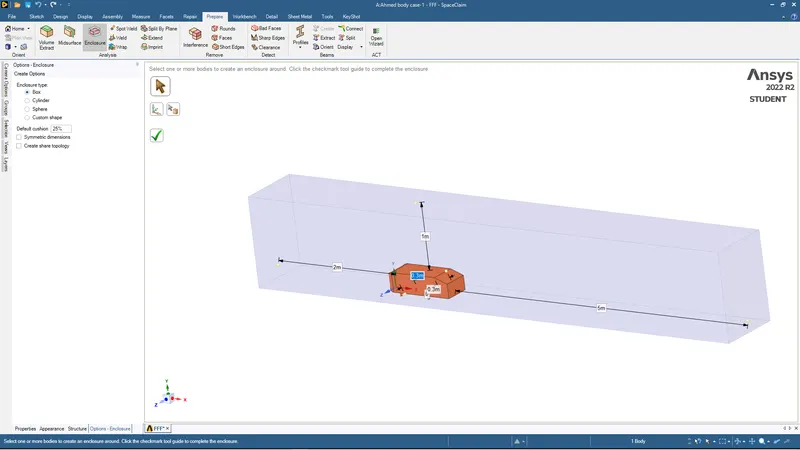
Creating Encloure 2 for more finer details by using different mesh size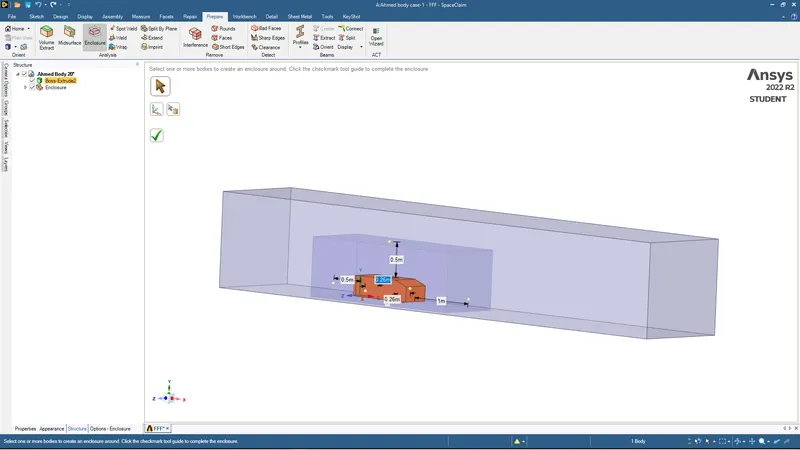
Using interference So, Both enclosures will act as 1 boundary layer with smooth data transition analysis.
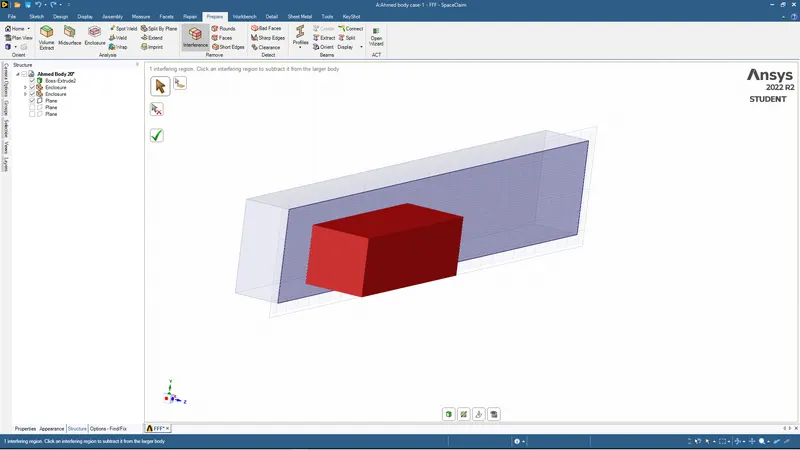
We use share topology so all data is shared between different bounday layers.
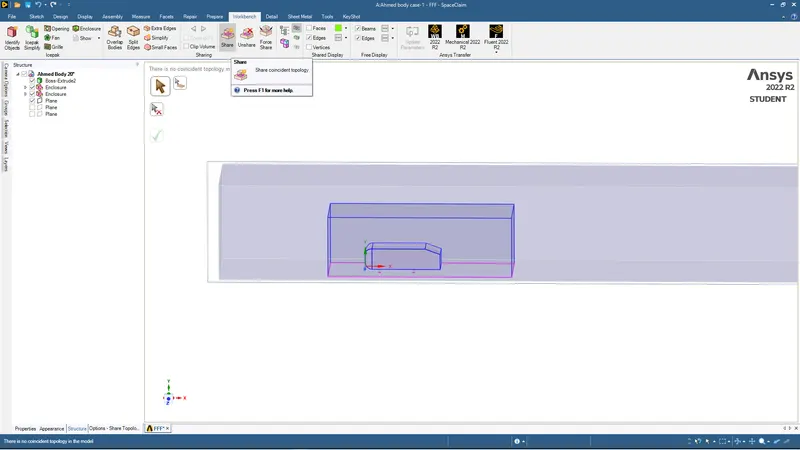
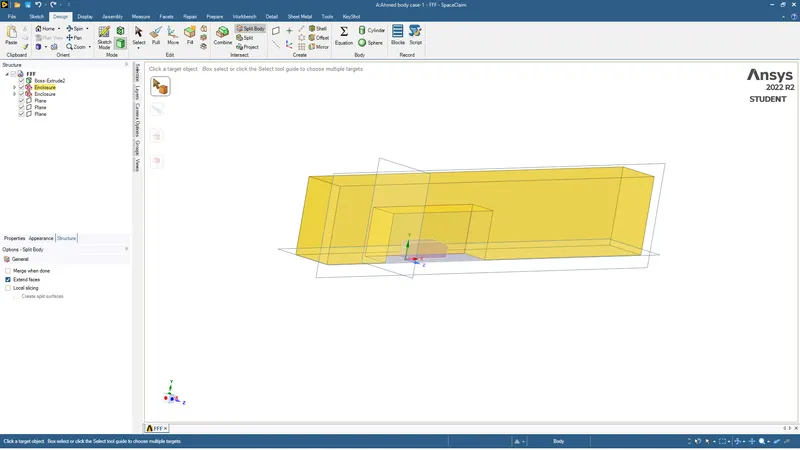
we then split the body as body is symmetric and for elemnts reductions so meshing and computational will be done faster.
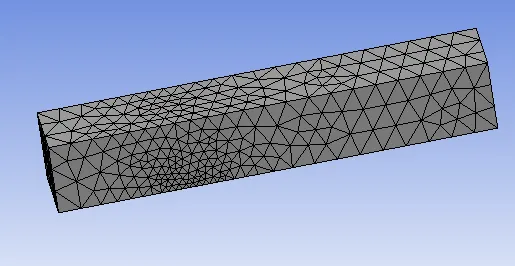
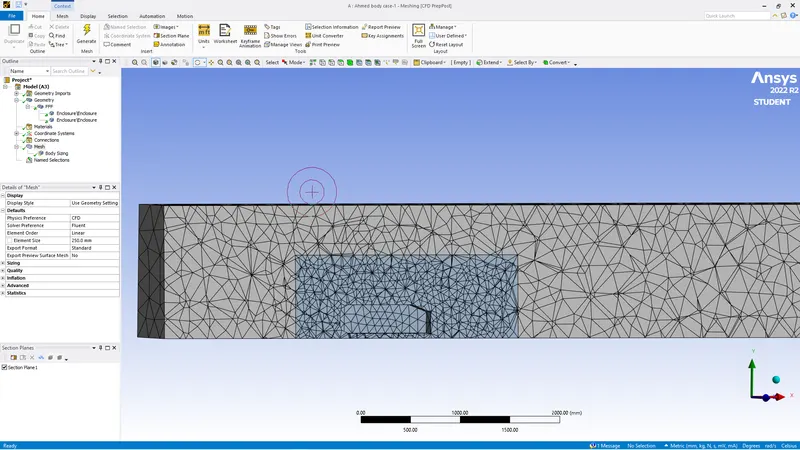
Openeing geomerty in mesh and generating mesh for 250mm element length
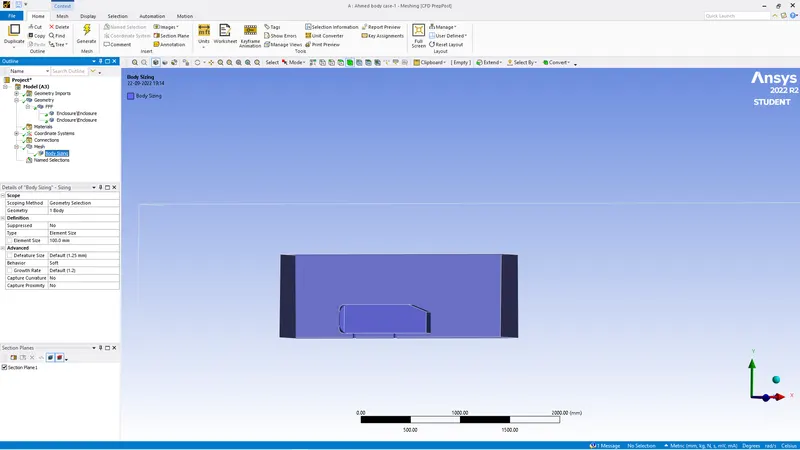
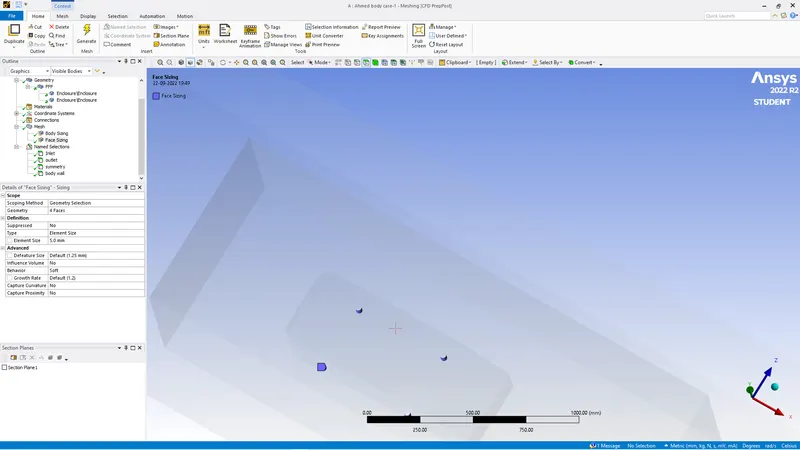
For enclosure 2 we give finer mesh by using body sizing by insert-> Sizing-> body sizing.
for this first we need to select face and use f8 to hide outer surface then select inner inclosure as geometry then apply and give mesh size of 100 mm.
Then we generate mesh
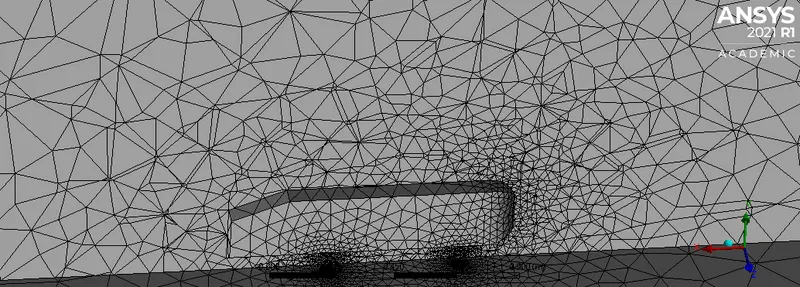
We the use Sizing for cylinderical support and ggive mesh of 2mm for proper symmetry result
Then update mesh
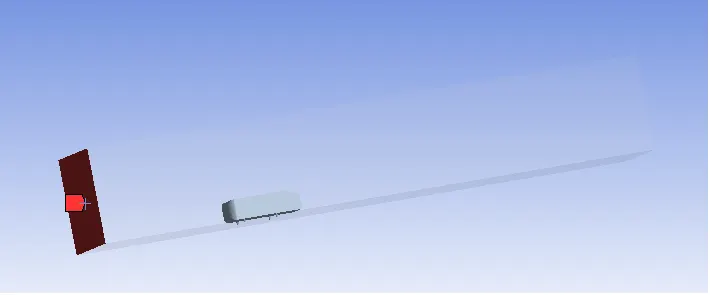
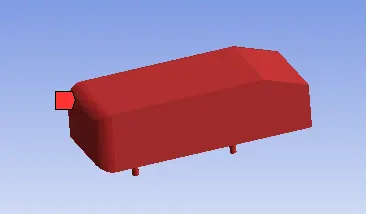
Then we given anme selction by right clicking and assigning names for inner part like car_wall first we hide outer surface using f8 then select ahmed body and give it as car wall.
As we need outer surface data for aerodynamic structure so we need to describe ahmed body as wall.
inlet
outlet
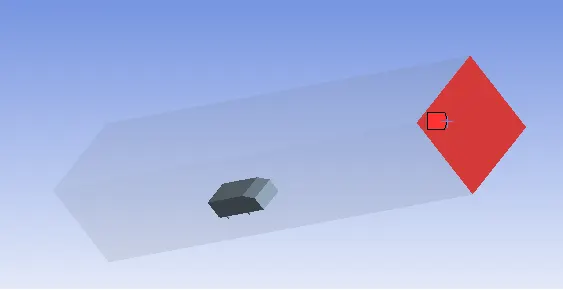
Symmetry
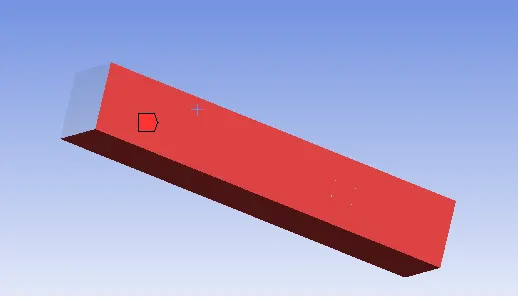
Car wall
INFLATION
We select inflation then select boundary by selecting option by name selection and calculate Y+ model
for first layer size which is 0.4mm give first layer size 0.4 and select 6 layers. then generate mesh
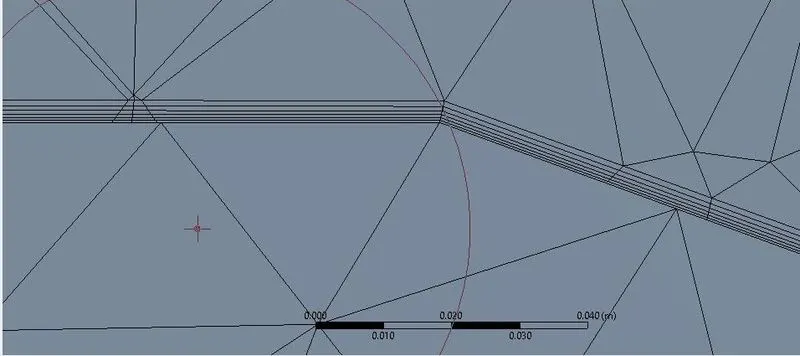
After meshing is done we load geometry into Asys fluent solver
simulation procedure
setting for physics
Reference value
For area we need frontal area for car wall which will be length X width
ARea= .`1315m^2` length of body = 1.044m SO as we split body in half area will be `0.065m^2`
We insert in reference values with velocity of 25m/s
under viscous model we select k-epsilon
We create plots for drag & lift coefficient
Then we initialize and solve for 350 iterations.
RESULTS
Residual plot
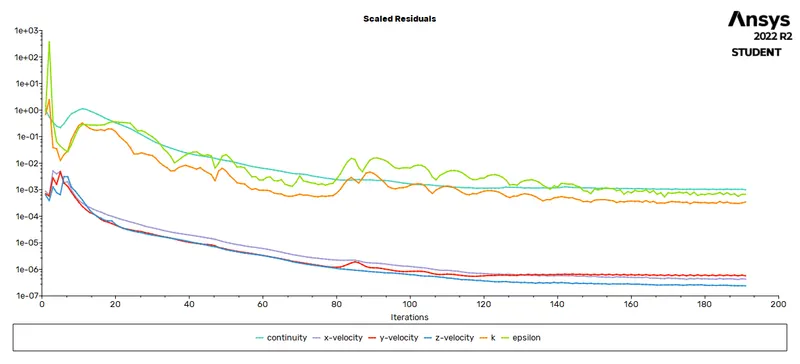
as we can see the solution gets converged after 200 iterrations
DRag coefficient
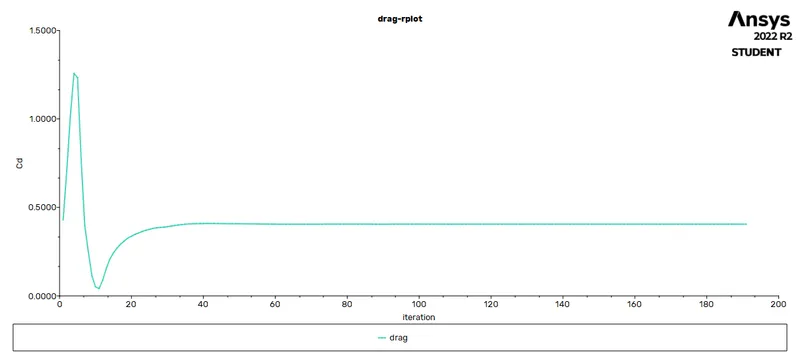
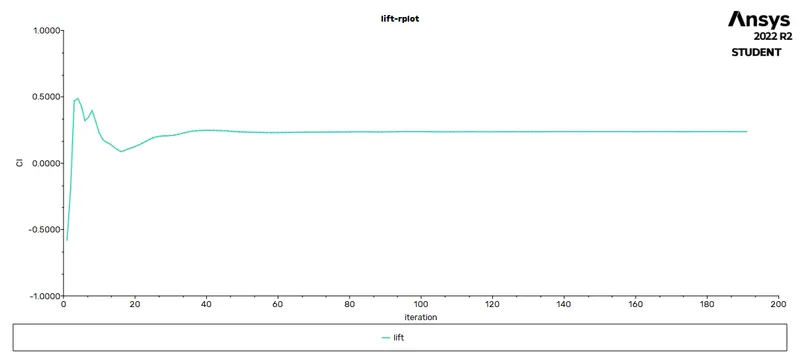
Lift coefficient
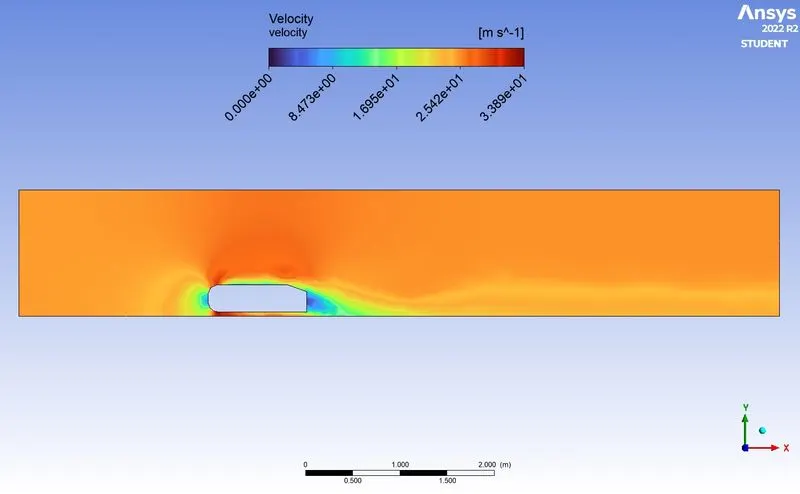
velocity contour
Pressure contour
velocity vector xy plane
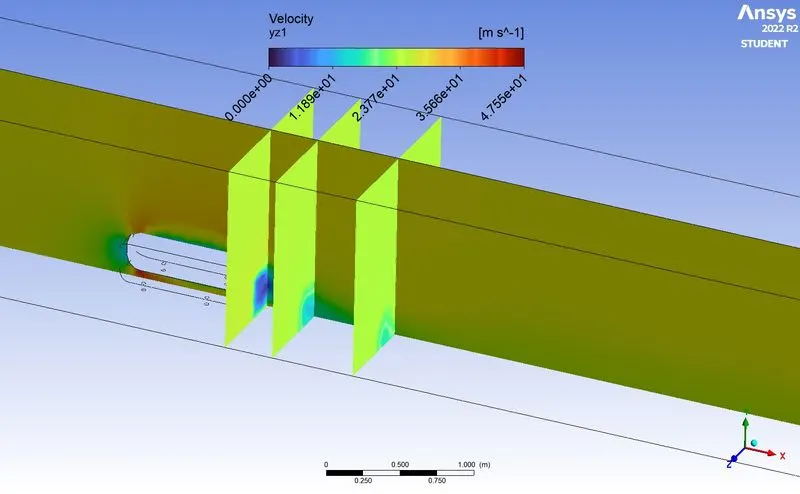
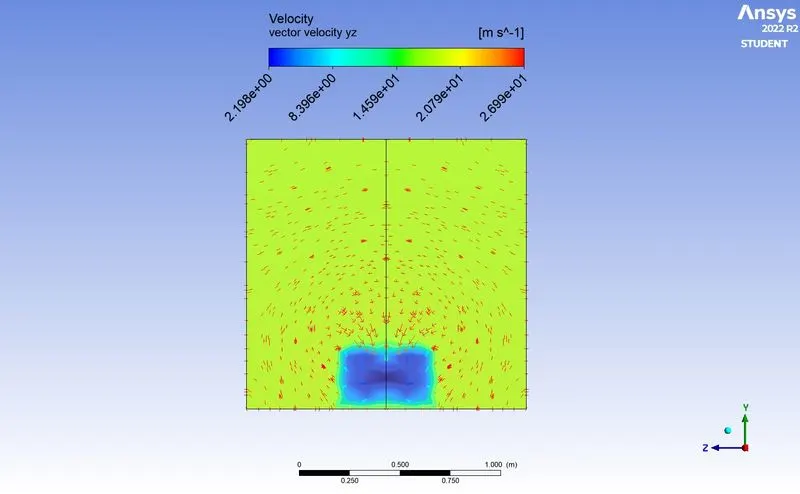
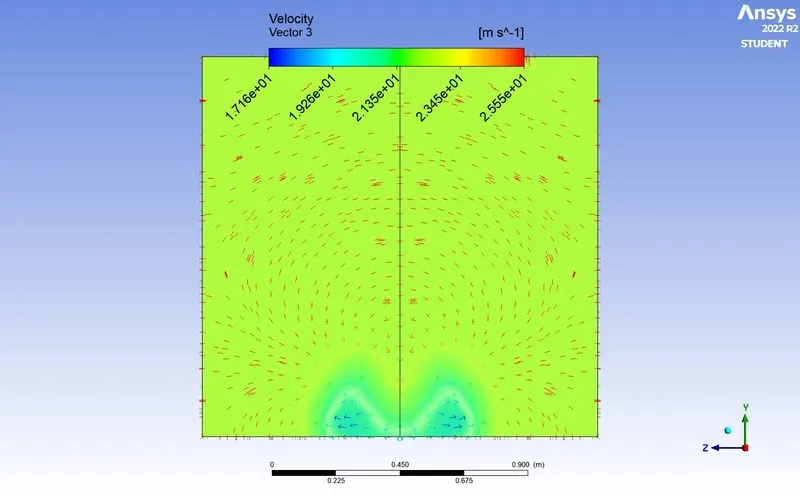
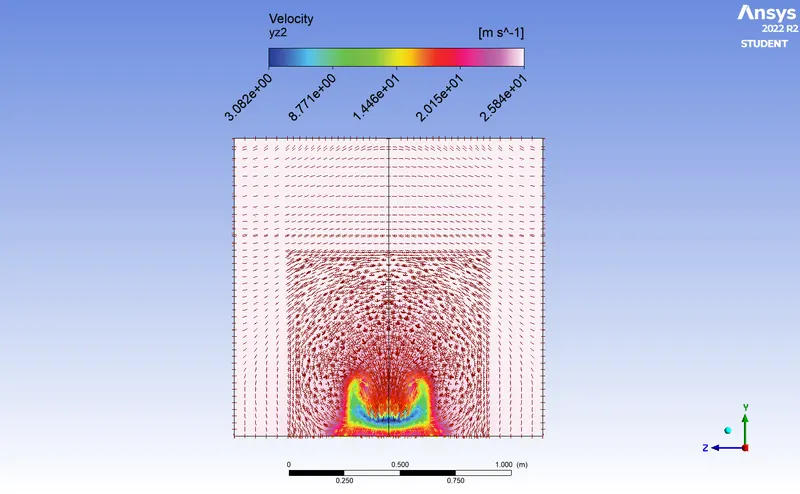
Yz plane velocity contour & vector at different plane distance
AT distance 0.96 from car wall
AT 1.35 distance from car wall
Velocity plot with Y direction
We create line using line command in result and create line in Y direction at different distance from car wall
at distance .96m from car
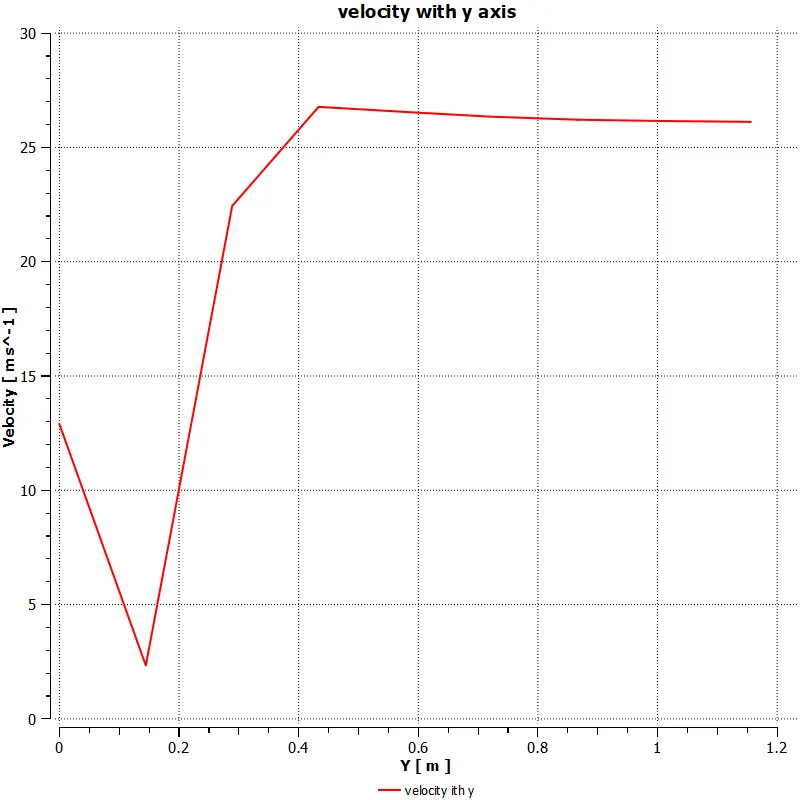
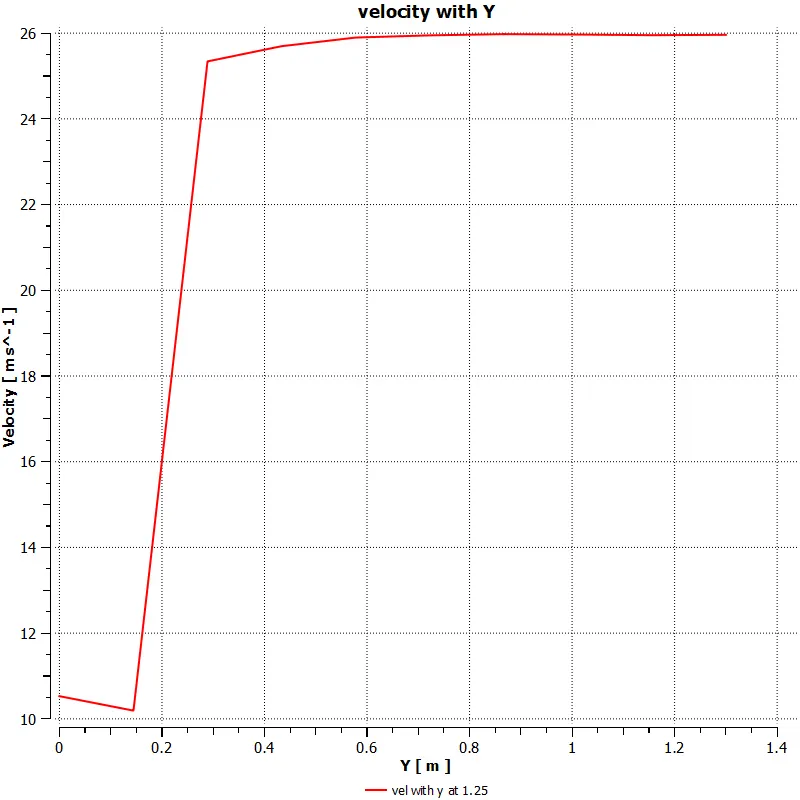
First drop is due to fluid flow from botom and then it reduces behind car body and increses as we move up the enclosure domain this shows the drop of velocity and pressure at back area creating wake region
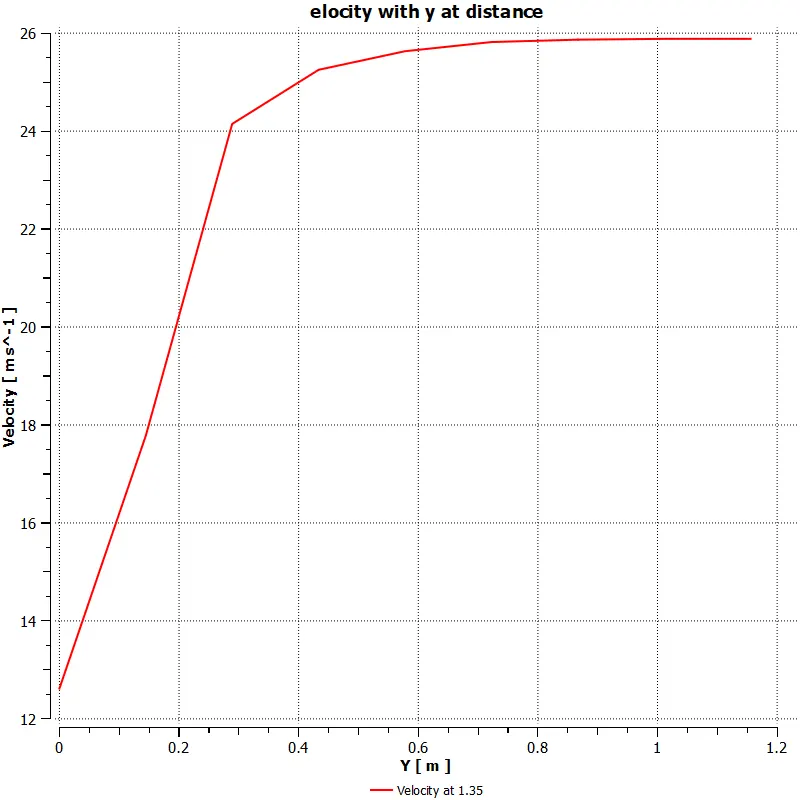
at distance the wake refion decreases so velocity will increase more raply as shhown by slope of curve.
NOTE : ALL RESULTS FOR CASE !TO # WILL BE COMPUTED AND DISCUSED AT END
CASE-2( MESH FOR OUTER ENCLOSURE= 100MM & INNER ENCLOSURE = 50MM)
Only change will be the mesh size other than whole process remains same
Like case 1 we will create body sizing but here we will give mesh size =50 mm for inner enclosure and 100 mm for outer enclosure to study difference caused by different mesh elements .
Residual plot
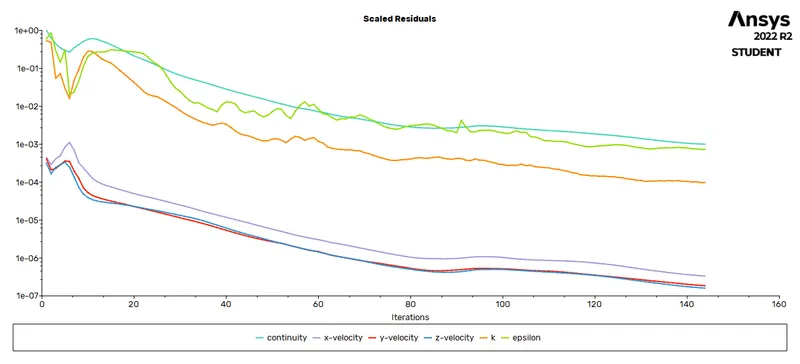
solutions get converged at 143 iterarions
Drag coefficient
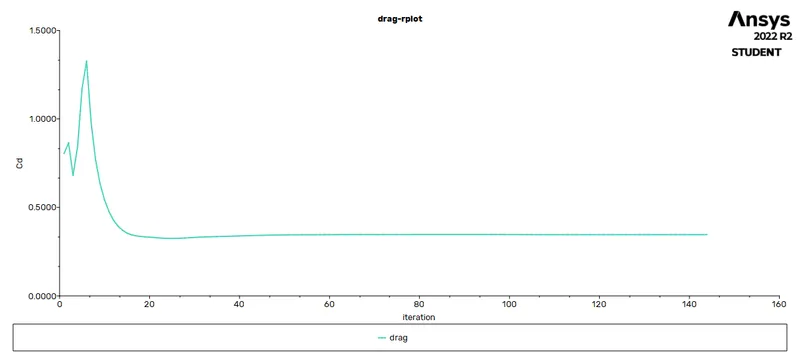
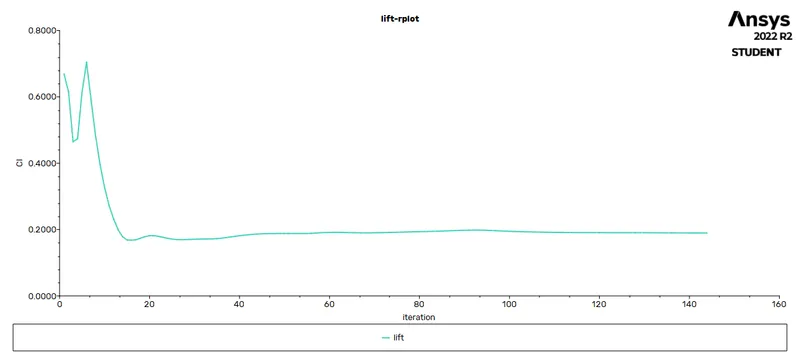
Lift coeffieint
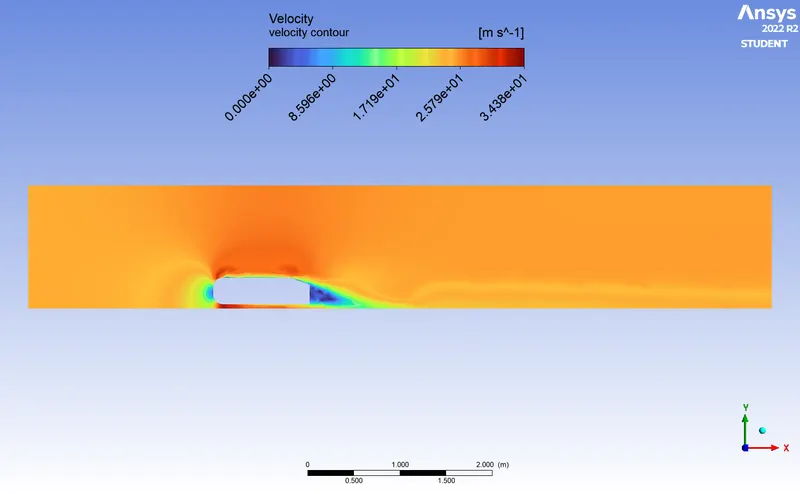
VELOCITY CONTOUR
PRESSURE CONTOUR
VELOCITY VECTOR
VELOCITY CONTOUR AND VECTOR AT YZ PLANE
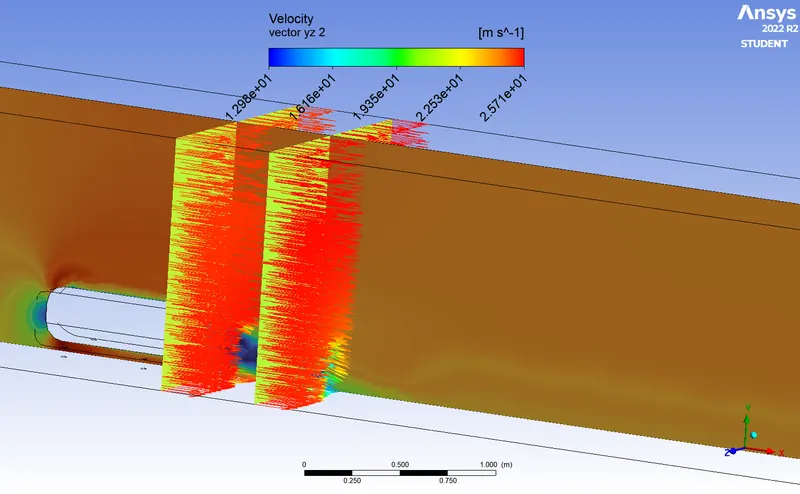
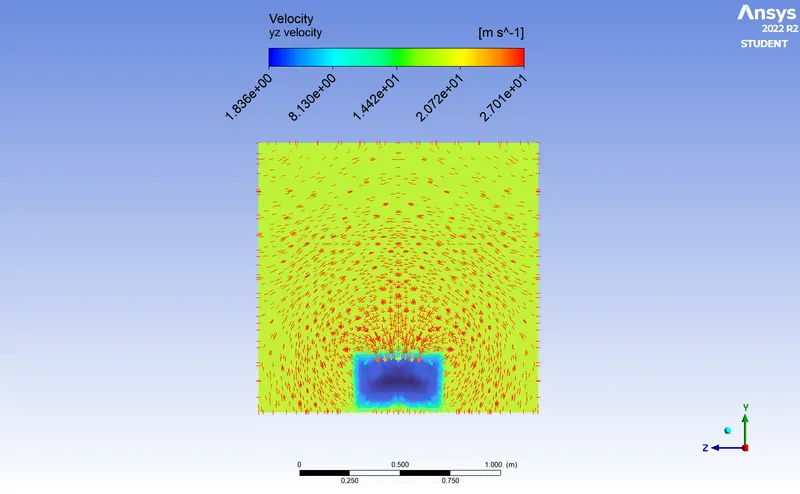
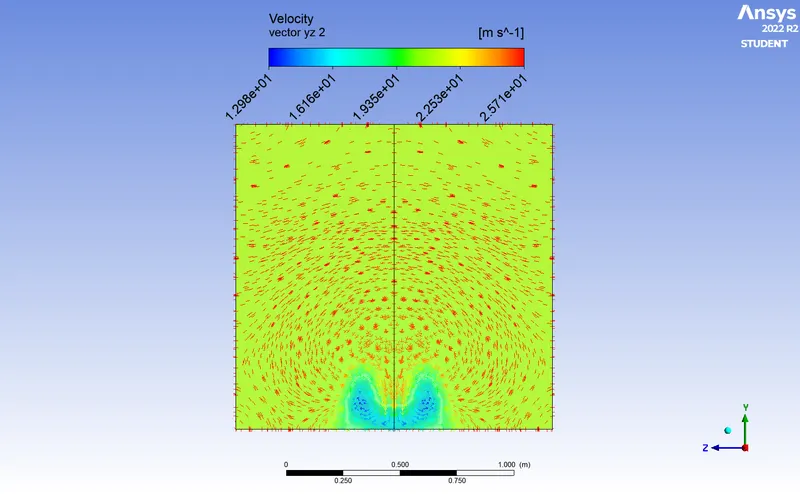
THE BLUE SHADED AREA IS WAKE REGION AS VELOCITY IS COMPARARTIVELY LOW AS COMPARE TO OTHER REGION
VELOCITY GRAPH WITH Y MAGNITUDE
CASE 3( OUTER ENCLOSURE= 50 MM & INNER ENCLOSURE= 30 MM)
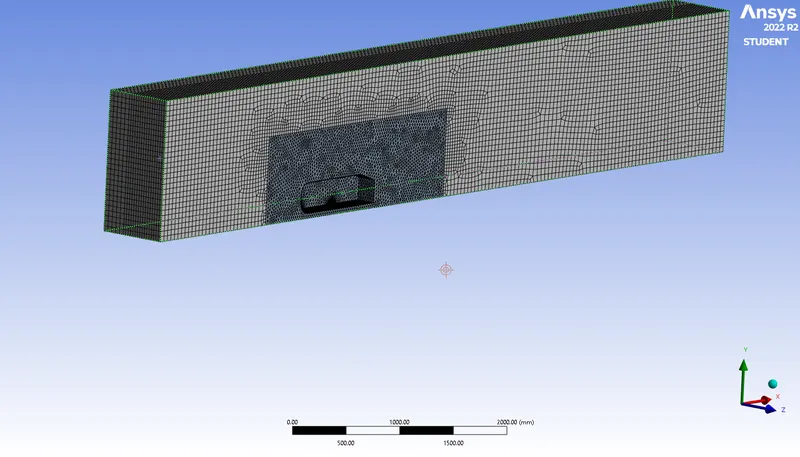
In this case we use multizone method in mesh because we need to reduce elemets no. as it will take more computational time and also in student version elements abvove 6lakhs is not allowed
We just right click at mesh-> method-> multizone-> Hexa meshes->
for inner zone we just change length to 30 mm and update mesh with Y+ value = 0.4mm
Residual plot
Solutions get converged at 142 iterations
DRAG COEFFICIENT
LIFT COEFFICIENT
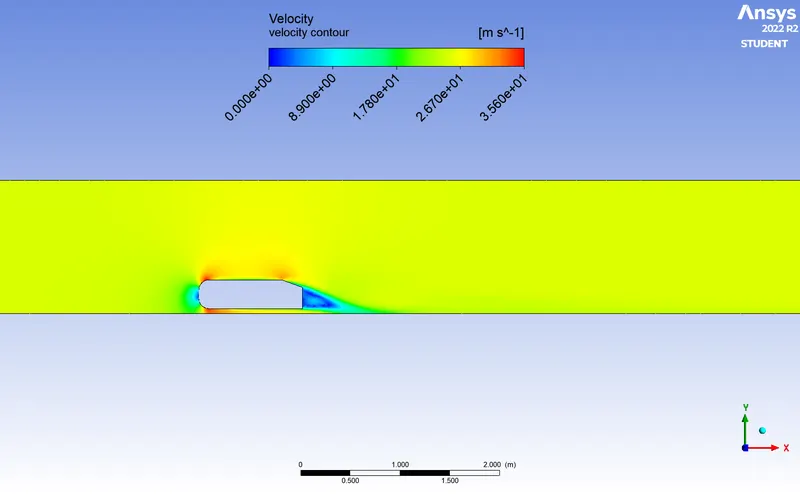
VELOCITY CONTOUR
PRESSURE CONTOUR
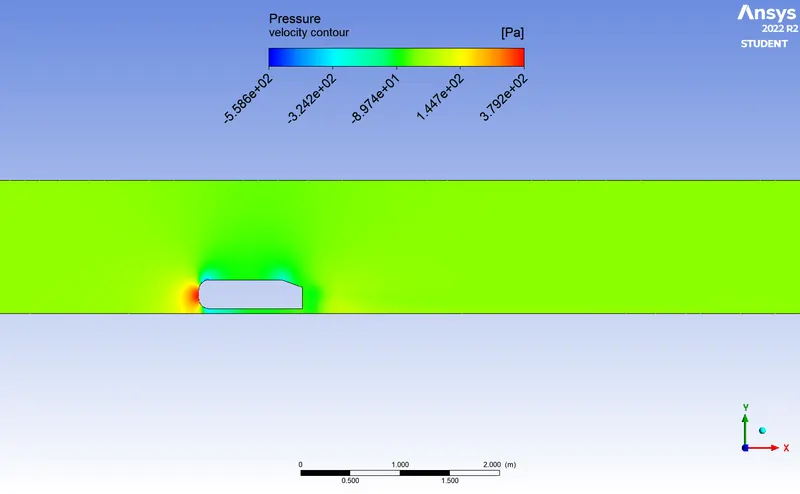
VELOCITY VECTOR
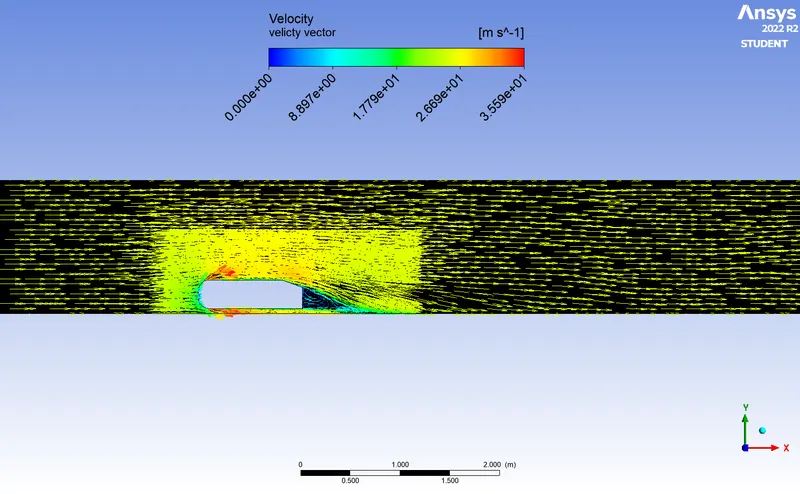
VELOCITY VECTOR AND CONTOUR YZ
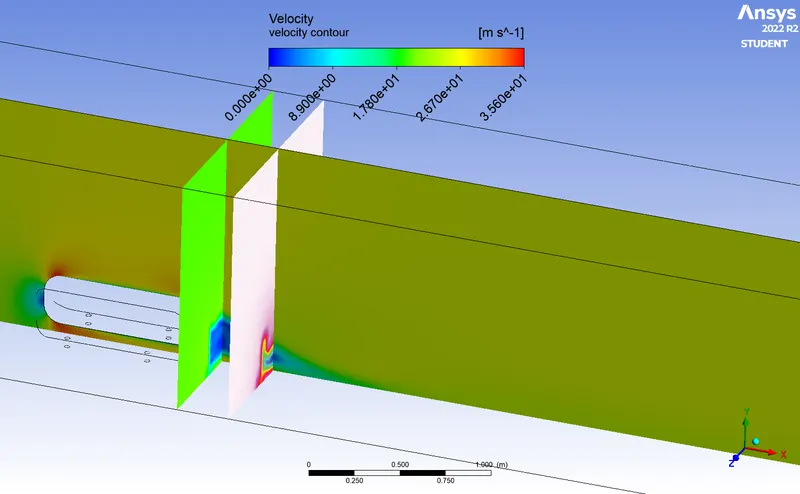
PLANE AT DISTANCE 0.96M FROM BODY
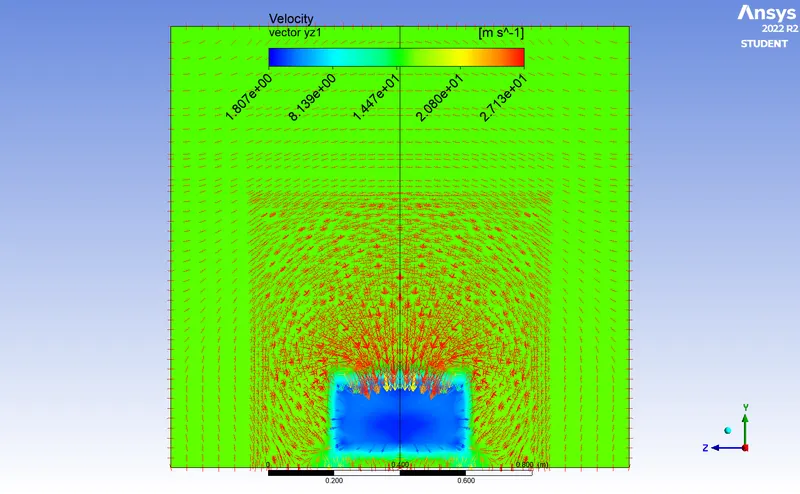
AT 1.35 FROM BODY
RESULT COMPUTATION DATA & COMPARISION OF AL CASES
| GRID INDEPENDENCE TEST | MODEL | NUMBER OF ELEMENTS | DRAG-COEFFICIENT(Cd) | LIFT-COEFFICIENT(Cl) |
| CASE-I | K-EPSILLON | 72,615 | 0.40 | 0.23 |
| CASE-II | K-EPSILLON | 2,62,734 | 0.35 | 0.20 |
| CASE-III | K-EPSILLON | 5,07,876 | 0.31 | 0.18 |
It is clearly visible that the finer the mesh the more accurate the result is although the computational time will take more time but solution will get converged faster in iterations and more clear result.Vectors can be identified according to sepration of boundary layers and Enclosures.
The wake region created is visible At distant yz plane contour we can see the depletion of wake region farther from the body.
CONCLUSION
- It can be inferred that grid independence test is convergred faster for smaller size cell.
- As the mesh size decreases the drag and lift coefficient decreases.
- Y+ plays important role in determining the value of drag.
- The negative pressure and velocity in wake region is due to no flow in that region. This can be further attributed to various factorssuch as sepration and recirculation. which is evident from vector plot near wake region
- The point of sepration occurs at rear end of vehcle the sepration occurs beyond this point where it can be observed that flow recirculates and attaches it to boundary layer.
- In vector plot we can see more details vector indiacators according to mesh when mesh size is reduced.