Week 3 - External flow simulation over an Ahmed body.
AIM:
Generally, in automobiles, the main parameter that affects the performance is the drag coefficient. As the speed of vehicle increases, the drag force also increases which requires more fuel consumption. The objective of the report is to perform an external flow simulation over an Ahmed body and validate the results.
OBJECTIVES:
- Perform turbulence flow simulation over Ahmed body in Ansys fluent.
- Explain significance of wake region and point of seperation.
- Estimate drag coefficient.
- Plot velocity and pressure contours.
- Perform grid independence test.
THEORY:
Ahmed body -
In the field of aerodynamics, it is essential to capture the flow features over an automobile so that its performance can be increased by some design modifications. In reality, the flow features are captured by placing the automobile in the wind test tunnel. So, instead of doing experiments with the actual automobile, prototypes of automobiles have been developed so that the experimental cost can be minimized. Ahmed body is a representation of a standard passenger car that captures the essential flow features and computes the aerodynamic forces in the wind test tunnel.
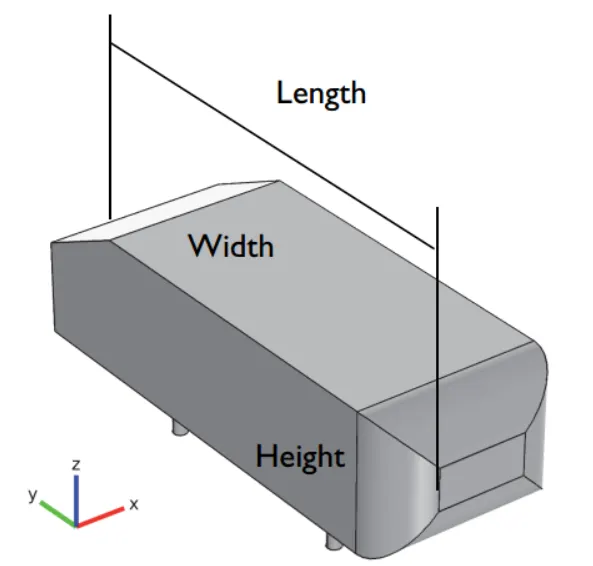
Dimensions - Length = 1.044m, Width = 0.389m, Height = 0.288m.
Cylindrical legs of height 0.5m attached to the bottom of the body
PROCEDURE:
In order to perform external flow simulation over an Ahmed body in Ansys fluent, certain steps have to be followed.
Step 1 - Geometry
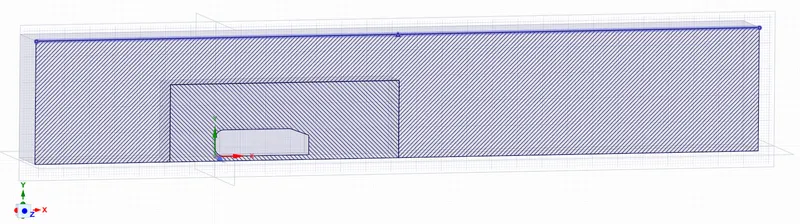
Import the ahmed body cad model in ansys space claim. To perform virtual wind test tunnel simulation In order to perform virtual wind test tunnel simulation, create two enclosures around ahmed body of ensure1 dimensions +x = 5m, -x = 2m, +y = 2m, -y = 0m, +z = -z = 0.5m and enclosure2 of dimensions +x = 1m, -x = 0.5m, +y = 0.5m, -y = 0m from the walls of the Ahmed body as shown in the fig.
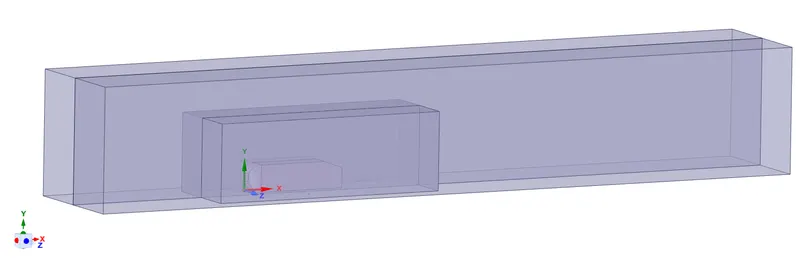
Since, the body is symmetric about xy plane, the ahmed body is splitted into two halves about xy plane and only one part is considered for analysis as it saves computational time and cost.
Step 2 - Mesh
In mesh module, before generating the mesh, it is important to assign names at boundaries as shown in the fig.
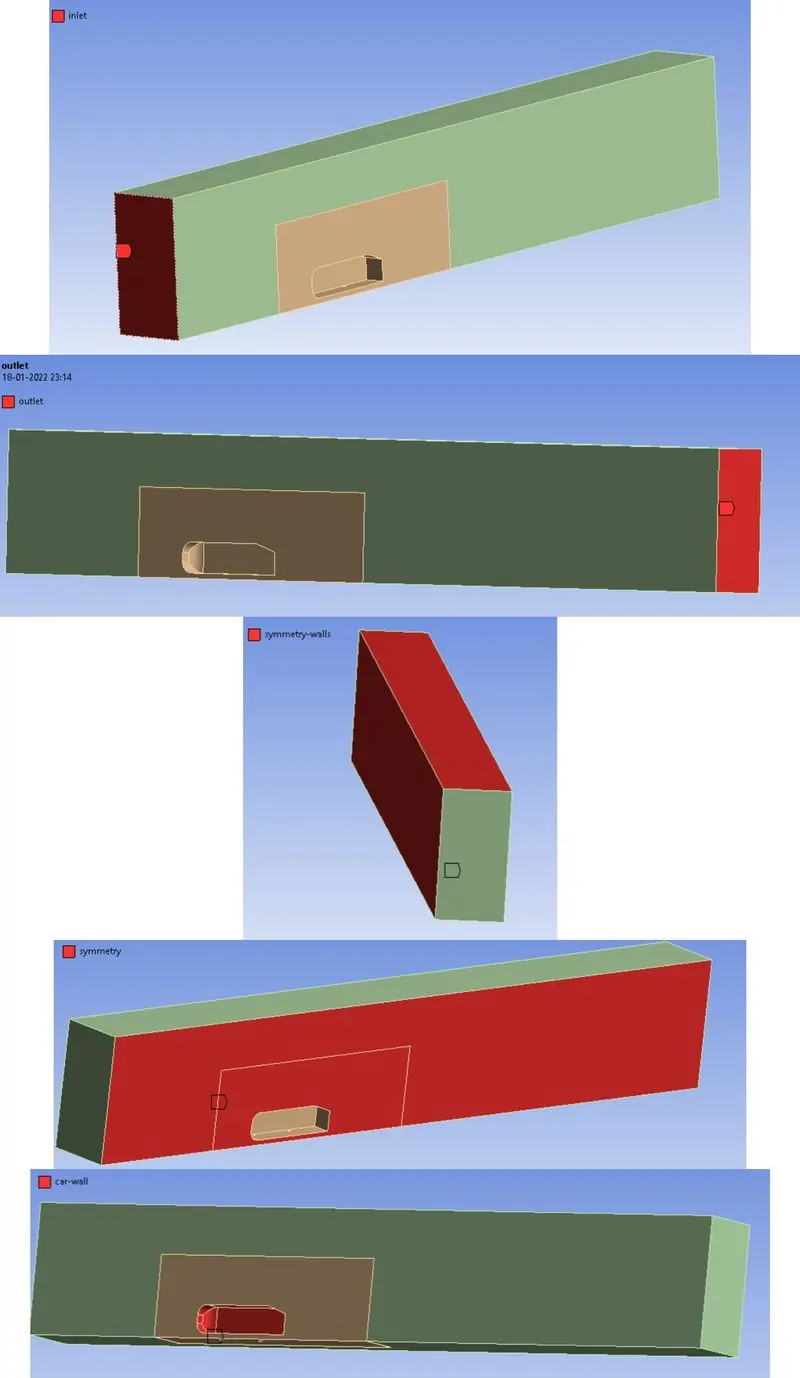
Gnerate -
1) Multizone - Hexahedral mesh of element size 0.1m inside the outer enclosure
2) Body Sizing - Tetrahedral mesh of element size 0.03m inside the inner enclosure
3) Face Sizing - Element size of 0.02m on the car wall
4) Face Sizing 2 - Element size of 0.005m on the faces of cylindrical legs of Ahmed body

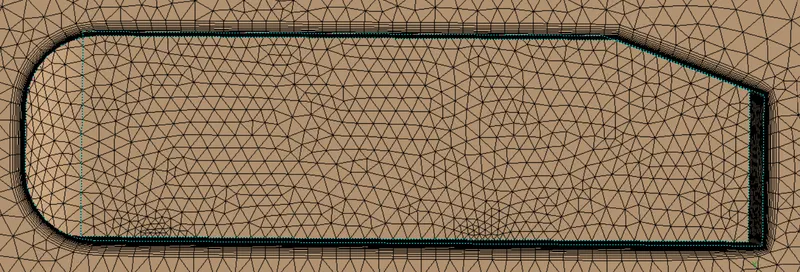
Next, inorder to compute accurate results around the walls of ahmed body, inflation layers are created. Inflation layers are body-fitted mesh, where mesh follows exact shape of geometry.
Based on the type of turbulence model, the inflation first layer thickness is varied accordingly.
1) K - epsilon model: 30 < y+ < 200
2) K - omega model: y+ < 5 , where y+ is non dimensional thickness
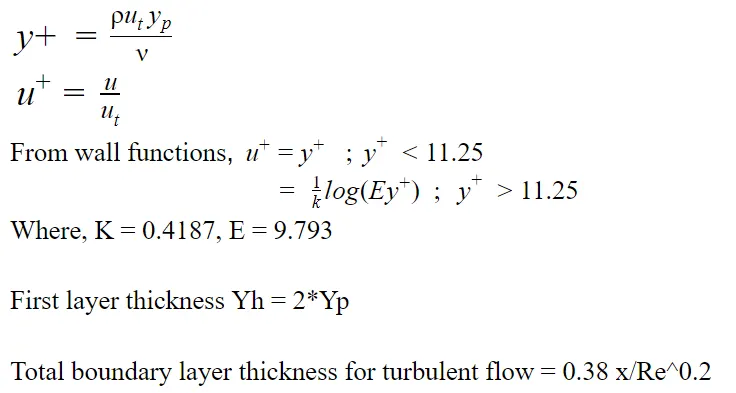
From the above equations, the first layer thickness is calculated.
| S.NO | Model | Y+ | Yh | Total boundary layer thickness | Total no.of layers |
| 1 | K- Epsilon | 100 | 0.834 mm | 22.28 mm | 10 |
| 2 | K - Omega | 4 | 1.86e-2 mm | 22.28 mm | 30 |
Based on the above table, the inflation layers should be generated
Step 3 - Setup
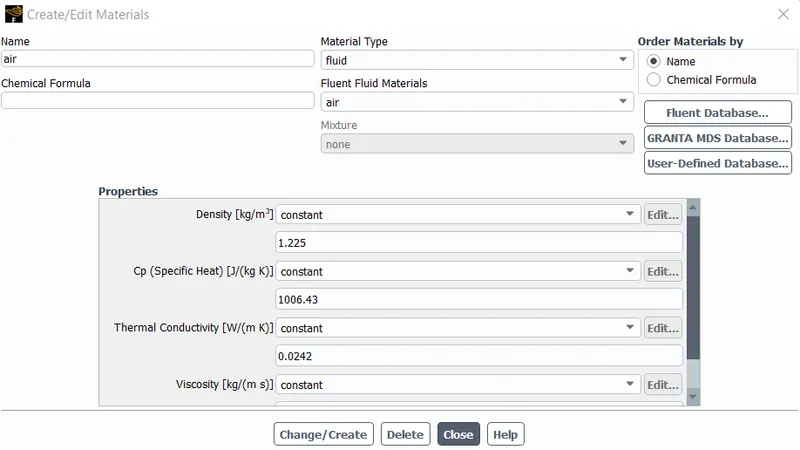
Material - air
Boundary conditions -
1) Inlet - (Type : velocity - inlet)
v = 25m/s, T = 300k
2) Outlet - (Type : Pressure outlet)
P = zero gauge pressure
3) Walls - (Type : wall)
No slip boundary conditions
4) Symmetry - (Type : symmetry)
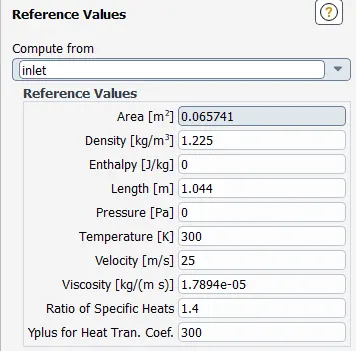
To compute the aerodynamic forces and its coefficients acuuratley, it is recommended to input reference values as shown in the fig.
Generate reports on coefficient of lift and drag on the surface of Ahmed body
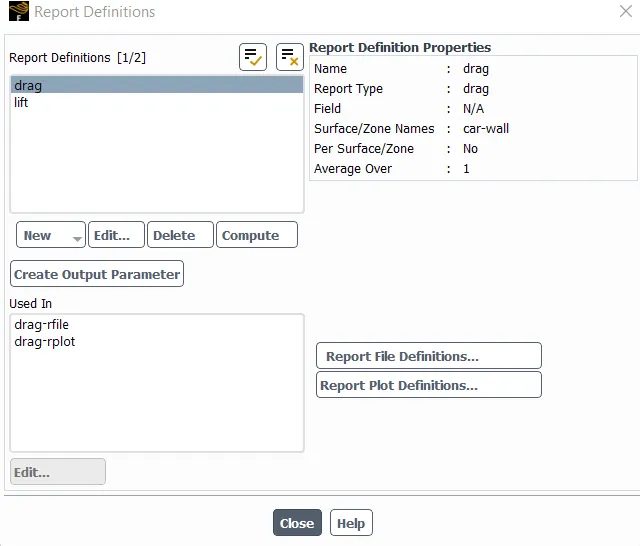
Perform simulation by using k-omega SST and k-epsilon turbulence models.
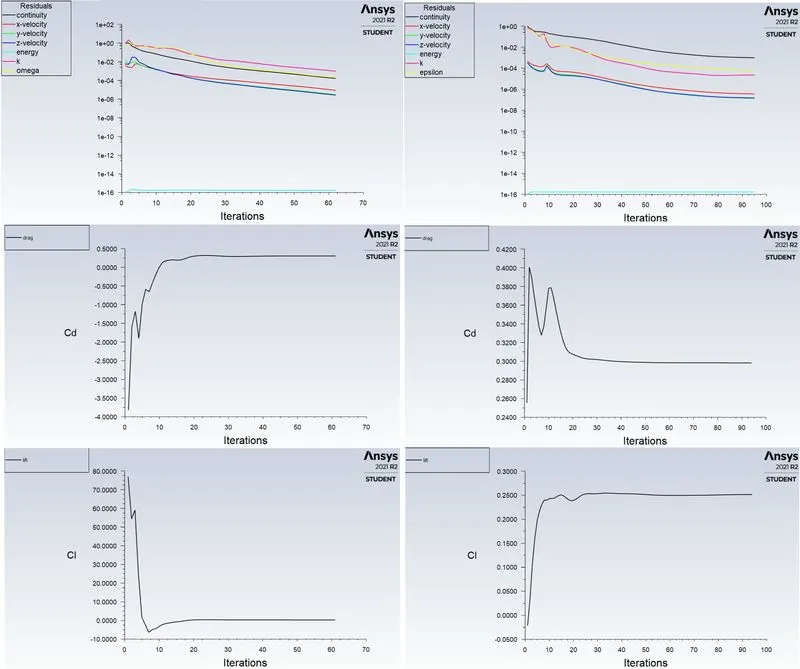
Fig : K-Omega SST model and K-Epsilon model
For v=25m/s, the reference value of drag coefficient is 0.33
| S.NO | Model | No.of iterations | Coefficient of drag | Absolute % Error |
| 1 | K-Omega SST | 62 | 0.303 | 8.18% |
| 2 | K-Epsilon | 95 | 0.298 | 9.69% |
From the table, it is observed that k-omega SST model converges quickly than k-epsilon model and also %error in k-omega SST model is less compared to k-epsilon model. So, to compute accurate wall effects, K-omega SST model is used.
Step 4 - Results
The following fig shows the velocity, pressure contours and velocity vector plot obtained from k-omega SST model.
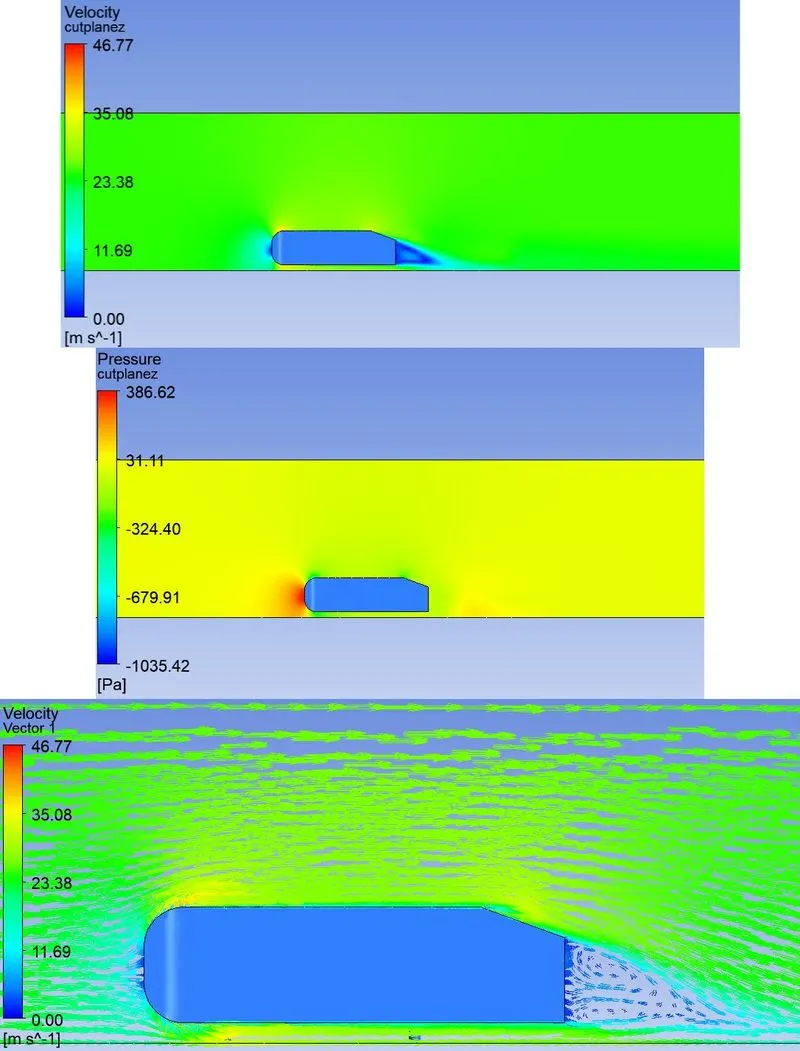
From the fig, in vector plot, the recirculation region indicates the wake region. Due to adverse pressure gradient, the flow gets seperated and vortices are formed in the wake region. From the pressure contours and line plots, 386.62 Pa pressure is generated at front end of body and vacuum pressure is generated at back end.
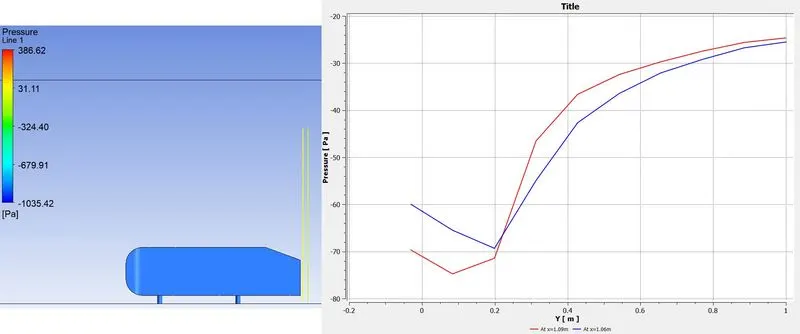
The wall shear stress and pressure forces are the two terms that mainly affects the aerodynamic forces. So, inorder to decrease the drag coefficient, the body should be more streamlined so that the wake region gets minimized which decreases the pressure forces which in turn decreases the drag coefficient.
Grid Independence Test -
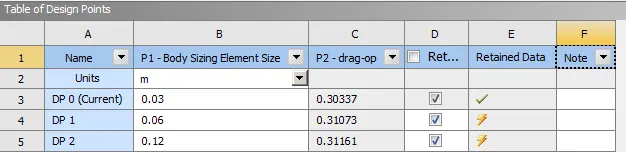
The grid independence test is performed by using parametric analysis as shown in the above fig. Since, mesh size in the inner enclosure affects the results of wall effects, the mesh size of inner enclosure is changed and drag coefficient is computed.
From the analysis, although the mesh size is changed to 0.12m, accurate drag coefficient values are computed.
CONCLUSION:
The K-Omega SST turbulence model computes accurate drag coefficient value with error of 8.18%.