Week-3 Challenge: ADVISOR Tool
Aim:To use ADVISOR tool for simulation.
Objective:
- Using EV_defaults_infile,if cargo mass is 500 kg with all other default conditions, To find whether the vehicle can travel for 45 km with FTP drive cycle, and to Conclude observations.
- In the above case , try changing the battery capacity and repeate the simulation.
- To perform gradeability test with PRIUS_jpn_defaults_infile . To compare results in the table and conclude.
Introduction:
ADVISOR tool , developed in November 1994 by the National Renewable Energy Laborotory (NREL) , allows users to simulate and analyse conventional , advanced , light and heavy vehicles , including hybrid electric and fuel cell vehicles. The tool allows users to access the effect of changes I vehicle components (such as motor, batteries , catalytic converters , climate control systems and alternative fuels) and other modifications that might effect fuel economy , performance or emissions.
It is a set of models , data and script text files for use with Matlab and Simulink.
The benefit of using ADVISOR
- Estimate the fuel economy of vehicles that have not yet been built.
- Learn about how conventional , Hybrid or electric vehicles use (and lose) energy throughout their drivetrains.
- Compare relative relative tailpipe emissions produced on a number of cycles.
- Evaluate an energy management strategy for your hybrid vehicle’s Fuel converter.
- Optimize the gear ratios in your transmission to minimize fuel use or maximize perfprmance , etc.
How to start ADVISOR tool
- Launch MATLAB and first set default location folder to the advisor.
- Now in the command window of MATLAB type ‘ADVISOR’ and press enter.
- A new window will open and then set “metric” for unit and start ADVISOR.
- It will launch in a new window.
Advisor tools have 3 Windows:
- Vehicle Input window.
- Simulation Parameter Window.
- Results window
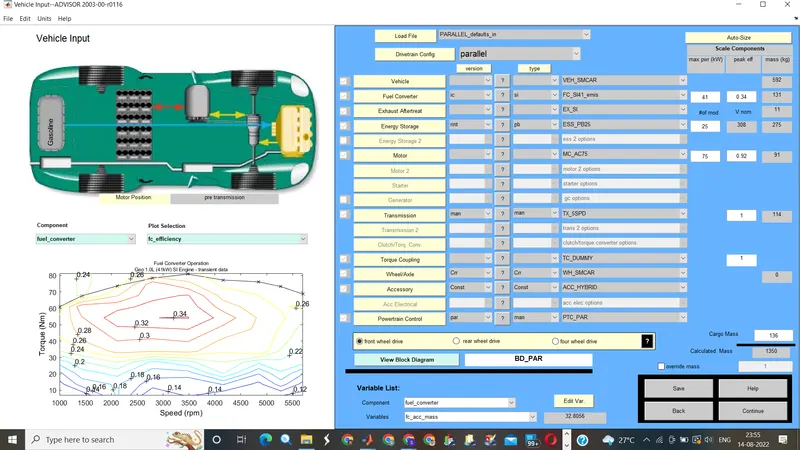
Q1.For EV_defaults_in file , if cargo mass is 500 kg with all other default conditions , can the vehicle travel for 45 km with FTP drive cycle? Conclude your observations.
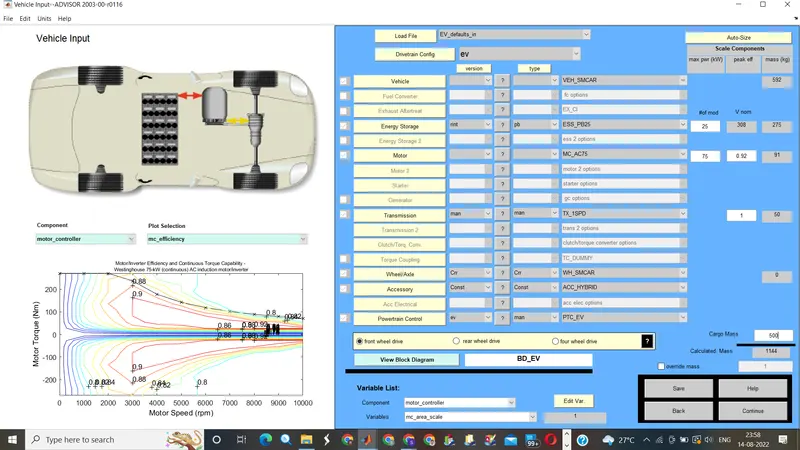
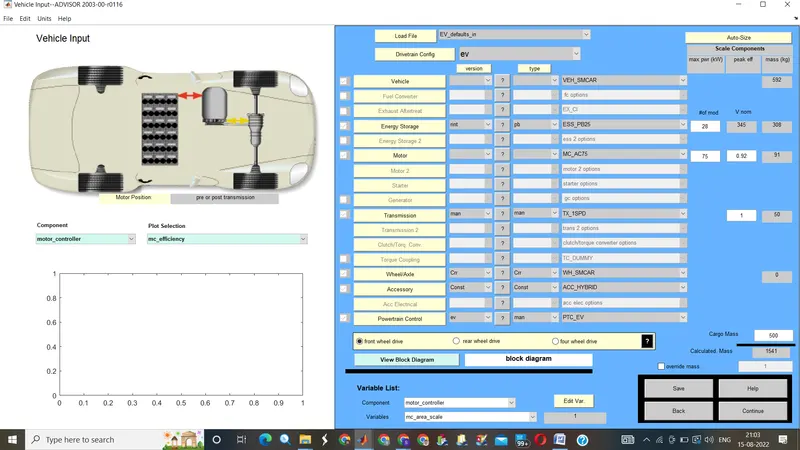
Ans: First , loading EV_defaults_in from the drop _down menu and changing parallel _default_in to EV_default_in from vehicle input window.
- Now changing the cargo mass to 500 kg.
- Change in the total mass of the vehicle can be seen.
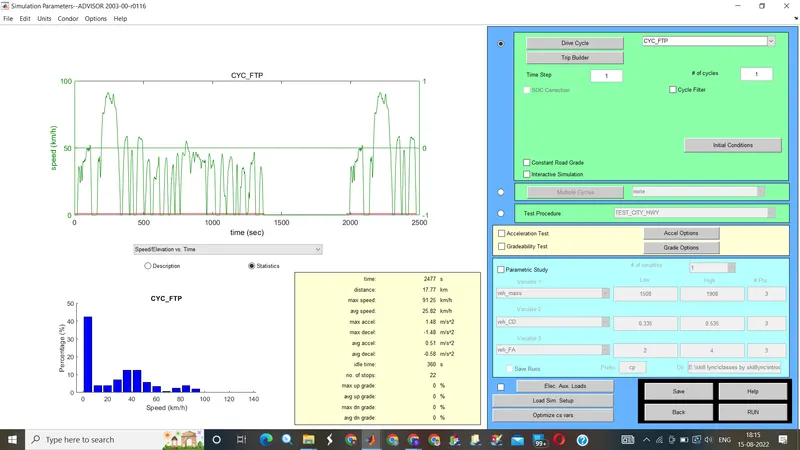
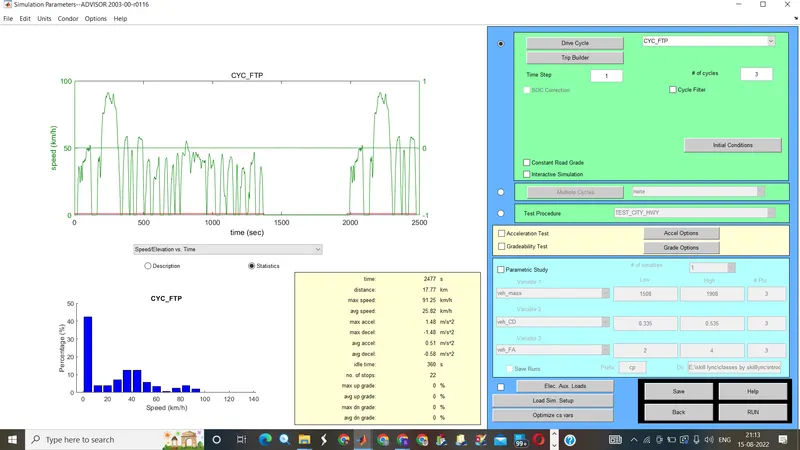
- Clicking on the continue button after that a new window simulation parameter will popup.
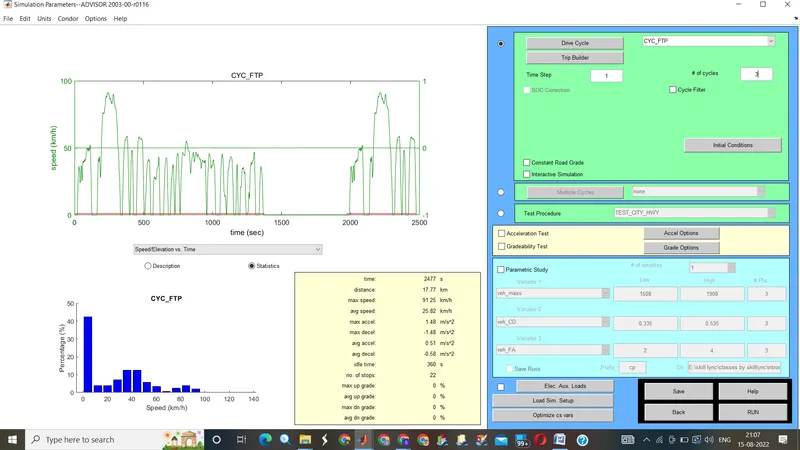
- In simulation Parameter window change drive cycle to CYC_FTP by selecting the drop-down menu.
- Below that we will see # of cycles from here we can set our drive cycle.
- After pressing the RUN button , the simulation will start and it will show results in a new window.
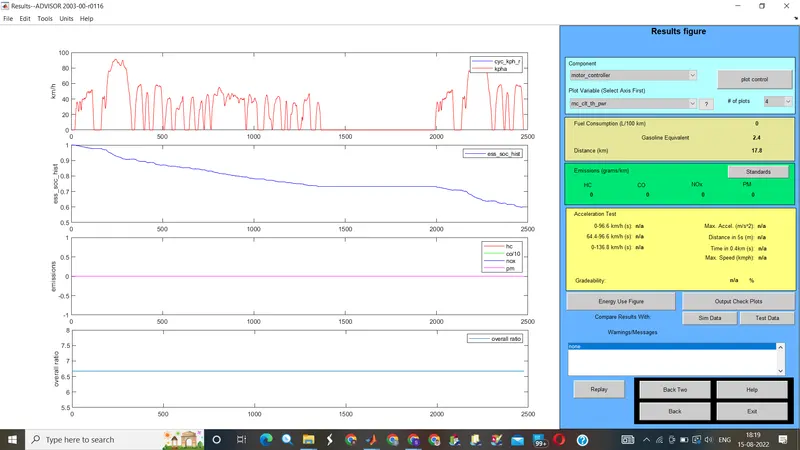
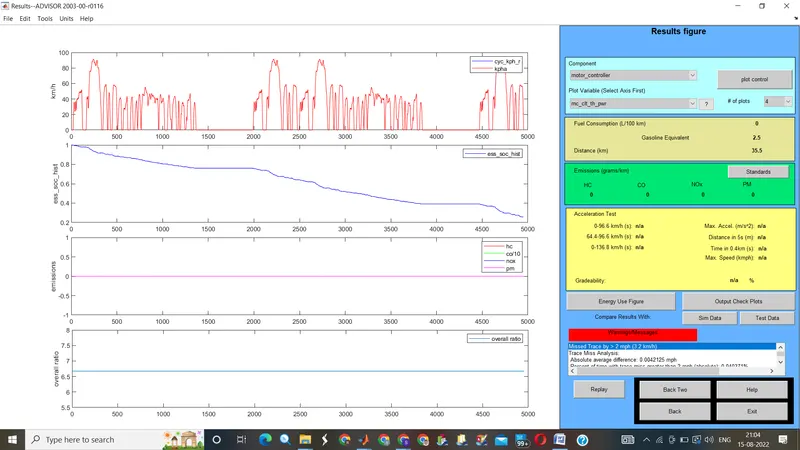
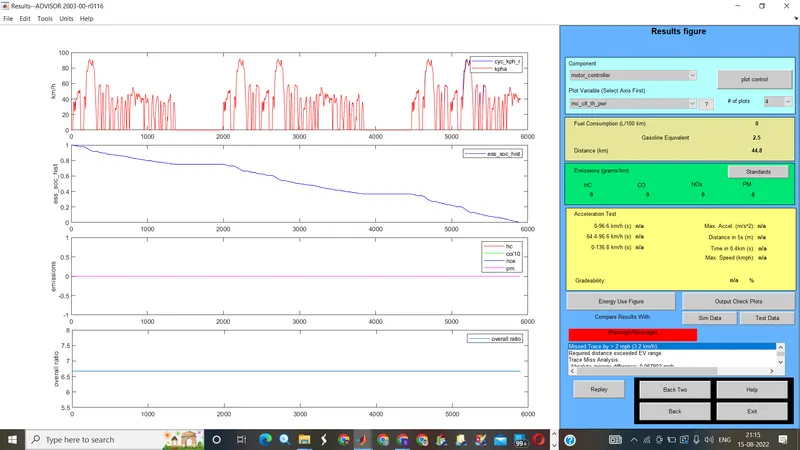
The distance travelled by the vehicle in 1 drive cycle is 17.8 km. Used almost 40% SOC.
Increasing no. of drive cycles to 2.
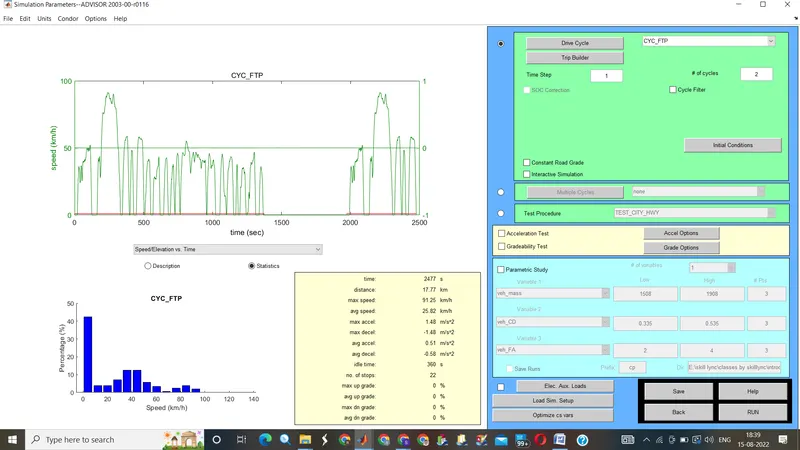
Result with 2 drive cycles.
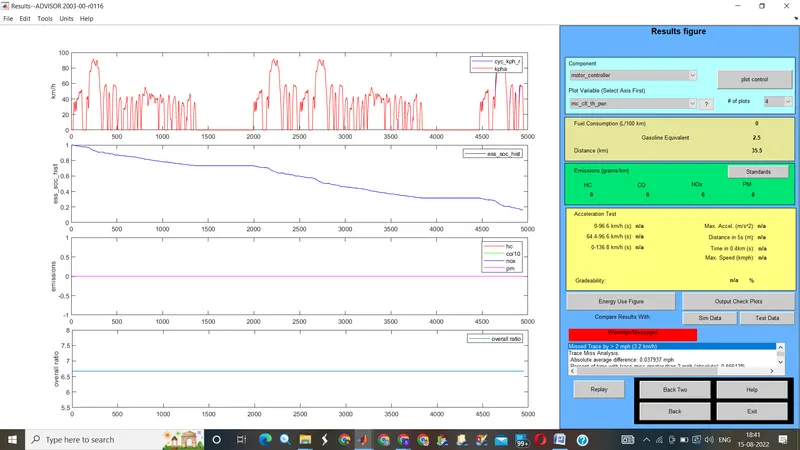
The distance travelled by the vehicle in 2 drive cycles is 35.5 Km. Used almost 81% SOC.
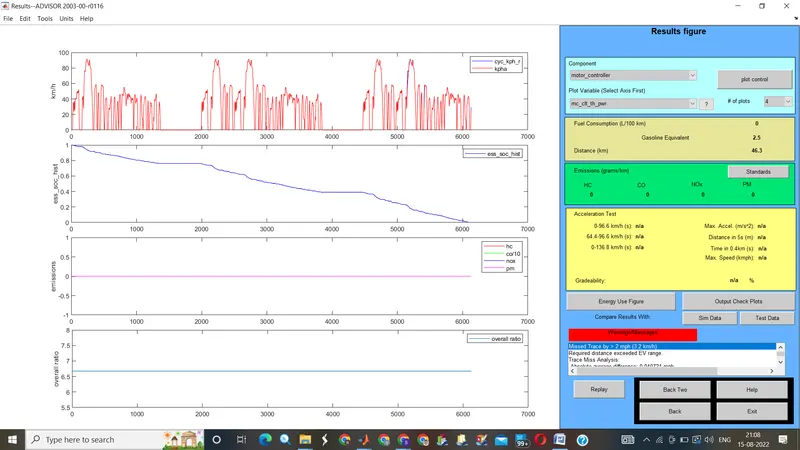
Increasing no. of drive cycles to 3.
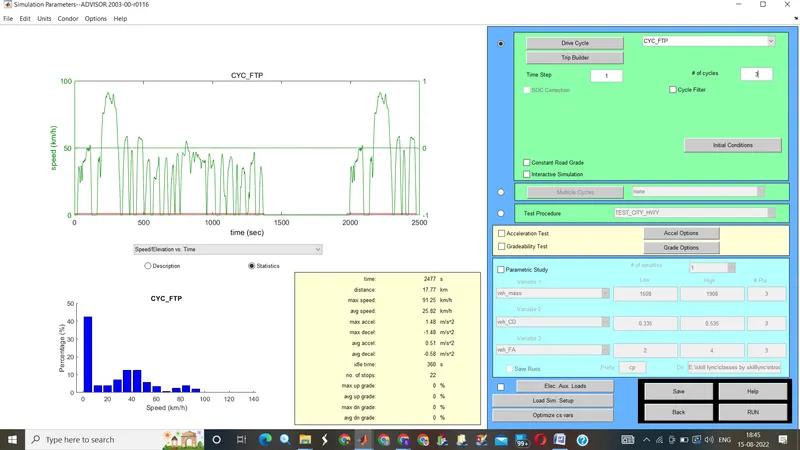
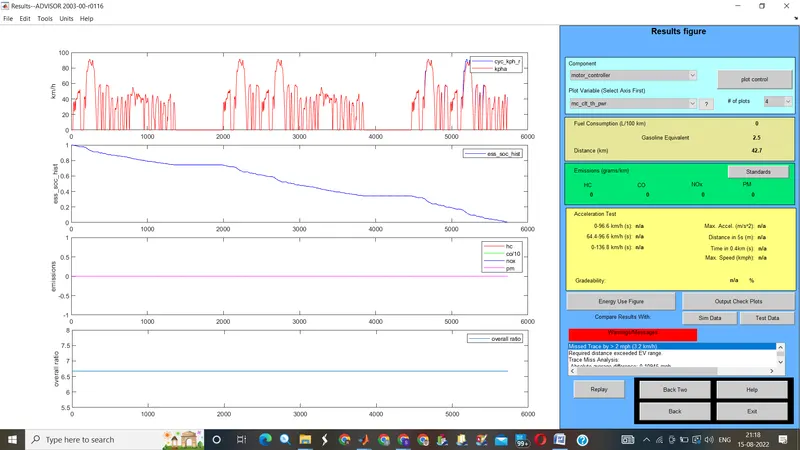
Result with 3 drive cycles.
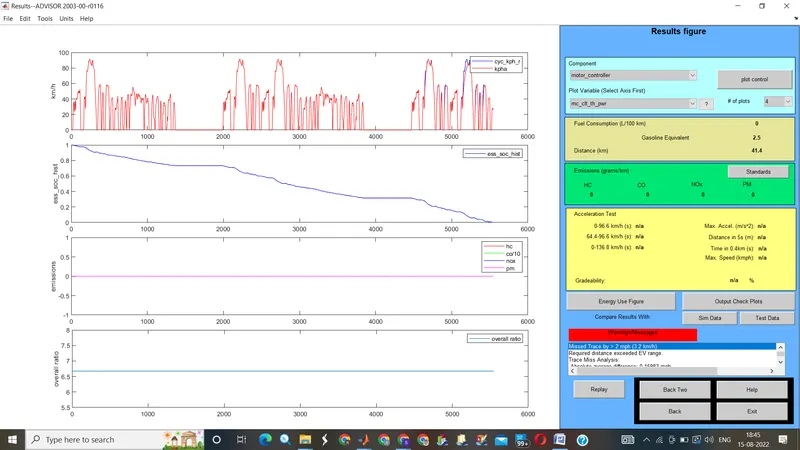
The distance traveled by the vehicle in 2 drive cycles and some part of 3rd drive cycle is 41.4km. Used completely 100% SOC.
|
No. of Drive cycles |
Distance covered in kms |
|
1 |
17.8 |
|
2 |
35.5 |
|
3 |
41.4 |
The minimum distance travel by car is 17.8 km with drive cycle CYC_FTP – 1 whereas the maximum distance travel by car is 41.4 which consumes 100% of battery in 3 Drive cycles.
Therefore EV_default cannot travel distance of 45 km due to insufficient SOC.
Q2.Th the above case , try changing the battery capacity and repeat the simulation.
Ans:
- In-Vehicle Input window we will change the capacity of battery from energy storage which will be open in 1st
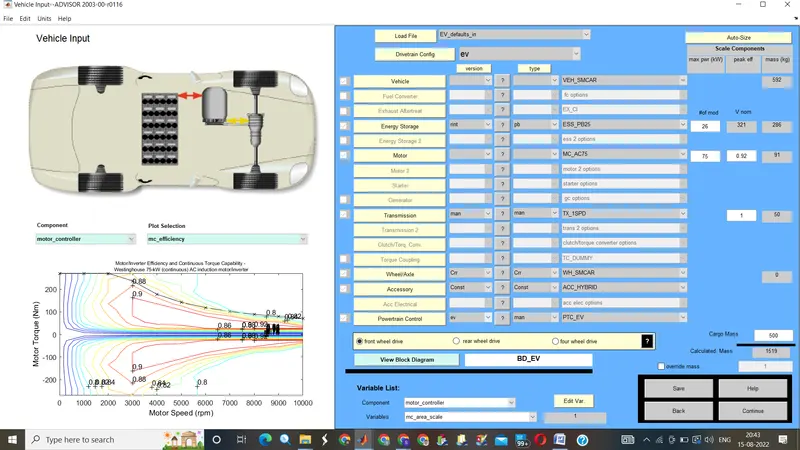
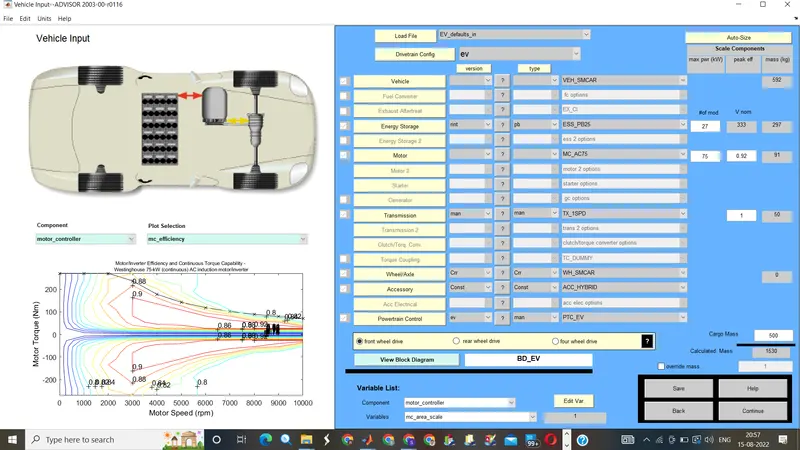
- “# of mod V nom “ describes the battery capacity , so we will change the module number of batteries from first box and we will see that changes in voltage and weight of the battery.
- A new Simulation Parameter window will open , here we will change the drive cycle to 2 or 3 , one at the time and run the simulation.
- After completing of simulation , we will see the result window where we observe the change in distance of vehicle travel.
- We can repeat this simulation by changing the battery module and the drive cycle.
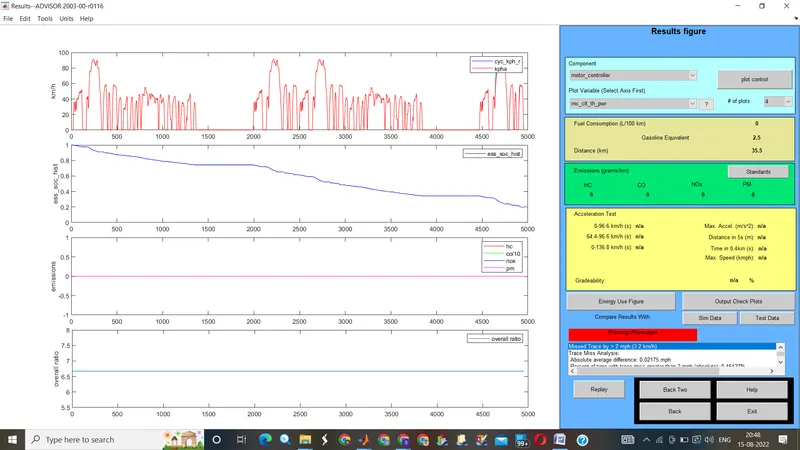
- Energy Storage system with 26 modules and 2 drive cycles.
Result
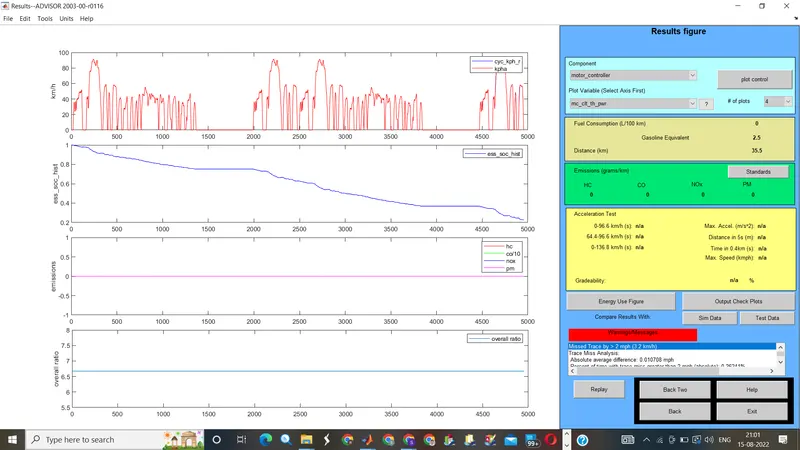
 2.Energy Storage system with 27 modules and 2 drive cycles.
Result
 Energy Storage system with 28 modules and 2 drive cycles.
Result
- Energy Storage system with 26 modules and 3 drive cycles.
Result
- Energy Storage system with 27 modules and 3 drive cycles.
Result
- Energy Storage system with 28 modules and 3 drive cycles.
Result
Drive cycle-2
Battery mod Voltage Km Battery weight
26 321 35.5 286
27 333 35.5 297
28 345 35.5 308
Drive cycle-3
Battery mod Voltage Km Battery weight
26 321 42.7 286
27 333 44.8 297
28 345 46.3 308
Battery modules 28 and with 3 drive cycles, the distance travelled is 46.3 km.
- While changing the battery module in drive cycle 2 we get constant distance travel.
- Changing the battery module in drive cycle 3 we get changes in distsance travel by vehicle .
- To cover 45 km distance a 28 module 345- volt battery is required.
Q3.Perform gradeability test with Prius_Jpn_defaults_in file.
Compare your results in the table and conclude.
- In ADVISOR tool Vehicle Input window select PRIUS_Jpn_default model.
- Continue to the window.
- Simulation Parameter will open.
- Select the gradeability test and click on the grade Option box , a new dialogue box will open.
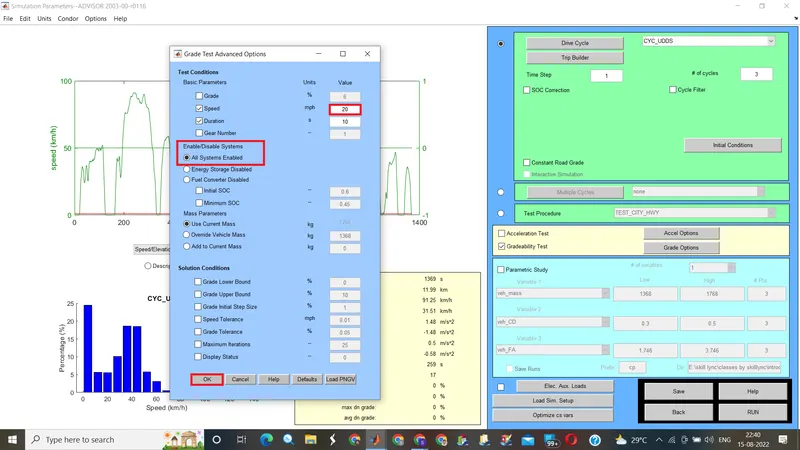
- In grade option box we can change speed or duration with respect to our simulation.
- So , for this simulation, I change speed one time and duration another time.
- Click on all system enabled.
- Also , click on constant road grade.
- Click ok and run the simulation and a Result window will open showing different results depend upon input data.
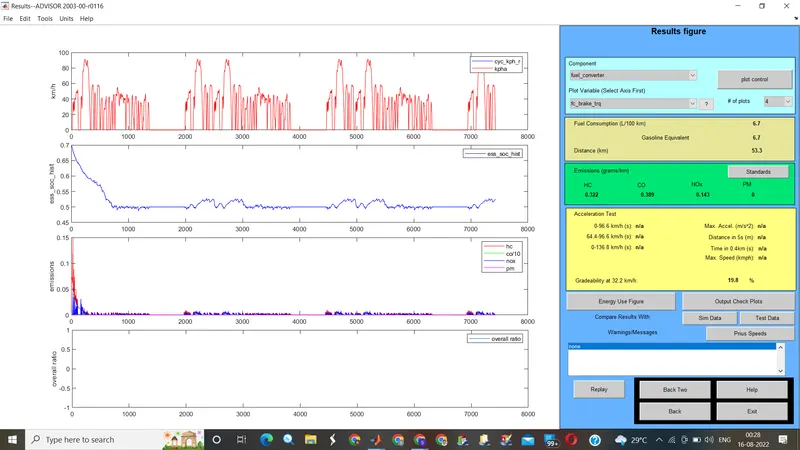
Results for the duration -10sec
- Speed -20 miles/h or 32.2 kmph
Gradeability=19.8%
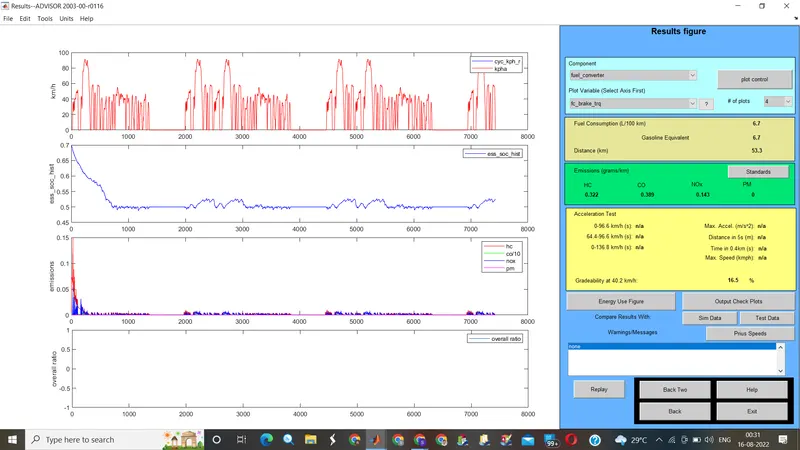
ii. Speed -25 miles/h or 40.2 kmph
Gradeability=16.5%
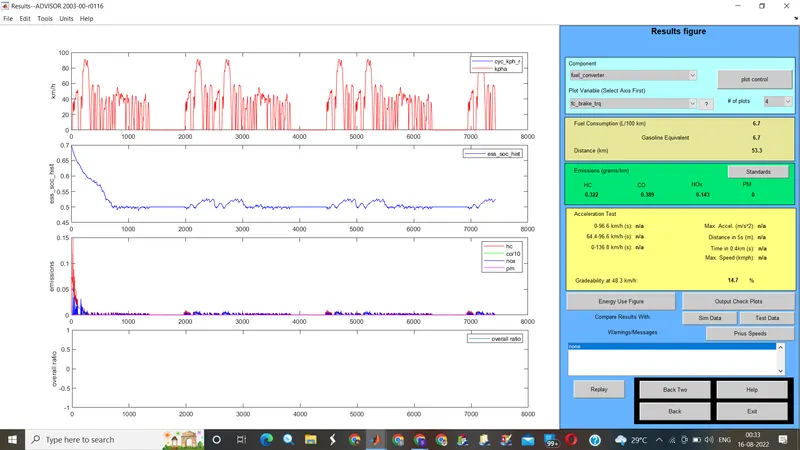
iii. Speed -30 miles/h or 48.3 kmph
Gradeability=14.7%
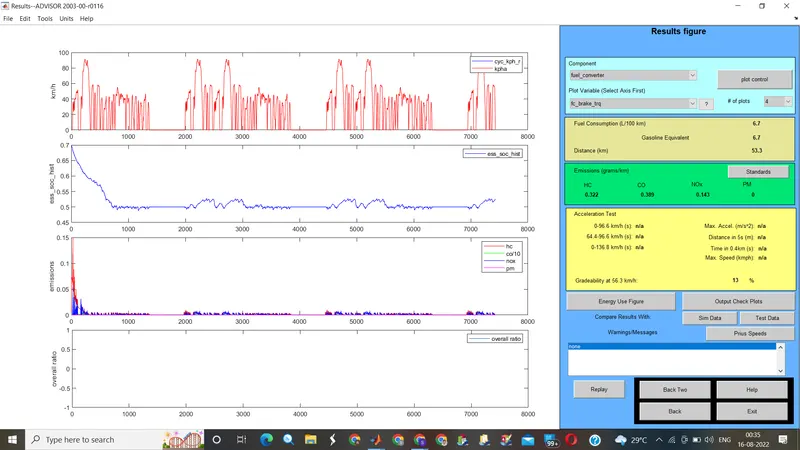
iv. Speed -35 miles/h or 56.3 kmph
Gradeability=13%
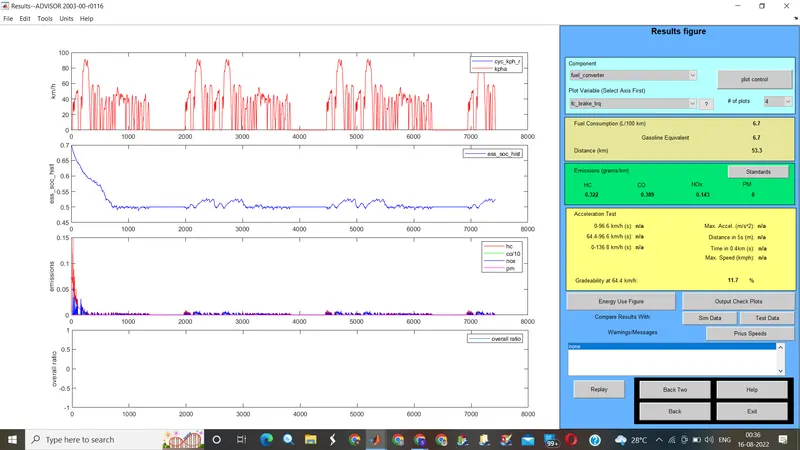
v. Speed - 40 miles/h or 64.4 kmph
Gradeability=11.7%
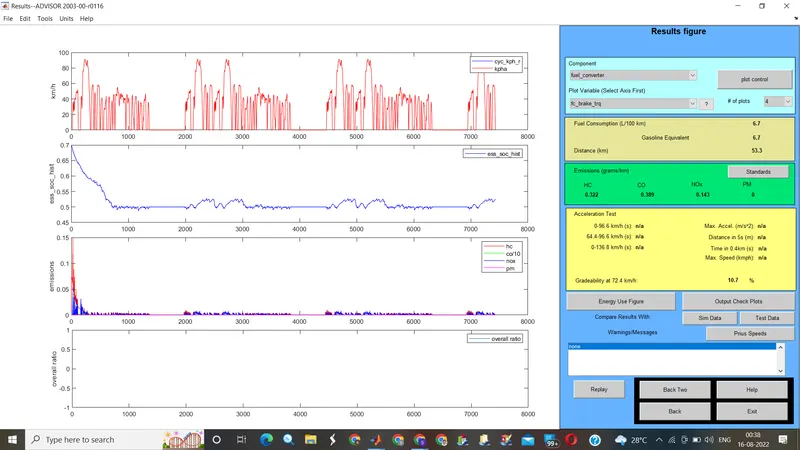
vi. Speed -45 miles/h or 72.4 kmph
Gradeability=10.7%
For duration – 10 sec
S.No Vehicle Speed mph Vehicle Speed kmph Gradeability %
1 20 32.2 19.8%
2 25 40.2 16.5%
3 30 48.3 14.7%
4 35 56.3 13.0%
5 40 64.4 11.7%
6 45 72.4 10.7%
Results for the duration -20 sec
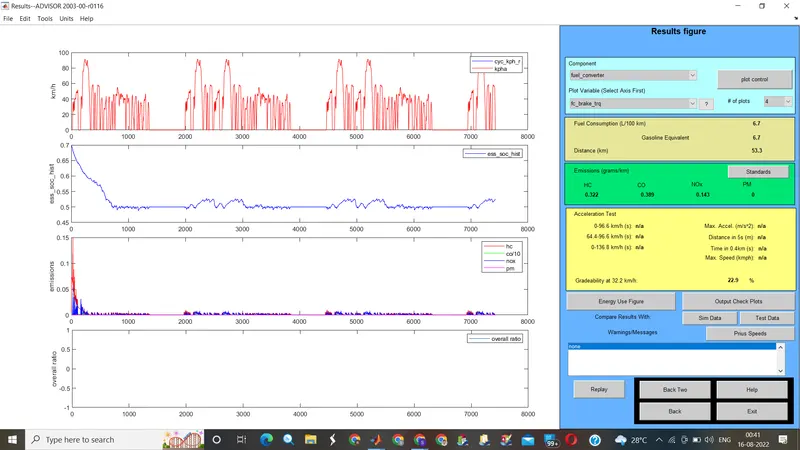
i. Speed -20 miles/h or 32.2 kmph
Gradeability=22.9%
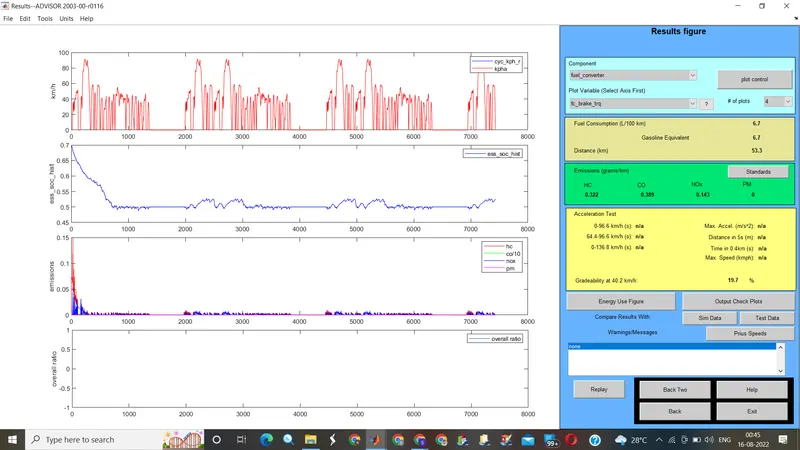
ii. Speed -25 miles/h or 40.2 kmph
Gradeability=19.7%
iii. Speed -30 miles/h or 48.3 kmph
Gradeability=17.7%
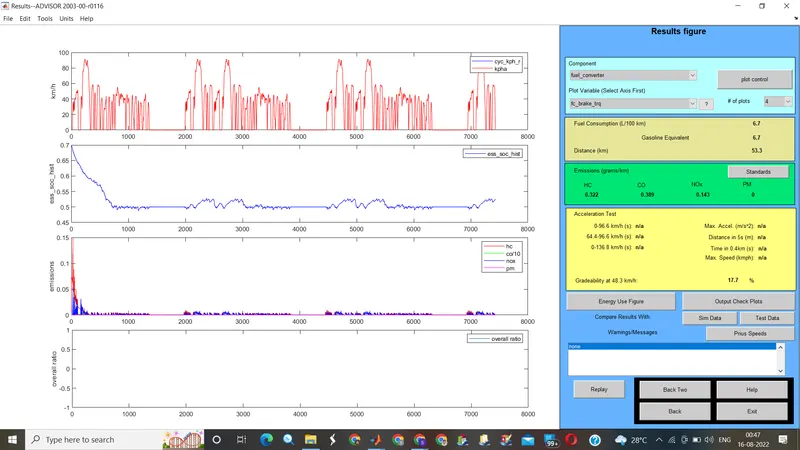
iv. Speed -35 miles/h or 56.3 kmph
Gradeability=16%
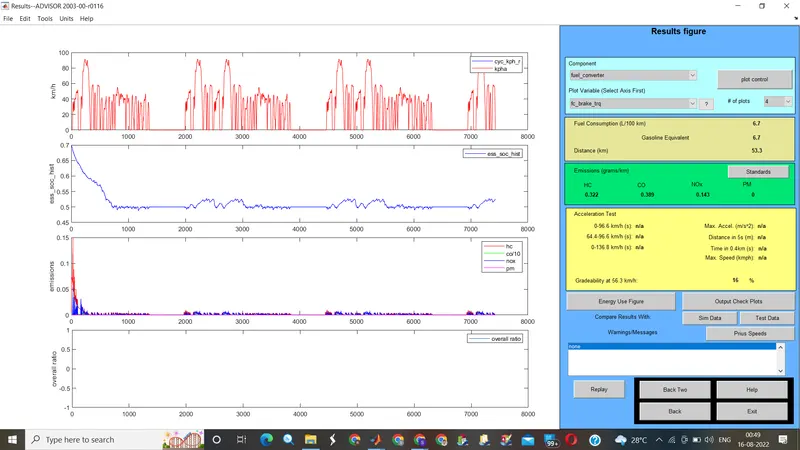
v. Speed - 40 miles/h or 64.4 kmph
Gradeability=14.6%
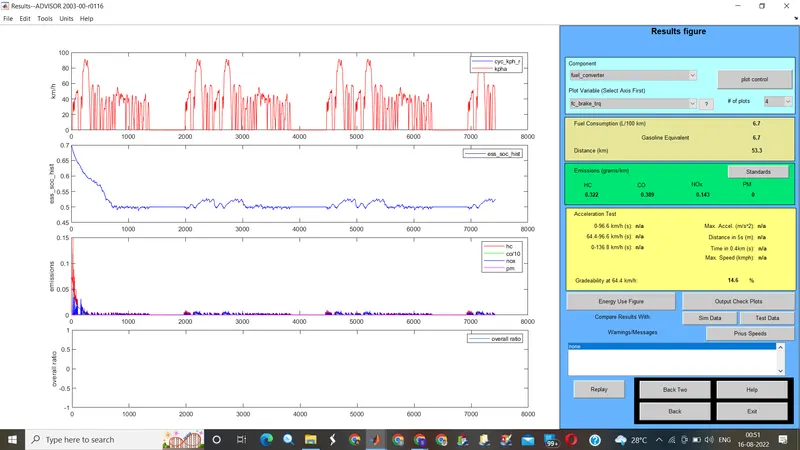
vi. Speed -45 miles/h or 72.4 kmph
Gradeability=13.4%
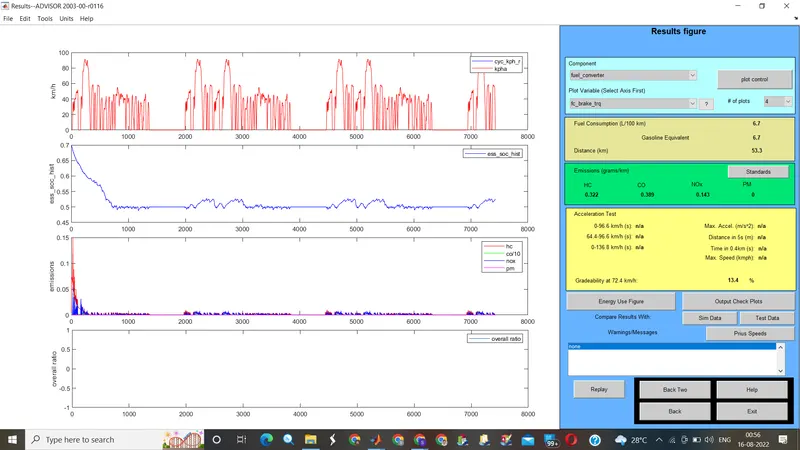
For duration – 20 sec
S.No Vehicle Speed mph Vehicle Speed kmph Gradeability %
1 20 32.2 22.9%
2 25 40.2 19.7%
3 30 48.3 17.7%
4 35 56.3 16.0%
5 40 64.4 14.6%
6 45 72.4 13.4%
From the above tables , it can be seen that when vehicle speed increases there is a decrease in gradeability for both 10 sec and 20 sec duration.
- When vehicle speed increases there is a decrease in gradeability.