Week-3 Challenge: ADVISOR Tool
Use ADVISOR tool and simulate the following
1. For EV_defaults_in file, if cargo mass is 500 kg with all other default conditions, can the vehicle travel for 45 km with FTP drive cycle? Conclude your observations.
2. In the above case, try changing the battery capacity and repeat the simulation.
Ans:
In advisor selected load file EV_default_in and set Cargo mass=500
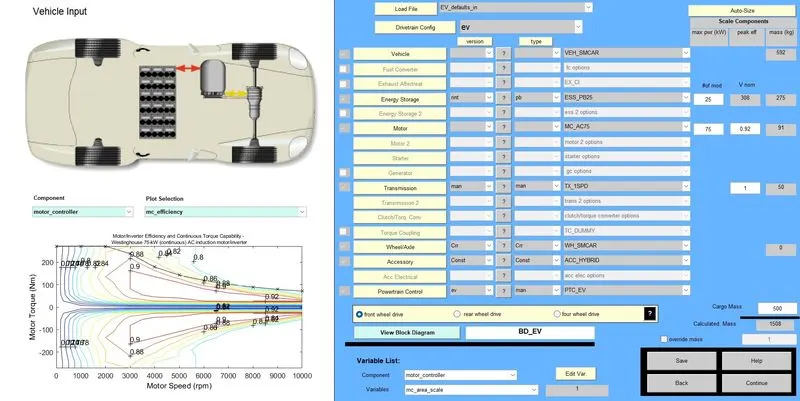
Then click continue option we set drive cycle
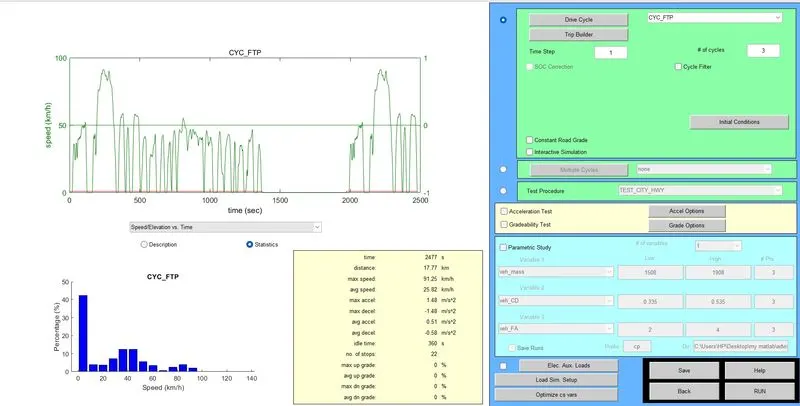
For drive cycle=1 we got the output as given below
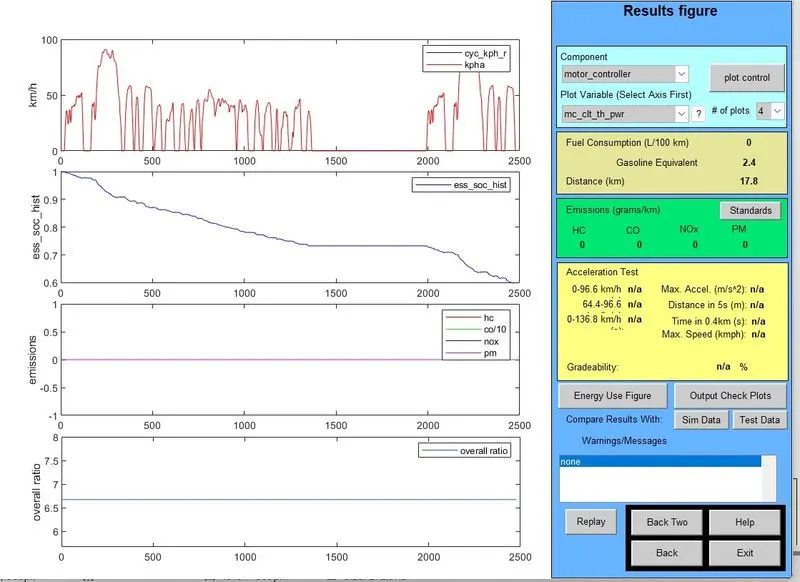
Observation:
- Distance traveled by vehicle is 17.8km
- soc remaining
For drive cycle=2 we got the plot as given below
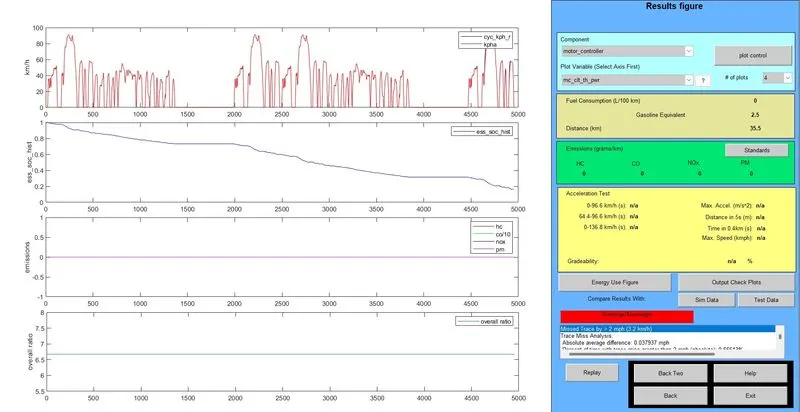
Observation:
- Distance traveled by vehicle is 35.5km
- SOC remaining
For drive cycle=3 we got the plot as shown below
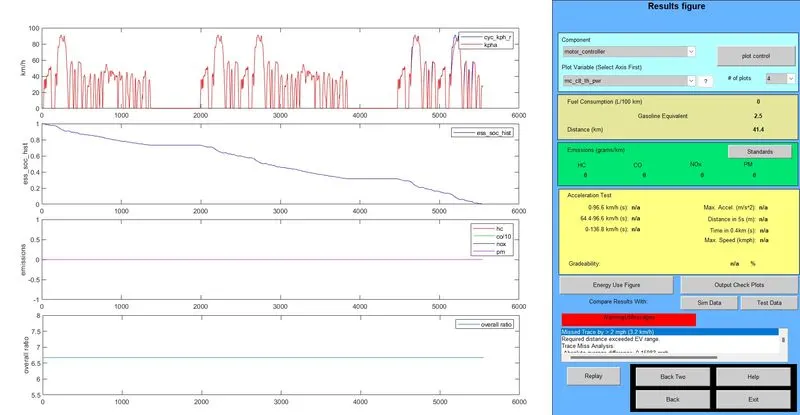
Observation:
- Distance traveled by vehicle is 41.4km
- SOC used completely
Conclusion:
The vehicle cant travel for 45km with FTP drive cycle.
ans2.
Changed battery capacity value in #of mod for dirive cycle 2 and 3 and run the simulation
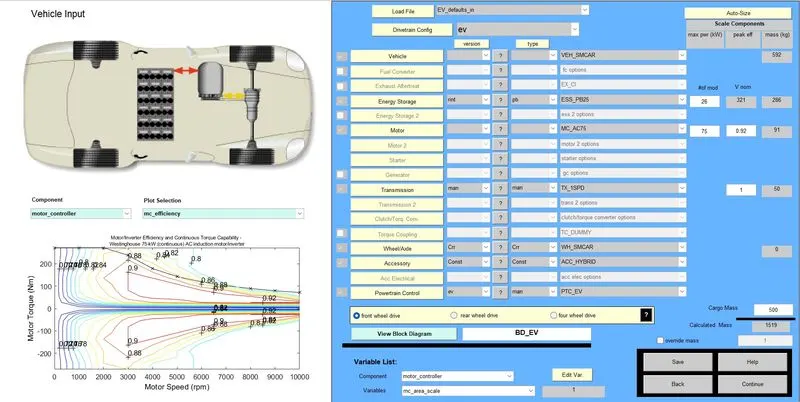
Drive cycle =2
- capacity of battery=26module maximum distance traveled=35.5km
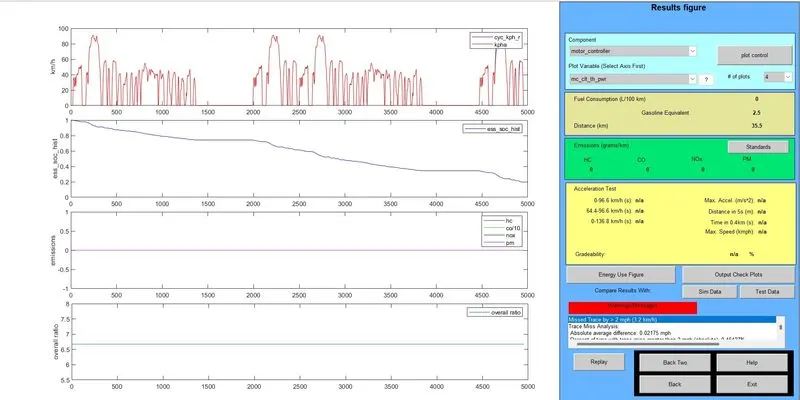
- capacity of battery=27module maximum distance traveled=35.5km
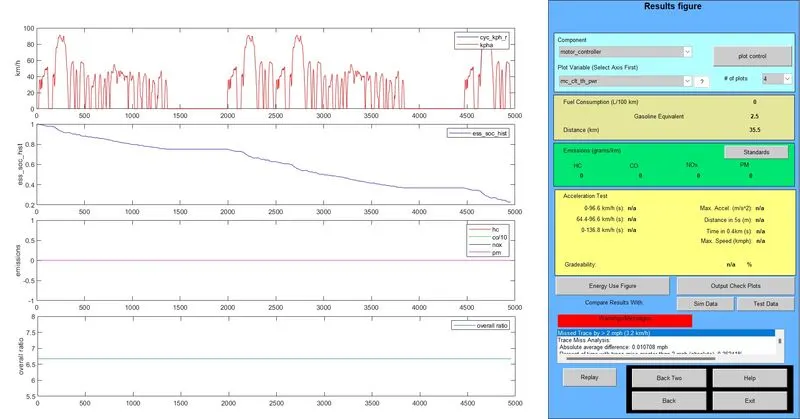
- capacity of battery =28module maximum distance traveled 35.5km
Drive cycle =3
- capacity of battery=26module maximum distance traveled=42.7km
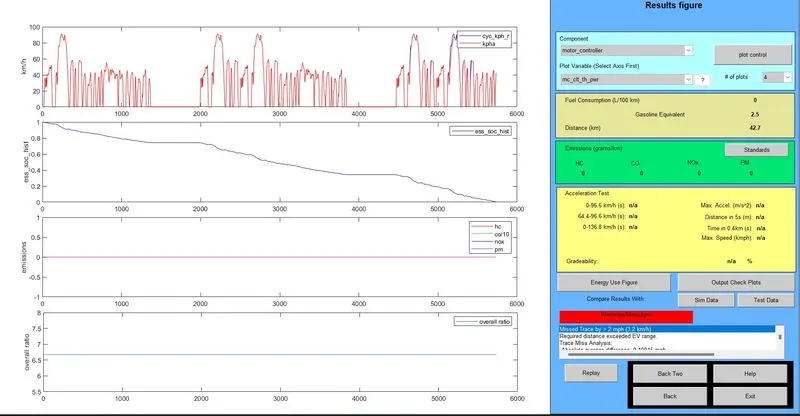
- capacity of battery =27 modulemaximum distance traveled=44.8km
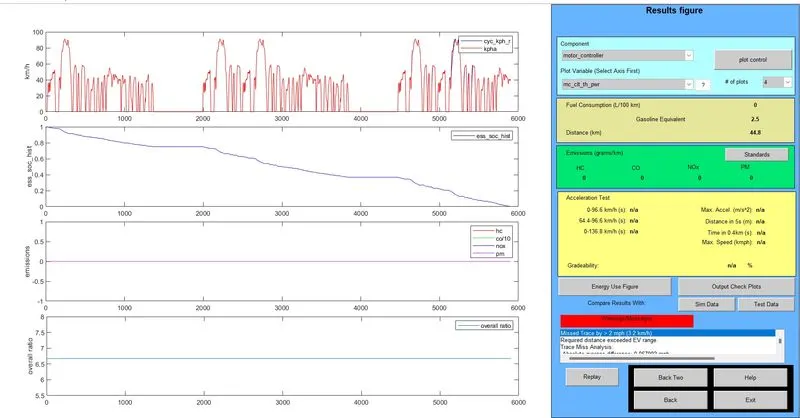
- capacity of battery=28 module maximum distance traveled=46.3km
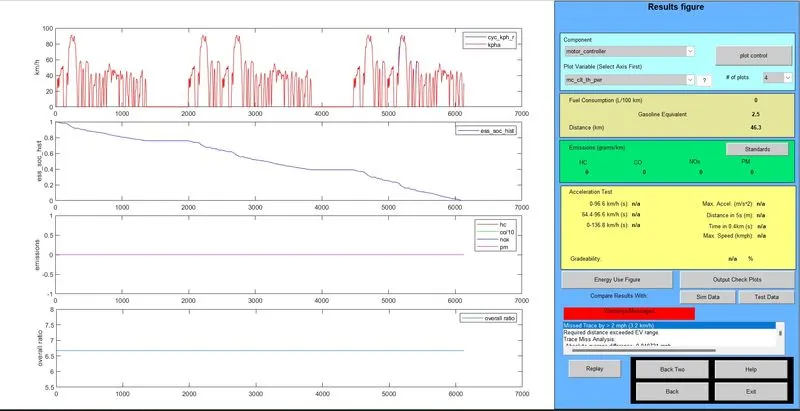
| battery capacity | No.drive cycle=2 | No.drivecycle=3 |
| distance traveled | in km | |
| 26 module | 35.5 | 42.7 |
| 27module | 35.5 | 44.8 |
| 28module | 35.5 | 46.3 |
- When drive cycle =2 distance is constant,=35.5km
- When drive cycle=3 for different battery capacity distance traveled changes
- So to cover 45km distance 28module battery required for 3 drive cycle.
3. Perform gradeability test with PRIUS_Jpn_defaults_in file
Compare your results in table and conclude.
In advisor tool we select load file PRIUS_JPN_default_in
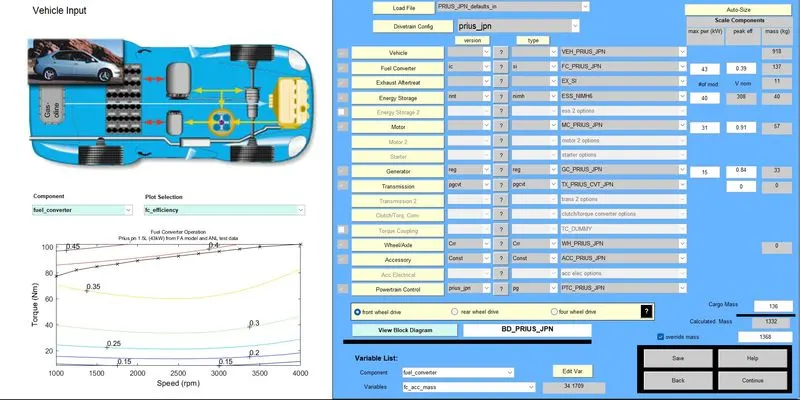
then click on continue
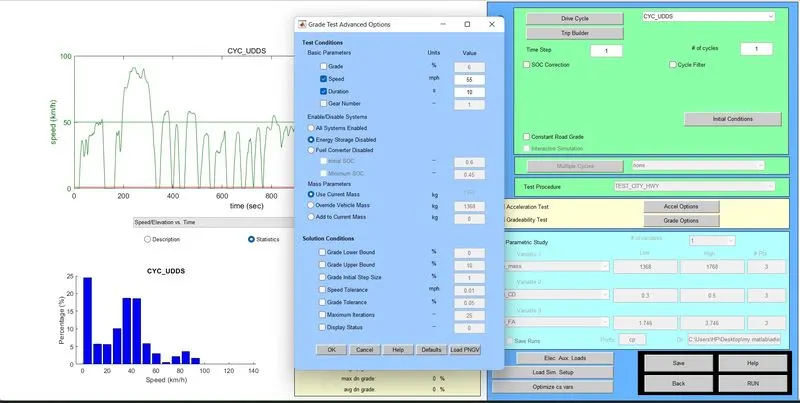
we get the next window as shown above in this we select Gradeabilitytest .
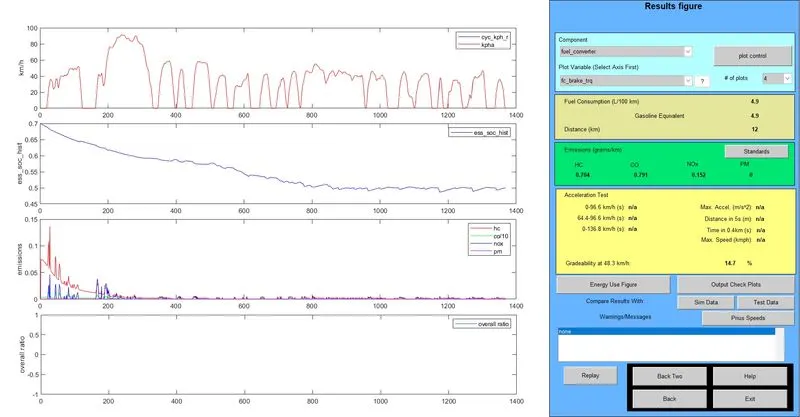
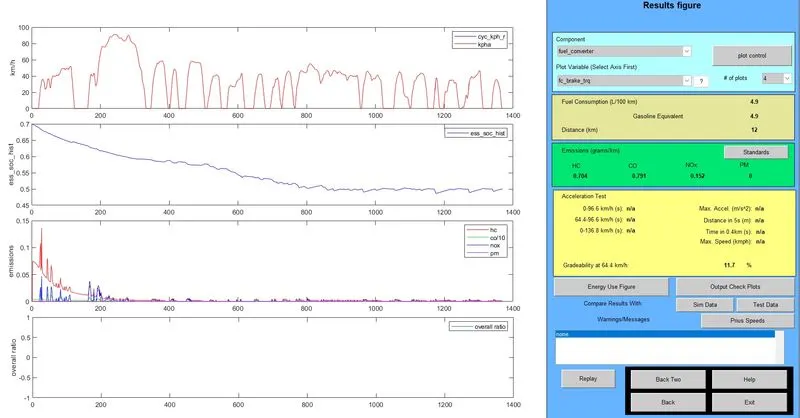
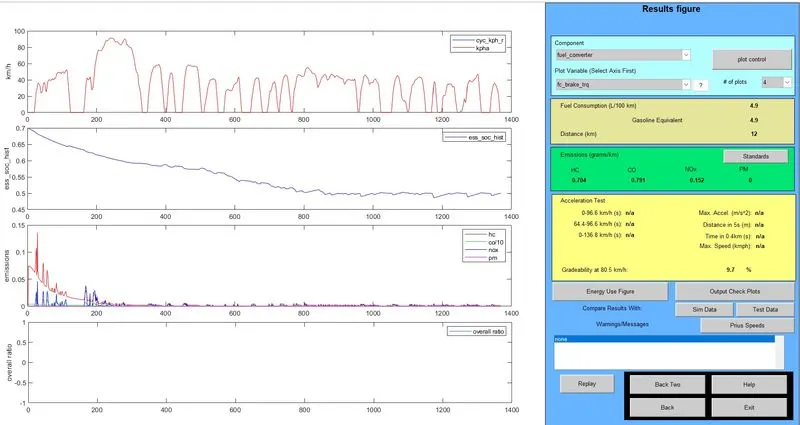
In this we enabled all system and run the simulation for 30 mph 40mph and 50 mph speeds results are given below
For 30mph speed we got gradeability 14.7%
For 40mph we got gradeability 11.7%
For 50mph speed we got 9.7%
then we tabulate the result
| Speed(mph) | 30 | 40 | 50 |
| Speed(kmph) | 48.3 | 64.4 | 80.5 |
| Gradeability(%) | 14.7 | 11.7 | 9.7 |
Conclusion:
- By analysing above table Its clear that when speed of the vehicle increases gradeability decreases
- So we concluded that Speed of the vehicle and Gradeabilty of a vehicle are inversly proportional.