Electric Vehicle Simulation using ADVISOR Tool
ADVISOR Tool for Simulation
ADVISOR, NREL’s ADvanced VehIcle SimulatOR, is a set of model, data, and script text files for use with Matlab and Simulink. It is designed for rapid analysis of the performance and fuel economy of conventional, electric, and hybrid vehicles. ADVISOR also provides a backbone for the detailed simulation and analysis of user defined drivetrain components, a starting point of verified vehicle data and algorithms from which to take full advantage of the modeling flexibility of Simulink and analytic power of MATLAB.
Uses of Advisor Tool
- estimate the fuel economy of vehicles that have not yet been built
- learn about how conventional, hybrid or electric vehicles use (and lose) energy throughout their drivetrains
- compare relative tailpipe emissions produced on a number of cycles
- evaluate an energy management strategy for your hybrid vehicle’s fuel converter
- optimize the gear ratios in your transmission to minimize fuel use or maximize performance, etc.
Q1. For EV_defaults_in file, if cargo mass is 500 kg with all other default conditions, can the vehicle travel for 45 km with the FTP drive cycle?
Electric Vehicle
An electric vehicle (EV), also called electrics is a vehicle that uses one or more electric motors or traction motors for propulsion. An electric vehicle may be powered through a collector system by electricity from off-vehicle sources, or maybe self-contained with a battery, solar panels, fuel cells, or an electric generator to convert fuel to electricity.
FTP Drive Cycle
The FTP-75 (Federal Test Procedure) has been used for emission certification and fuel economy testing of light-duty vehicles in the United States. The test is often referred to as simply ‘FTP’ (this should not be confused with the FTP test for heavy-duty engines).
The FTP-75 and the FTP-72 are two variants of the EPA Urban Dynamometer Driving Schedule (UDDS). The FTP-75 cycle is derived from the FTP-72 by adding a third phase of 505 s, identical to the first phase of FTP-72 but with a hot start. The third phase starts after the engine is stopped for 10 minutes.
Thus, the entire FTP-75 cycle consists of the following segments:
- Cold start transient phase (ambient temperature 20-30°C), 0-505 s,
- Stabilized phase, 506-1372 s,
- Hot soak (min 540 s, max 660 s),
- Hot start transient phase, 0-505 s.
Inputs Given
Vehicle Type= EV_defaults_in
Cargo Mass=500kg
Drive Cycle=FTP
Setting Up Advisor Tool Setting Up Advisor Tool
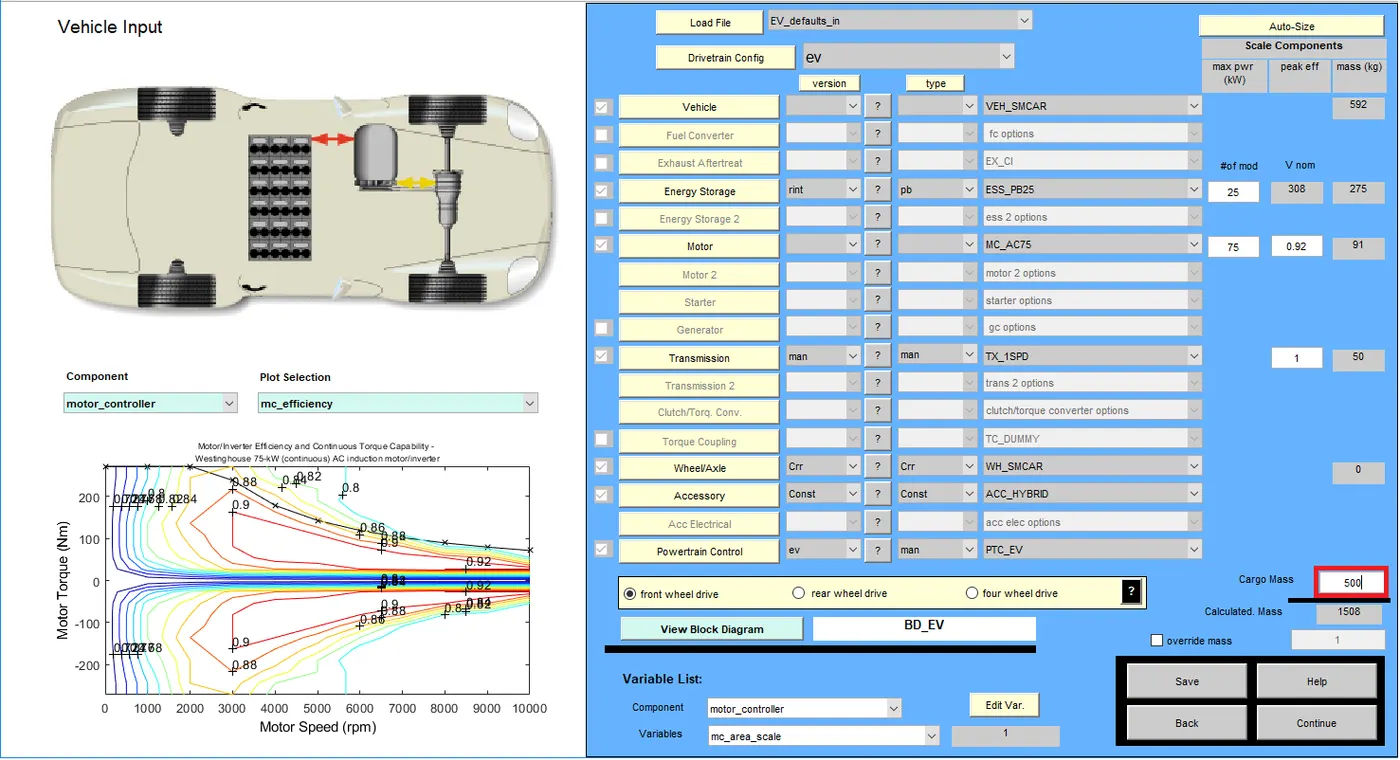
The Advisor input screen 1
Input screen-1 lets us choose the various architecture of the vehicle.
Cargo Mass modified to 500kg
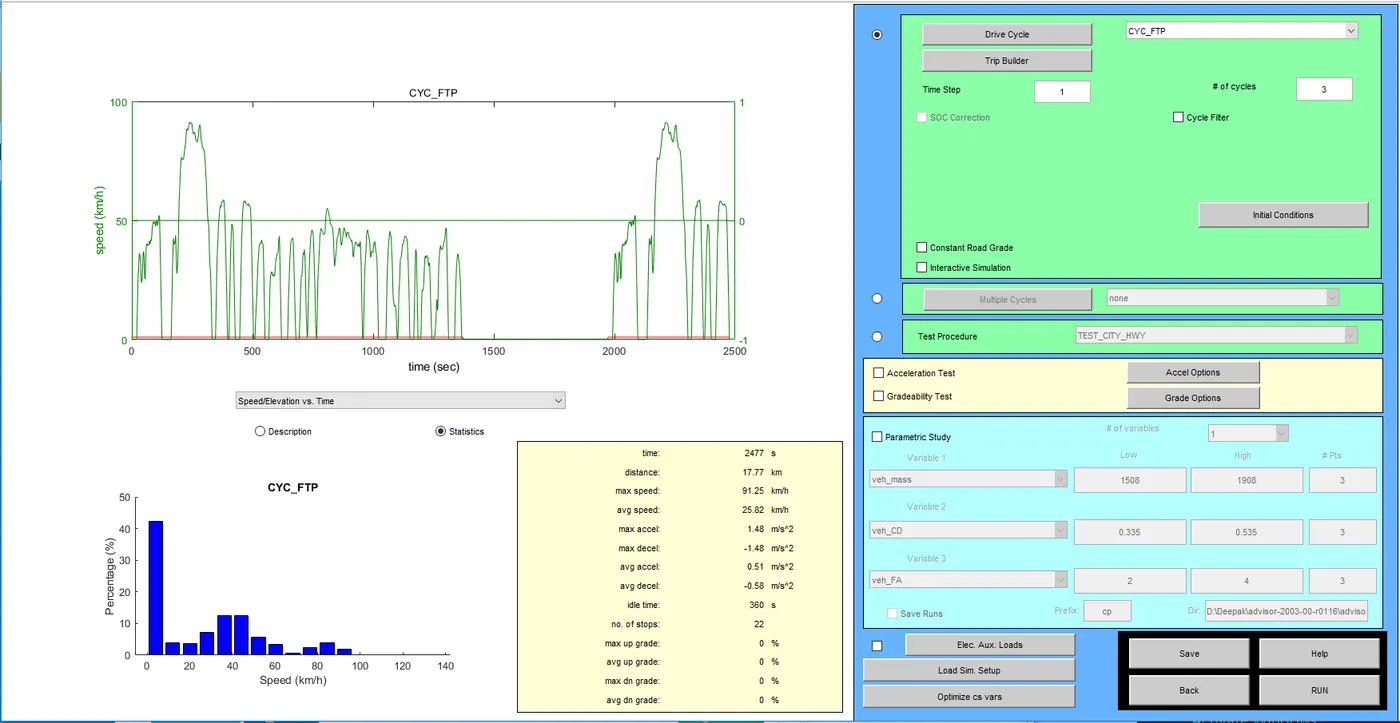
The Advisor input screen 2
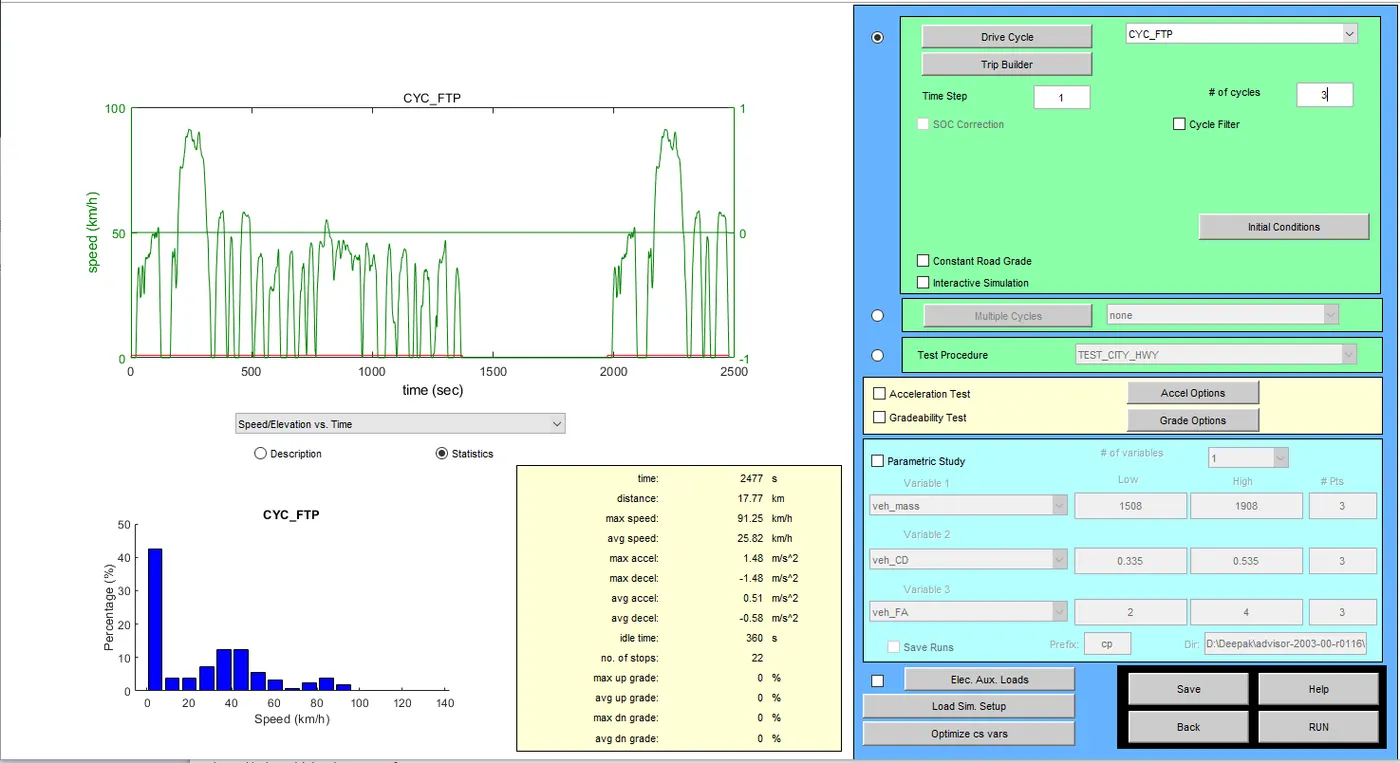
Input screen-2 lets us choose the input for the architecture. We can select give input such as drive cycle, gradient, and various tests that we need to perform the vehicle architecture.
Here we choose FTP-cycle which covers a distance of 17.77km in 2477 seconds, but our test condition is to check the range up to 45km, so we modify the drive cycle number to 3 times.
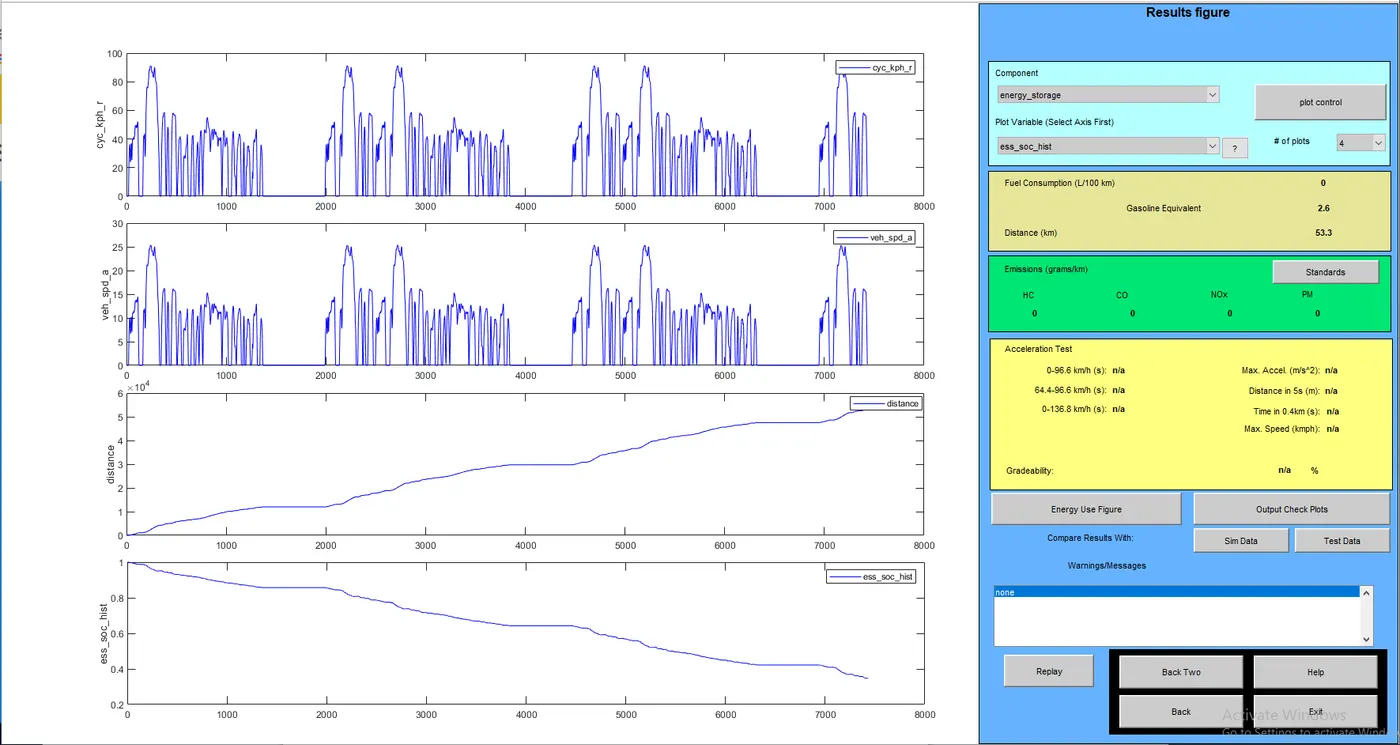
Advisor Output Screen
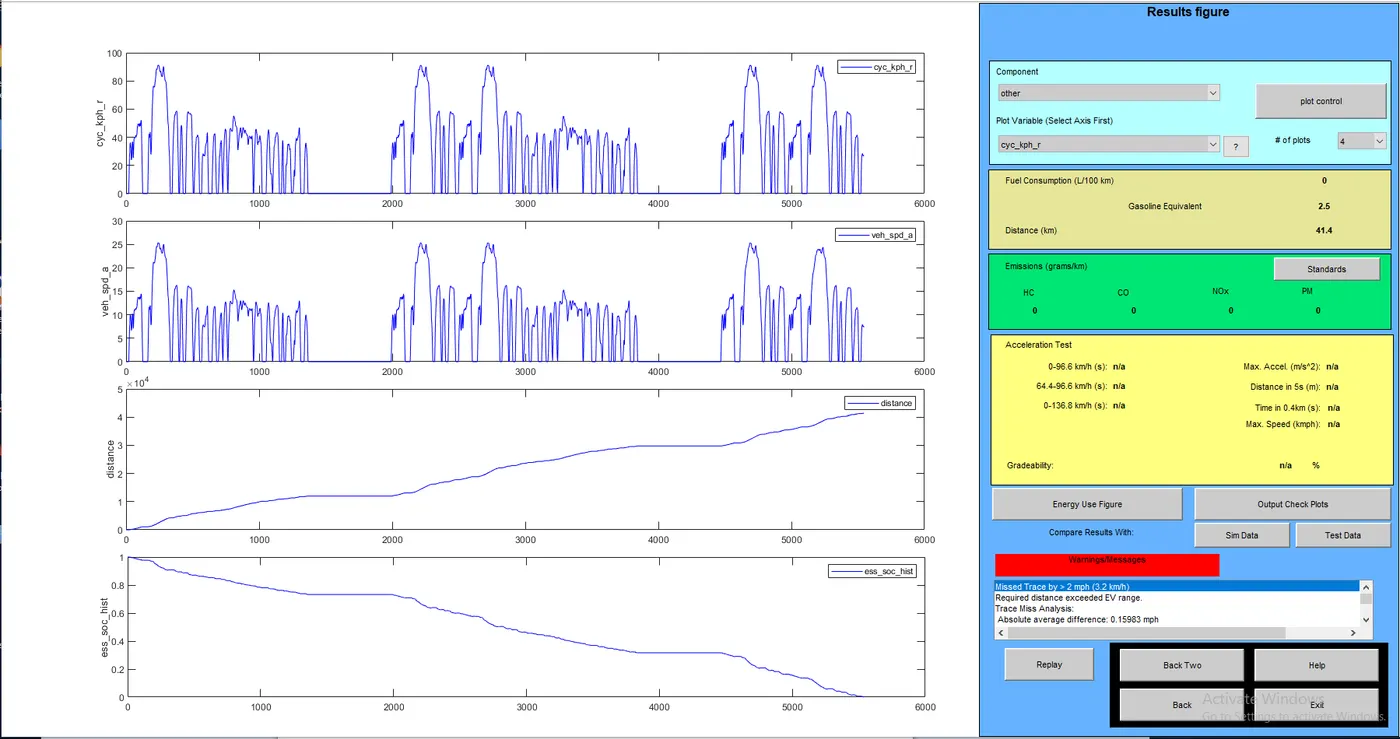
The advisor output screen gives us results based on vehicle architecture selected and the test parameters we provide such as drive cycle,gradeability, etc. The results can be plotted and analyzed based on our requirements.
Here the first plot shows the given input drive cycle where we specify the speed with respect to time for the vehicle. With our given parameters we can see that vehicle was not able to achieve the given input speed with the payload we have specified. The vehicle was only able to cover a distance of 41.4 km and the state of charge of the vehicle became zero.
Q2. In the above case, try changing the battery capacity and repeat the simulation.
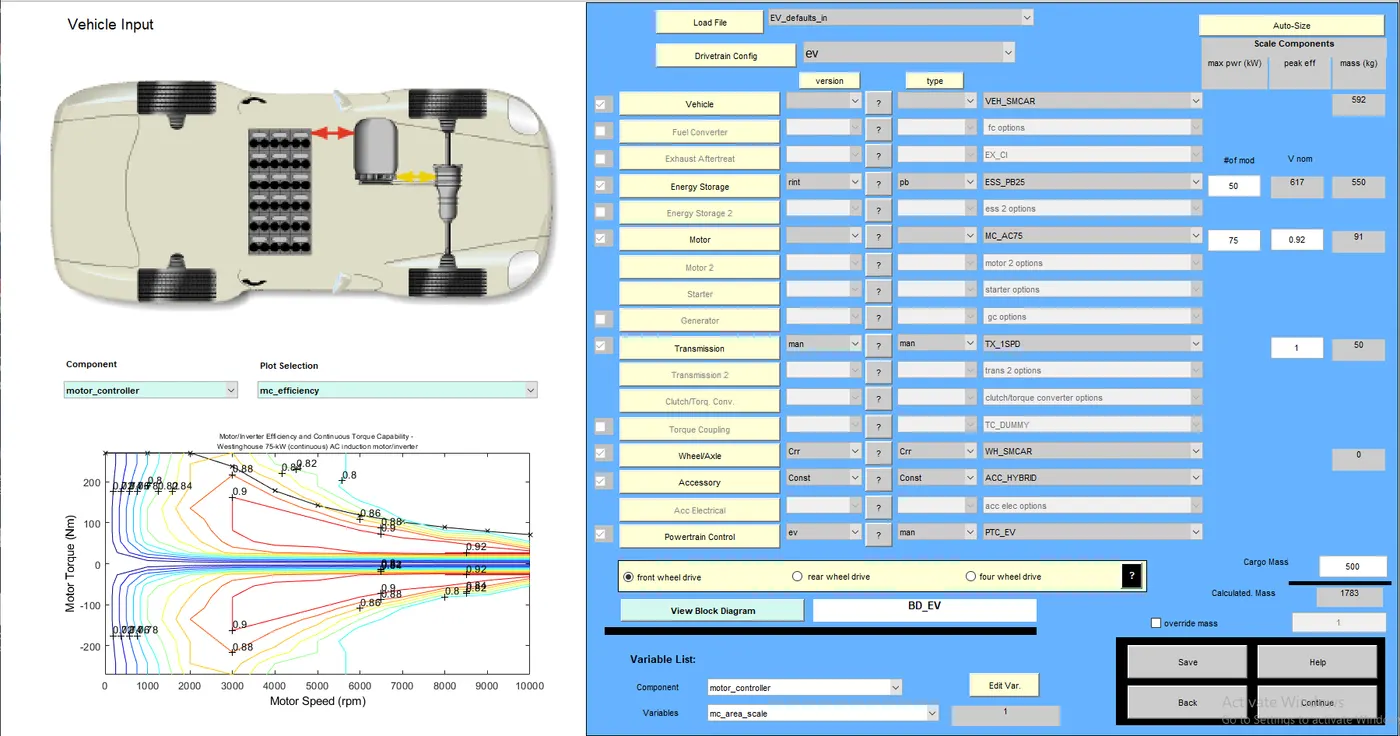
To check the range of the vehicle with the same architecture we double the battery module for the vehicle keeping all other specifications unchanged.
The no. of battery modules was doubled from 25 to 50, thus increasing the weight and the battery capacity of the vehicle. The weight increases from 1508kg to 1783kg for the vehicle.
The Advisor input screen 2
The drive cycle input and test condition are kept the same as the first case.
Advisor Output Screen
Here the first plot shows the given input drive cycle where we specify the speed with respect to time for the vehicle. With our given parameters we can see that vehicle was not able to achieve the given input speed with the payload we have specified. The vehicle was able to complete the drive cycle and the state of charge of the vehicle is about 35.
Q3. Perform gradeability test with PRIUS_Jpn_defaults_in file.
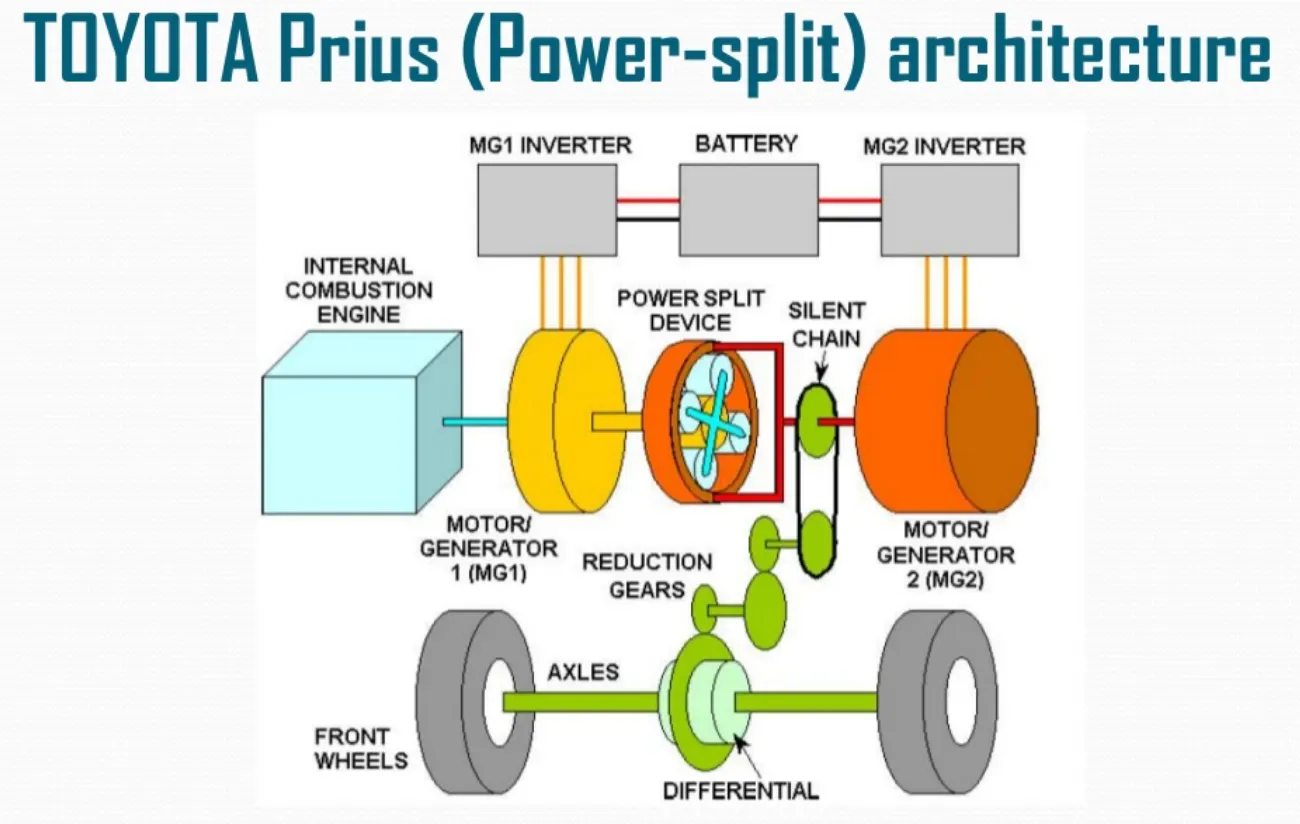
Toyota Hybrid System is the innovative powertrain used in the current best-selling hybrid vehicle on the market—the Prius. It uses a split-type hybrid configuration that contains both a parallel and a serial power path to achieve the benefits of both.
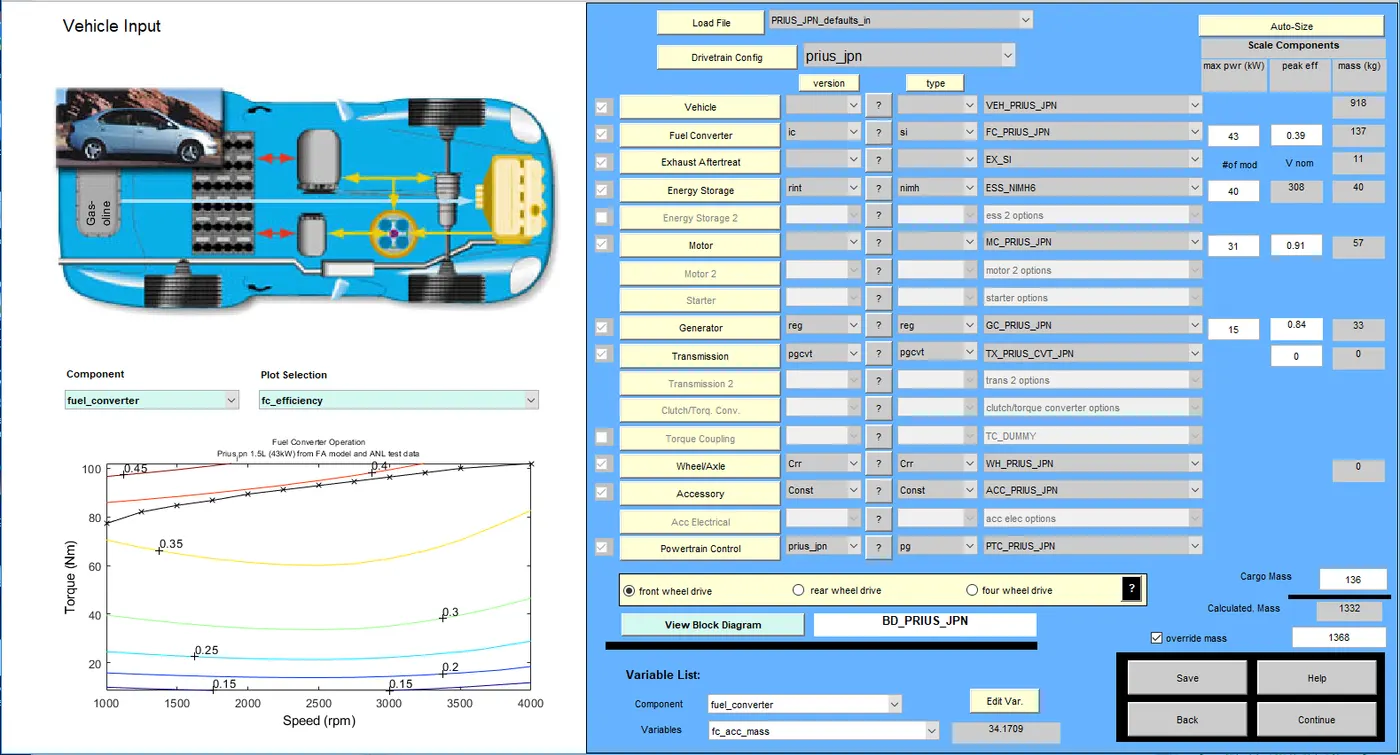
The Advisor input screen 1
The vehicle architecture is kept in default condition and the payload of 136kg is added by default.
The Advisor input screen 2
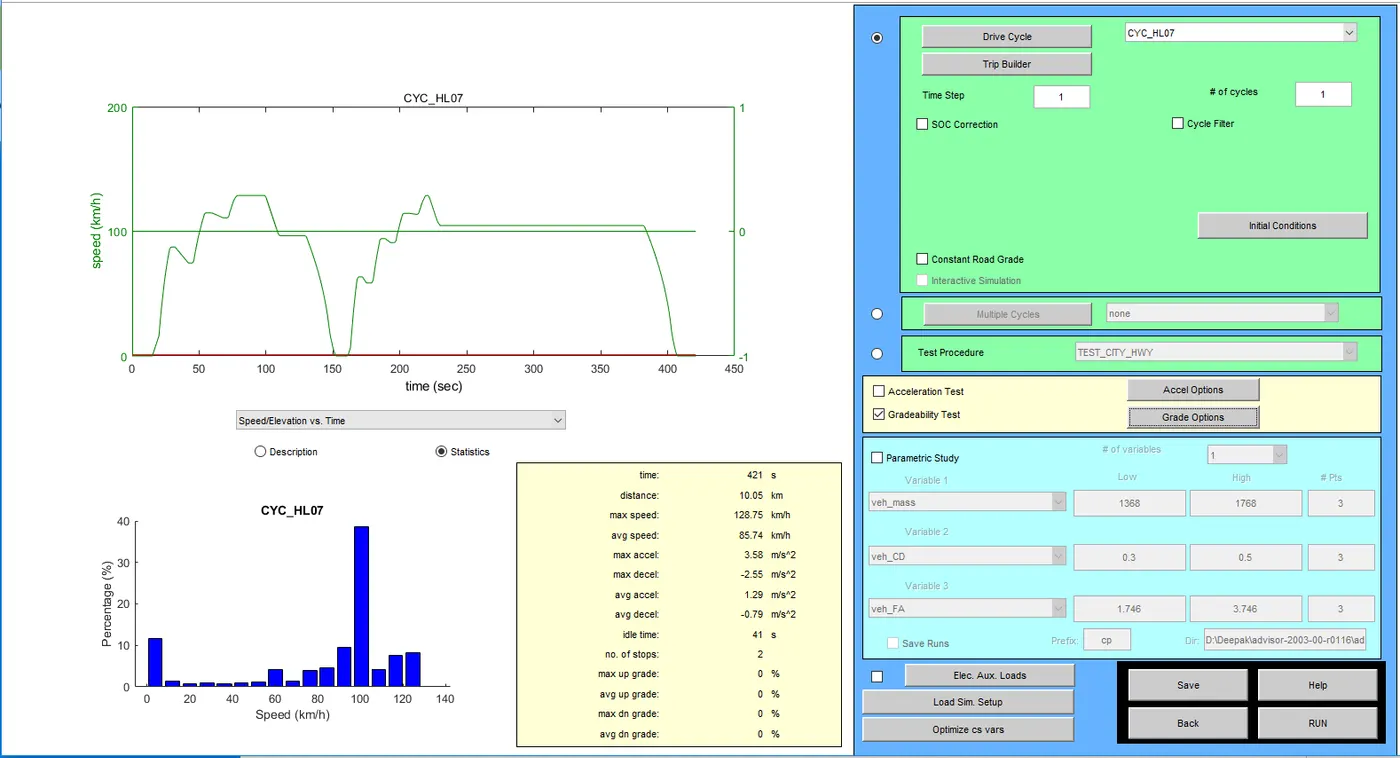
HL07 Drive Cycle
US Environmental Protection Agency HL07 engineered cycle was developed by EPA in coordination with auto manufacturers. The purpose of this cycle was to test vehicles on a series of acceleration events over a range of speeds, so severe that most vehicles will go into WOT operation.
Here I have used HL07 drive cycle to keep the vehicle in high throttle condition and have set the road grade to a constant of 25%.
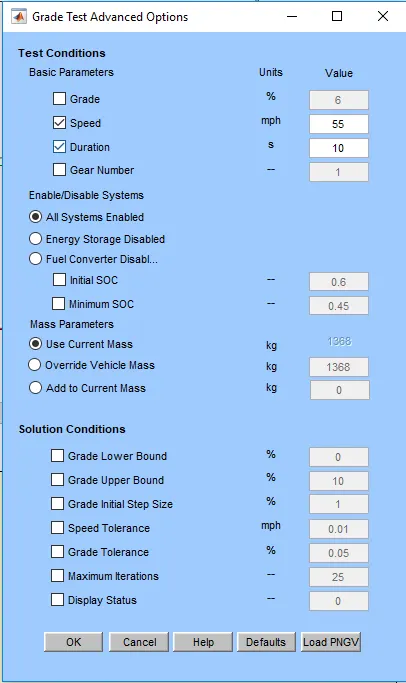
Case 1
For the gradability of the vehicle, speed is 88.5kmph in the duration of 10 seconds.
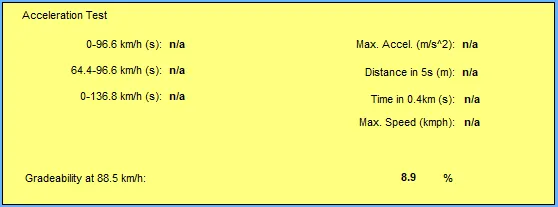
Result for Gradeability Test
At a speed of 88.5kmph, the gradeability of the vehicle is 8.9%
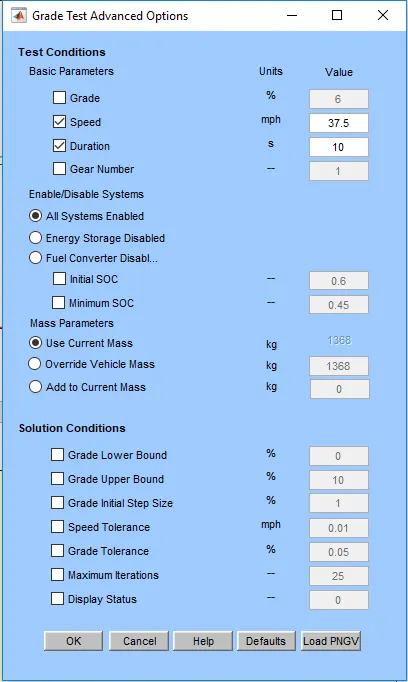
Case 2
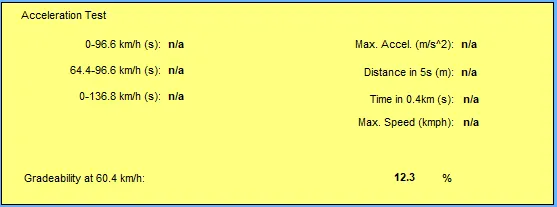
For the gradability of the vehicle, speed is 60.4kmph in the duration of 10 seconds.
Result for Gradeability Test
At a speed of 60.4kmph, the gradeability of the vehicle is 12.3%
Case 3
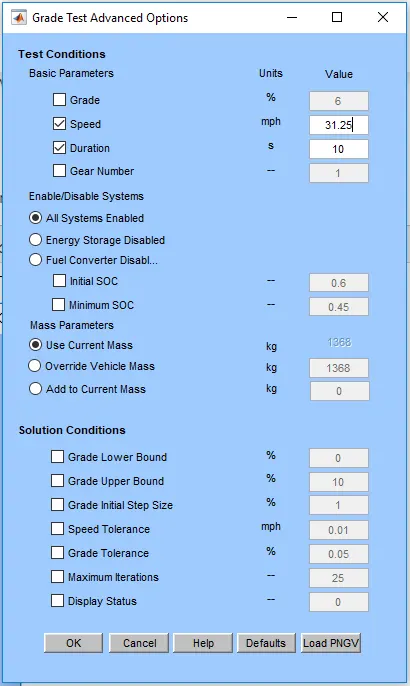
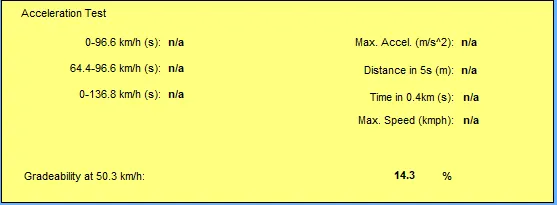
For the gradability of the vehicle, speed is 50.3kmph in the duration of 10 seconds.
Result for Gradeability Test
At a speed of 50.3kmph, the gradeability of the vehicle is 14.3%
Case 4
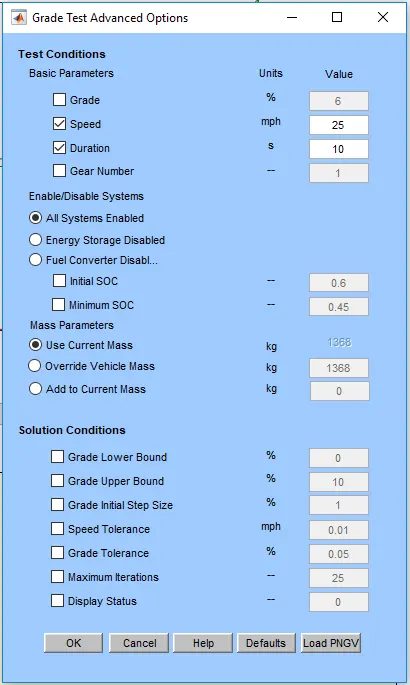
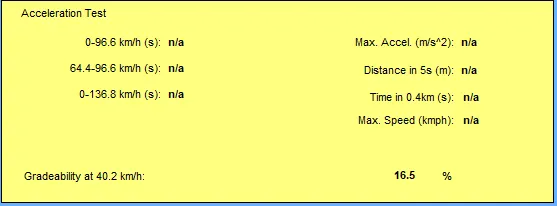
For the gradability of the vehicle, speed is 40.2kmph in the duration of 10 seconds.
Result for Gradeability Test
At a speed of 40.2kmph, the gradeability of the vehicle is 16.5%
Conclusion
It is clear from the observation that the gradability of the vehicle is more at lower speeds compared to higher speeds. The gradeability also increases with increase in torque, that supplied by the gearbox. At a higher reduction ratio the torque delivered is more and the gradeability of the vehicle increases.
| Gradeability Table | |
| Speed | Gradeability |
| 88.5 | 8.9% |
| 60.4 | 12.3% |
| 50.3 | 14.3% |
| 40.2 | 16.5% |
References
1. http://adv-vehicle-sim.sourceforge.net
2. https://en.wikipedia.org/wiki/Electric_vehicle