Week-3 Challenge: ADVISOR Tool
Objective:
To explore ADVISOR GUI and analyse various EV models for range and gradbility.
Introduction:
Advanced Vehicle Simulator (ADVISOR) was first developed in November 1994 at the National Renewable Energy Laboratory. It was designed as an analysis tool to assist the US Department of Energy (DOE) in developing technologies for hybrid electric vehicles (HEV) through the Hybrid Electric System contracts with Ford,General Motors, and DaimlerChrysler.
Its primary role is to highlight the system-level interactions of hybrid and electric vehicle components and their impacts performance and fuel economy.
ADVISOR uses three primary graphical user interface (GUI) screens to guide the user through the simulation process. Will can iteratively evaluate the impacts of vehicle parameters and drive cycle requirements on the vehicle performance, fuel economy, and emissions. The GUls facilitate interaction with the raw input and output data that is Mathworkspace. The vehicle model is depicted graphically using Simulink block diagrams to be connections between components. The model then reads the input data from the MATLAB workspace during the simulation results to the workspace to be viewed in the results window.
1. For EV_defaults_in file, if cargo mass is 500 kg with all other default conditions, can the vehicle travel for 45 km with FTP drive cycle? Conclude your observations.
steps:
open matlab and type advisor in command window to start ADVISOR tool
In load file tab, select EV_defaults_in file and change cargo mass to 500 kg and select continue.
select FTP in drive cycle tab and click on run.
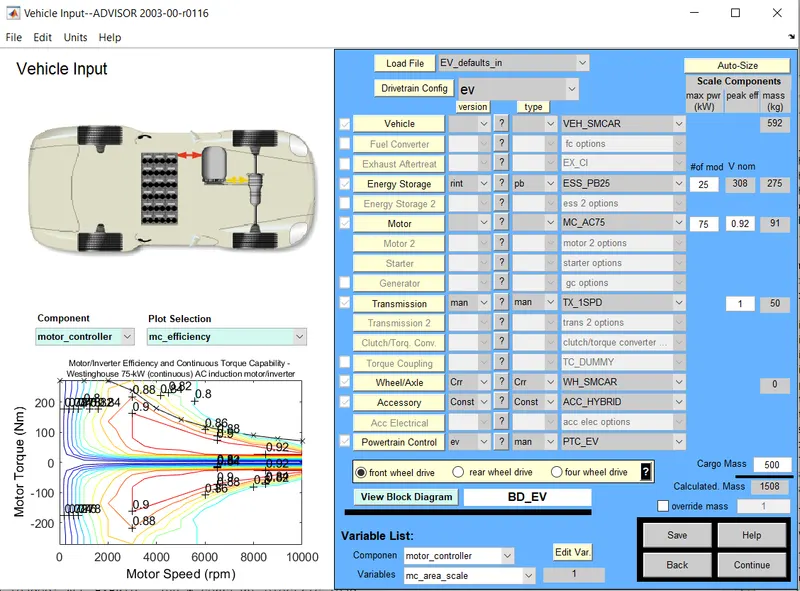
Fig:select EV
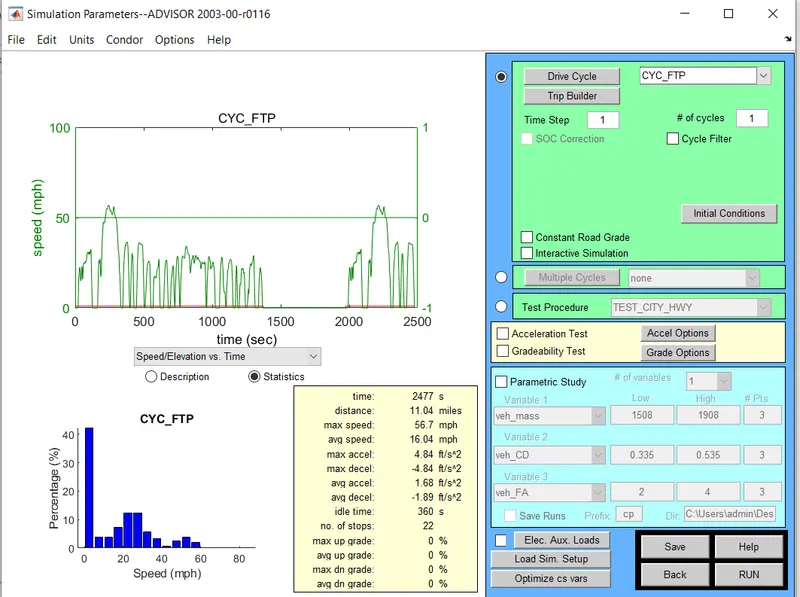
Fig: select drive cycle
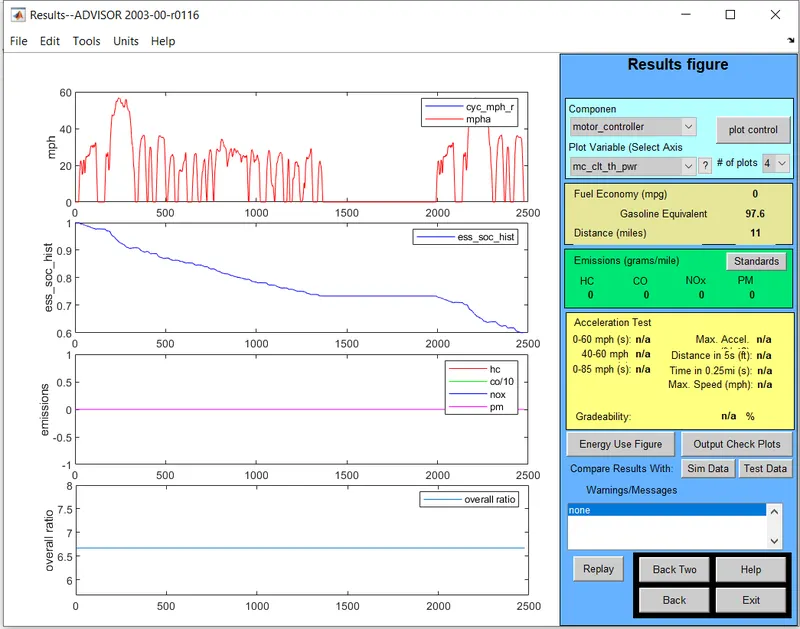
Fig: distance travelled by vehicle after 1st drive cycle
From above figer it ss found that vehicle runs a distance of 11 miles(17.699kmph) after 1st drive cycle with 40% battery power consumption
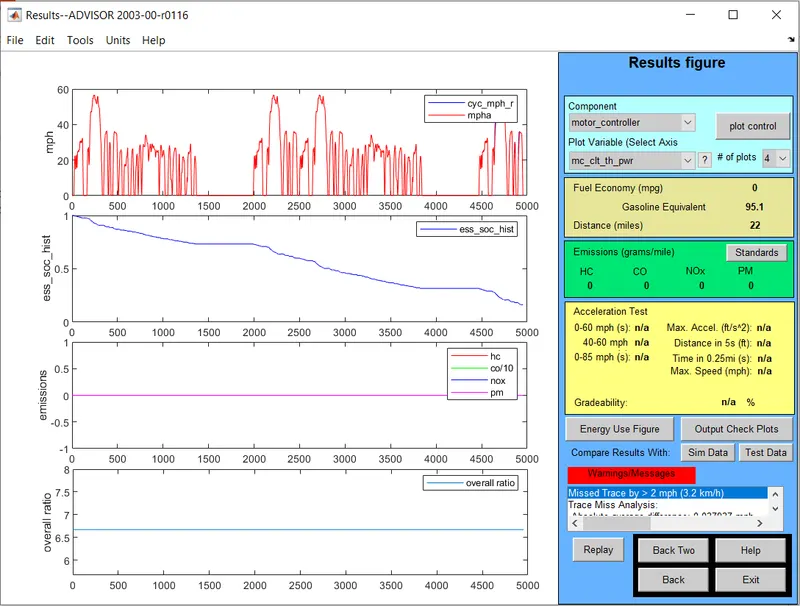
Fig: distance travelled by vehicle after 2nd drive cycle
From above figer it ss found that vehicle runs a distance of 22 miles(35.398kmph) after 2nd drive cycle with 100% battery power consumption
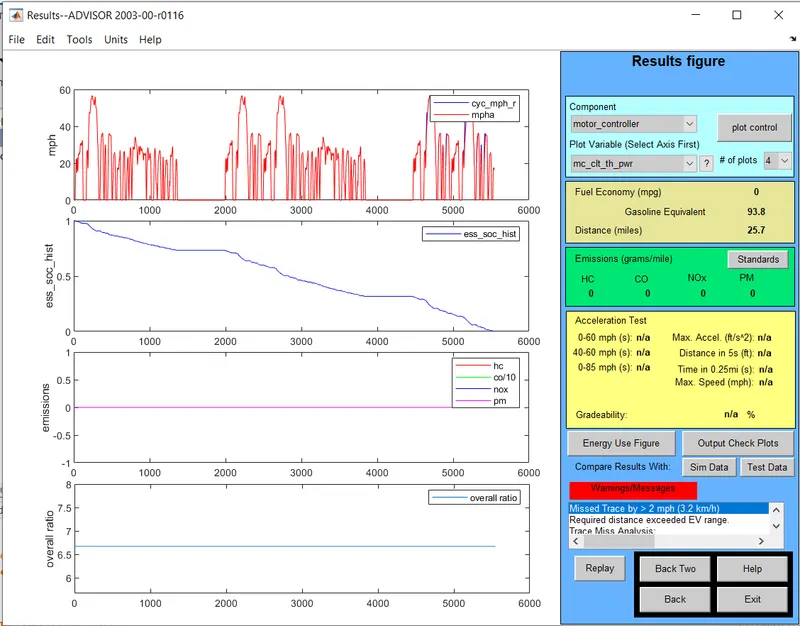
Fig: distance travelled by vehicle after 3rd drive cycle
From above figer it is found that vehicle runs a distance of 25.7 miles(41.35kmph) after 2nd drive cycle with 100% battery power consumption
Vehicle can travel distance of 17.7 km after 1st FTP drive cycle. maximum distance travelled by vehicle after three cycle in single charge is 41.35km.
Therefor, Vehicle cannot travel 45km in single charge.
2. In the above case, try changing the battery capacity and repeat the simulation.
1. Change the no. of battery module = 26 with battery voltage = 321 v
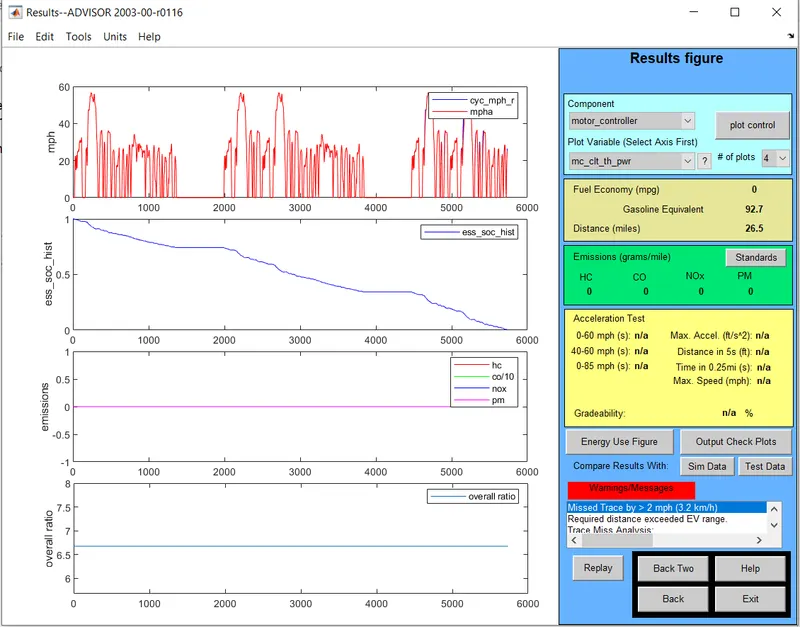
Fig: distance travelled with No. battery module 26
With No of battery module = 26 vehicle can travel distance of 26.5 miles ( 42.63km).
2. Change the no. of battery module = 27 with battery voltage = 333 v
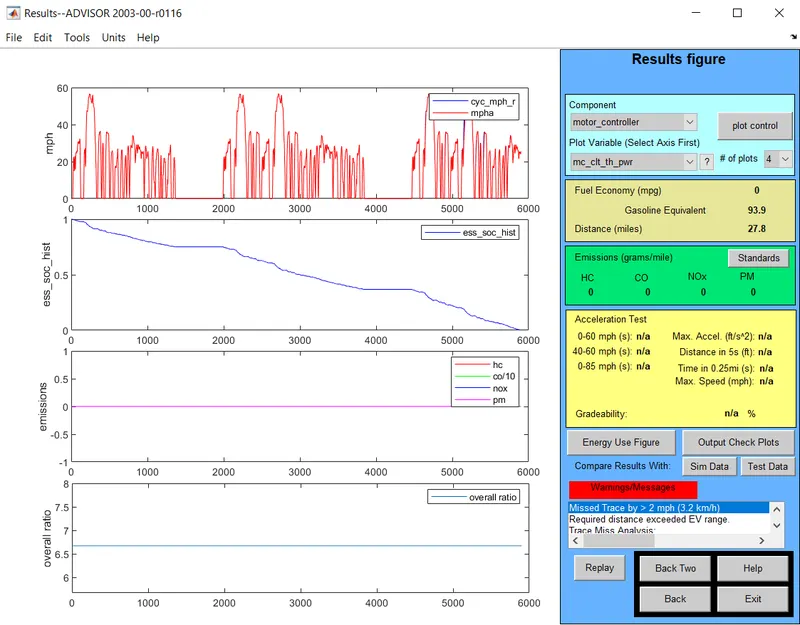
Fig: distance travelled with No. battery module 27
With No of battery module = 27 vehicle can travel distance of 27.8 miles ( 44.73km).
3. Change the no. of battery module = 28 with battery voltage = 345 v
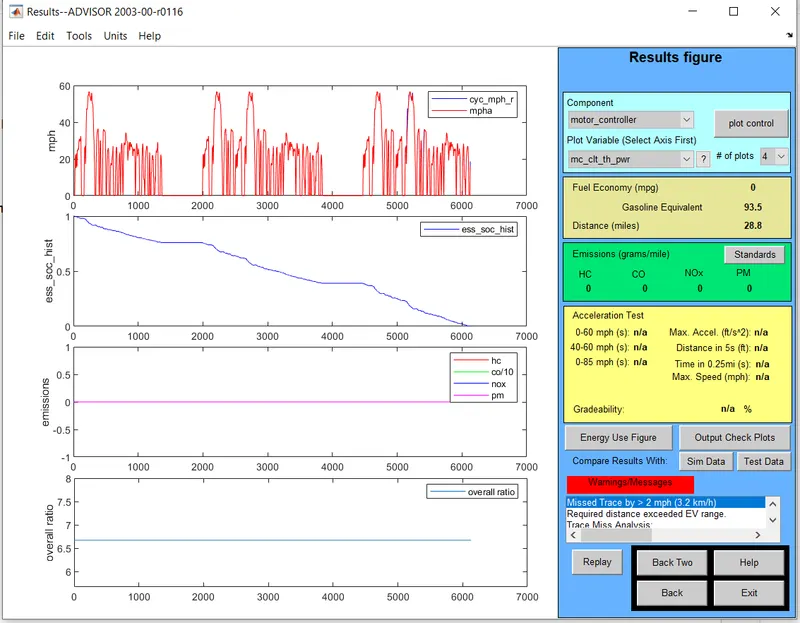
Fig: distance travelled with No. battery module 28
With No of battery module = 28 vehicle can travel distance of 28.8 miles ( 46.33km).
From above figure , it is found that 28 battery module are required to travel distance of 45 km.
3. Perform gradeability test with PRIUS_Jpn_defaults_in file.
Compare your results in table and conclude.
Gradability:
A car's gradability is its ability to climb slopes. Gradability is measured either in degrees or peroentgeA degrees gracient is equivalent to 100 percentage. Gradability is dependent on engine power, drivetrain type gear weight, weight distribution, car's centre of gravity and traction.
Select PRIUS_Jpn defaults_in file from the load file option to load the Prius model
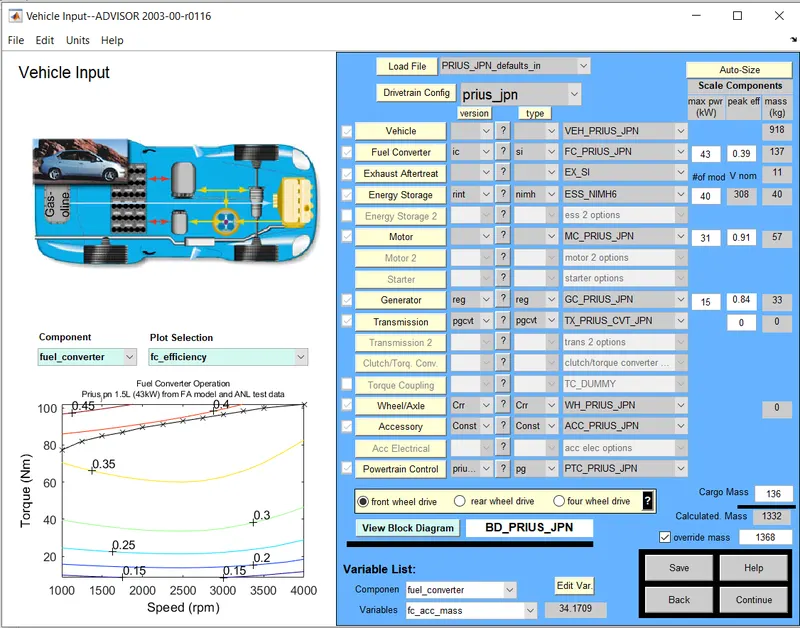
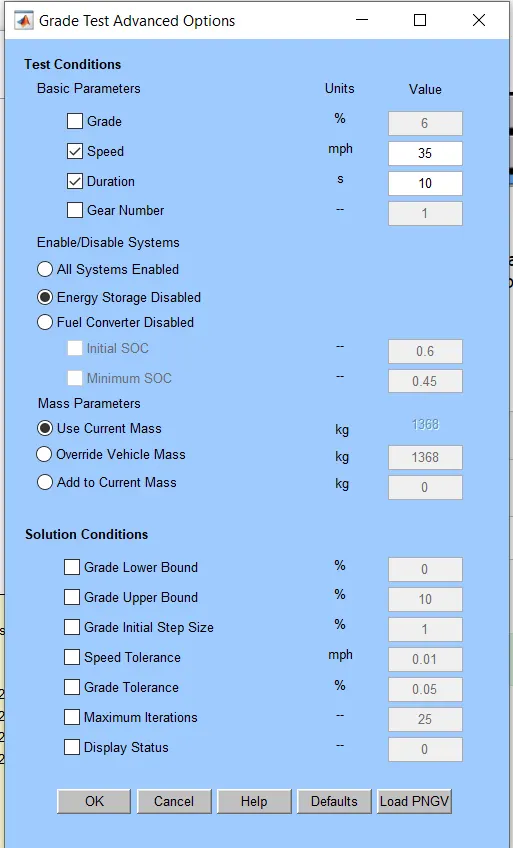
Hit continue and select the grade options to open the grade test options in this we need to change the option which will include both fuel and energy storage, hence we will select all systems to enable and in basic parameters the speed of the vehicle can be controlled
After running the model with differeent speeds we can check the gradeability percentage,we need to take the value at differentspeed and tabulate the information
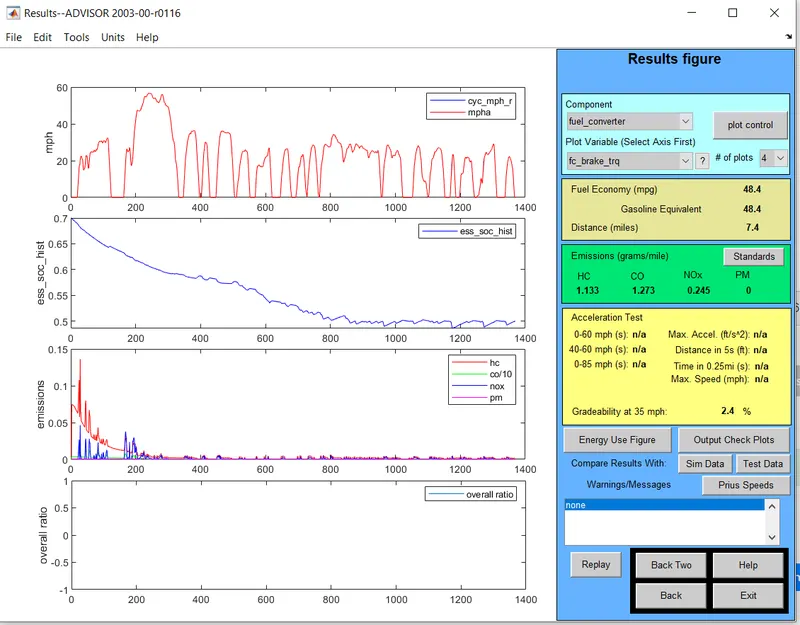
SPEED(MPH) GRADEABILITY
35 2.5
45 2.2
55 1.7
65 1.2
75 0.7
From the above table , we can see that the gradeability decreases with increse in speed the maximum gradeabilty during 5 mph and lowest during 35 mph