Week-3 Challenge: ADVISOR Tool
ADVISOR TOOL
Aim: To use advisor tool to analyze the HEV and EV characteristics
Objective: 1) For EV_defaults_in file, if cargo mass is 500 kg with all other default conditions, can the vehicle travel for 45Km with FTP drive cycle? Conclude your observations.
2) In the above case, try changing the battery capacity and repeat the simulation.
3) Perform gradeability test with PRIUS_Jpn_defaults_in file and compare your results in table and conclude.
Theory:
Advanced Vehicle Simulator (ADVISOR) was first developed in November 1994 at the National Renewable Energy Laboratory. It was designed as an analysis tool to assist The US Department of Energy (DOE) in developing technologies for hybrid electric vehicles (HEV) through the Hybrid Electric Vehicle Propulsion System contracts with Ford,General Motors, and DaimlerChrysler. Its primary role is to highlight the system-level interactions of hybrid and electric vehicle components and their impacts on the vehicle performance and fuel economy.
How to start advisor tool:
- First open MATLAB and set the dirictory path to the desired location where the advisor folder is saved.
- Now in comand window type "ADVISOR" and press enter.
- It will launch a new window, then press start.
. Advisor tool have 3 usser interface windows,
- Vechile input window
- simulation parameter window
- Result window
1) To study the EV in default condition and to analyse the battery capicity and distance coverd by it
STEPS:
- Select EV_defaults_in in load out file
- Then change the cargo mass to 500Kg
- We could observe the calculated gross mass of the vechile is changed to 1508Kg
- Now after pressing continue we hav to select the no of cycles.
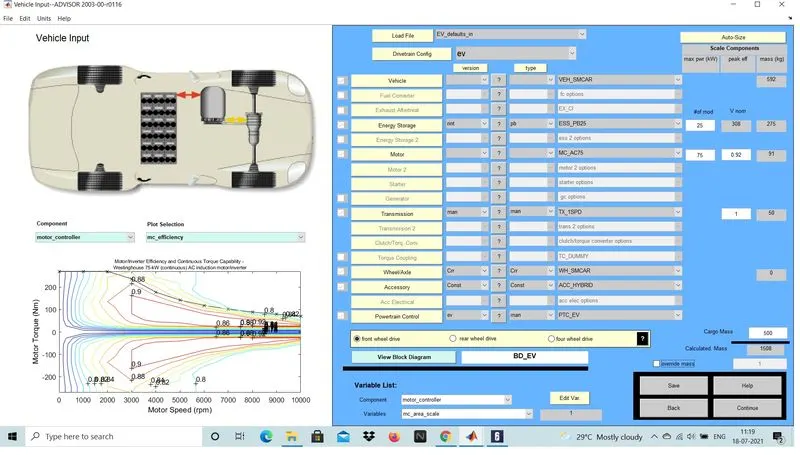
Fig 1.1: Vechile input window
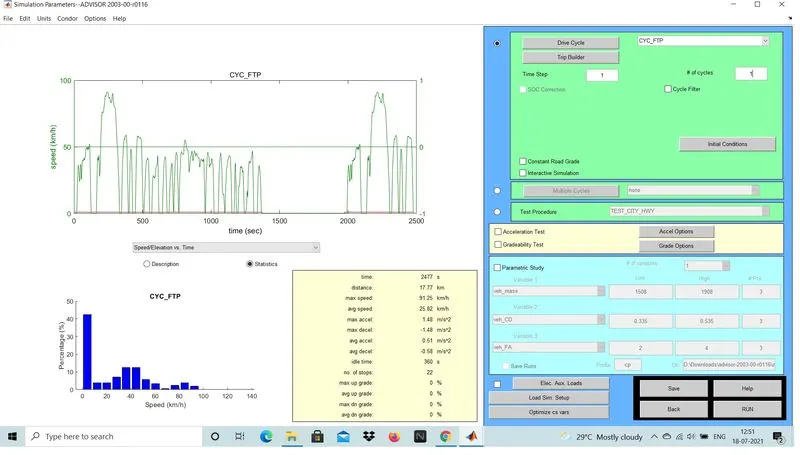
Fig 1.2:Simulation parameter window
- In 1st case we selected one cycle and calculated the result, and result is shown in fig 1.3.
- Here almost 40% of SOC has been utilized .
Results:
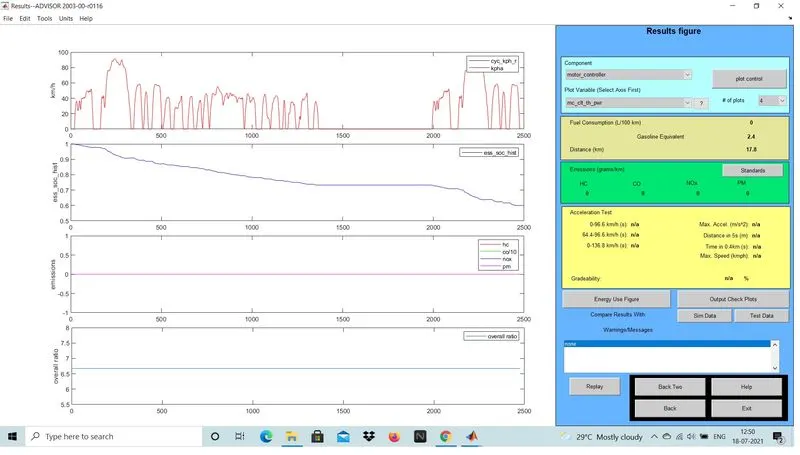
Fig 1.3: No. of cycle = 1
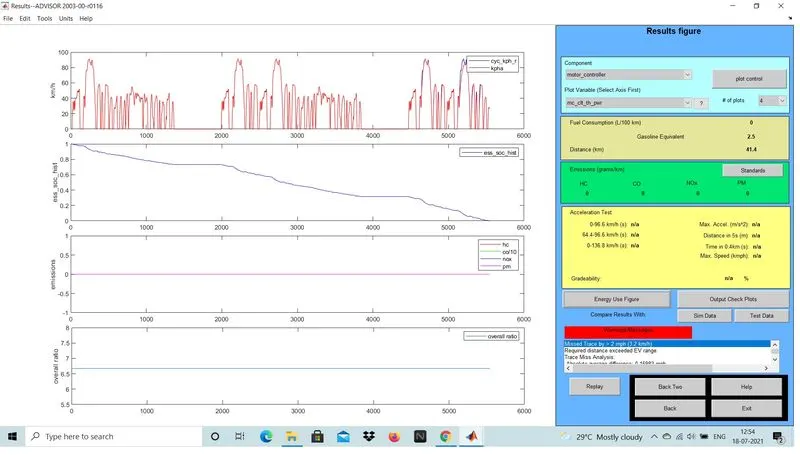
Fig 1.4: No. of drive cycles = 3
We could infer that, by only using 1 drive cycle 40% of SOC was consumed. For 2 cycle 80%. So in order to consume 100% of SOC the EV had to travel 41.4Km which is less than 45Km. The result is shown in the above fig 1.4. Thus we could conclude that by given vechile paramers the vechile could not complete 45 km.
2) Changing battery capacity in the above example
STEPS:
- In the vechile input screen there is an optin to change the number of modules of the battery shown in fig 2.1.
- The values are changed to 26, 27, 28 respectively corresponding to each driving cycles
- First the suitable driving cycle is selected.
- By taking 2 as driving cycle the max distance travelled would be 33.5Km as observed above.
- So the result is analysed using 3 as number of driving cycles.

Fig 2.1
- The value right next to '# of mod' is nominal voltage and battery weight respectively.
Result:
The varing values of distance travelled is tabulaed in the fig given below with respect to the changng values of battery capacity. Increasing the battery module will increase the SOC of the vechile hence by increaing the maximum distance covered. The result is tabulated for 26,27 and 28 values and is shown in fig 2.2, fig 2.3, fig 2.4 respectively.
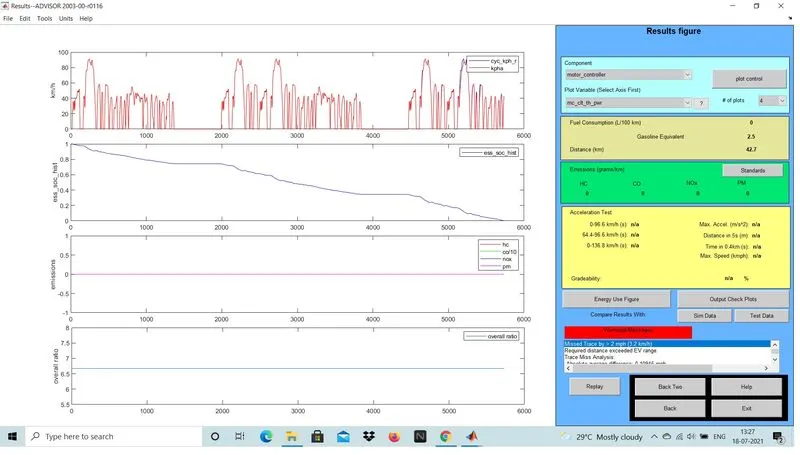
Fig 2.2: For 26 modules
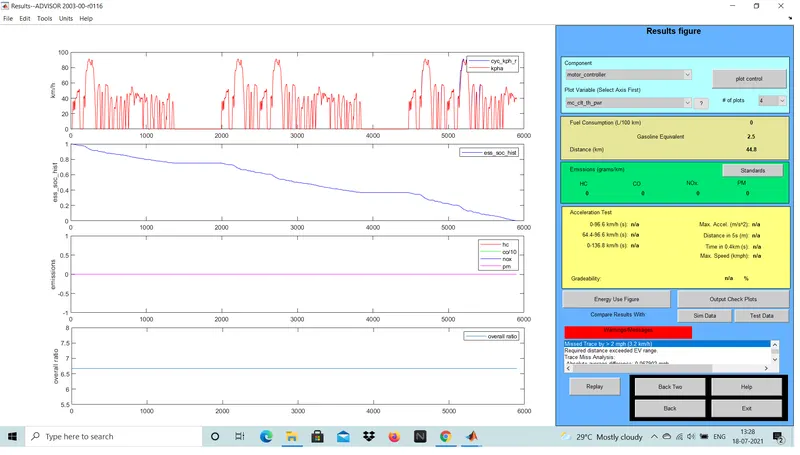
Fig 2.3: For 27 modules
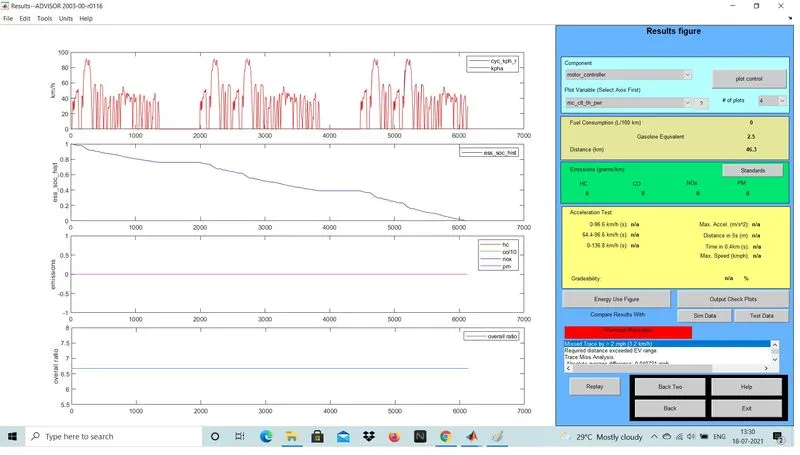
Fig 2.4: For 28 modules
| Sl No | No. of modules | Nominal voltage | Battery weight | Distance covered |
| 1 | 26 | 321 | 286 | 42.7 |
| 2 | 27 | 333 | 297 | 44.8 |
| 3 | 28 | 345 | 308 | 46.3 |
So in order to cover 45Km a 28 module 345V mattery is required
3) gradeability test with Prius using ADVISOR
Toyota Prius
The Toyota Prius is a fully hybrid automobile manufactured by Toyota since 1997. Initially offered as a 4-door sedan, it has been produced only as a 5-door liftback since 2003.
STEPS
- Open PRIUS_Jpn_defaults_in on vechile input window and press continue
- Click on grade options on the parameter window
- Now a window will pop us as shown in fig 3.2
- check the boxes as shown in the figure.
- Various Speed and duration are set and the result is calculated and tabulated
- The constant grade box is also checked.
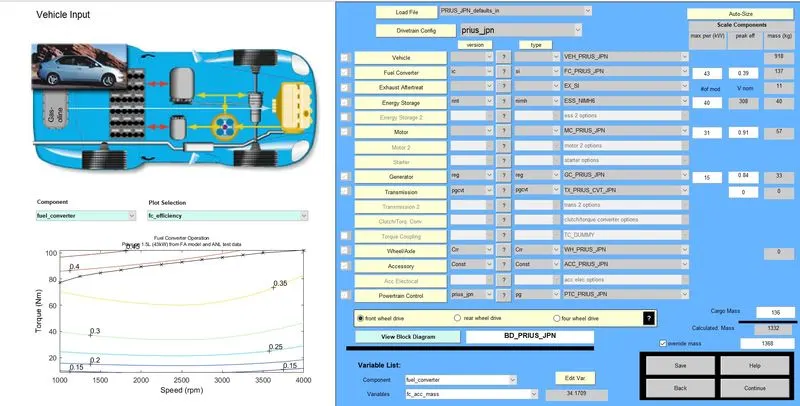
Fig 3.1: PRIUS_Jpn_defaults_in vechile input wndow
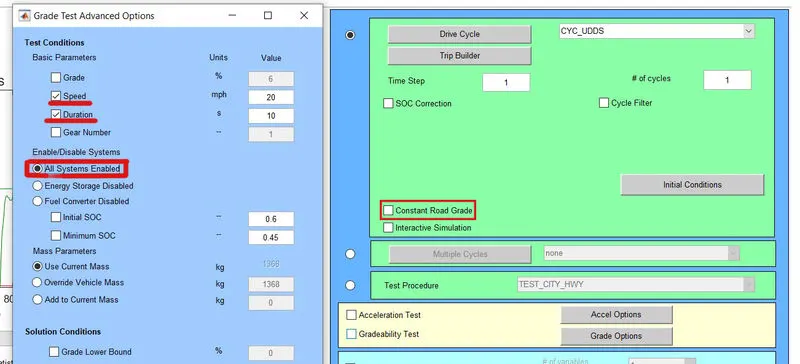
Fig 3.2: Grade option in simulation parameter window
Result:
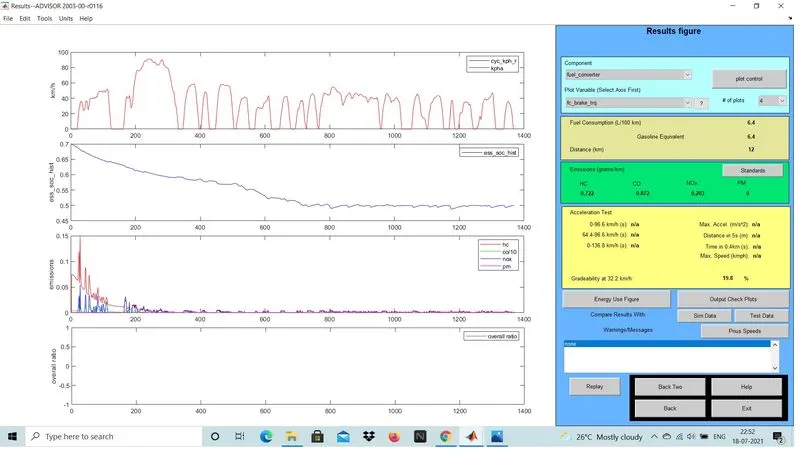
Fig 3.3: Gradeablity 19.8 for speed = 20mph
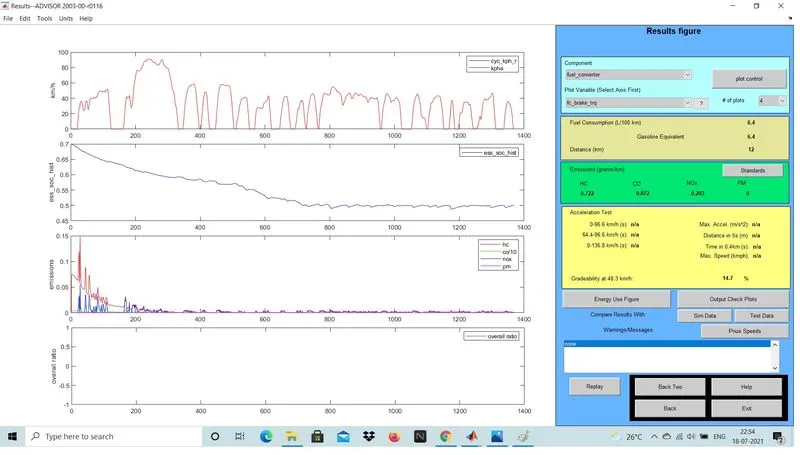
Fig 3.4: Gradeablity 14.7 for speed = 30mph
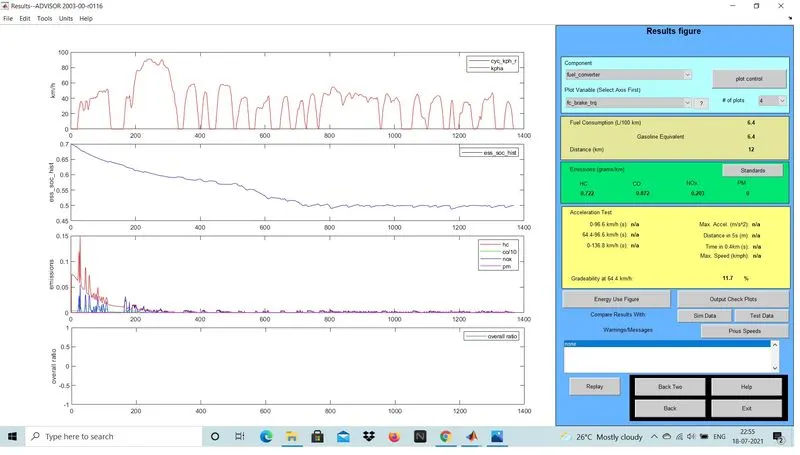
Fig 3.5: Gradeablity 11.7 for speed = 40mph
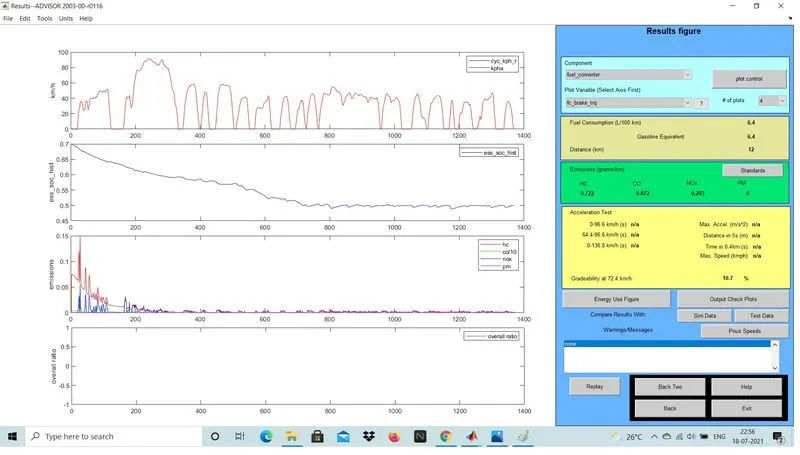
Fig 3.6: Gradeablity 10.7 for speed = 45mph
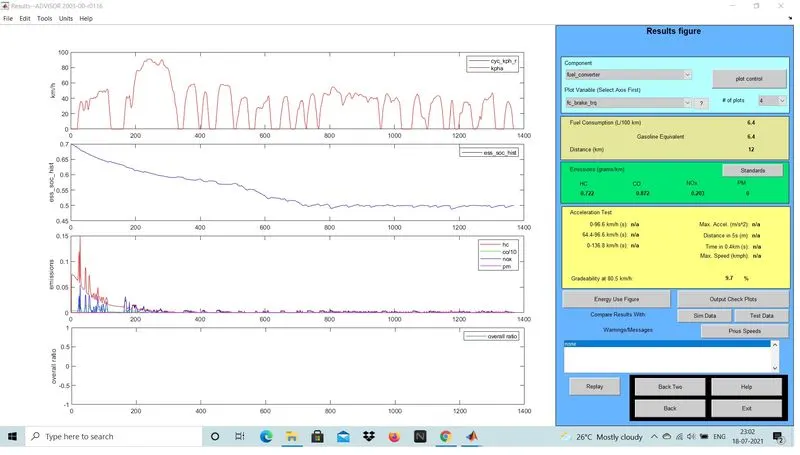
Fig 3.7: Gradeablity 9.7 for speed = 50mph
| Sl no | Duration(s) | Speed(mph) | Gradeablity(%) |
| 1 | 10 | 20 | 19.8 |
| 2 | 10 | 30 | 14.7 |
| 3 | 10 | 40 | 11.7 |
| 4 | 10 | 45 | 10.7 |
| 5 | 10 | 50 | 9.7 |
Thus from the above table we could infer that gradeablity decreses with increase in speed.
Conclusion:
All the experiments are done and the results are tabulated and is depected in above