Week 3.2 - 2R Robotic Arm Challenge
AIM: Write a program in Matlab to simulate the forward kinematics of a 2R Robotic Arm.
INTRODUCTION: A 2R Robotic-arm is a combination of two links with an end effector (Manipulator) at the end of the second link. The first link is hinged at the base while the second link is connected at the end of the first link. Link 1 is inclined to the base at an angle of `theta_1` while link 2 is at an angle of `theta_2`. If `theta_1` and `theta_2` are given we need to find the final position of the manipulator. This problem is also called forward kinematics. Now to find the final position of the manipulator we need to find out the positions of links 1 and 2.
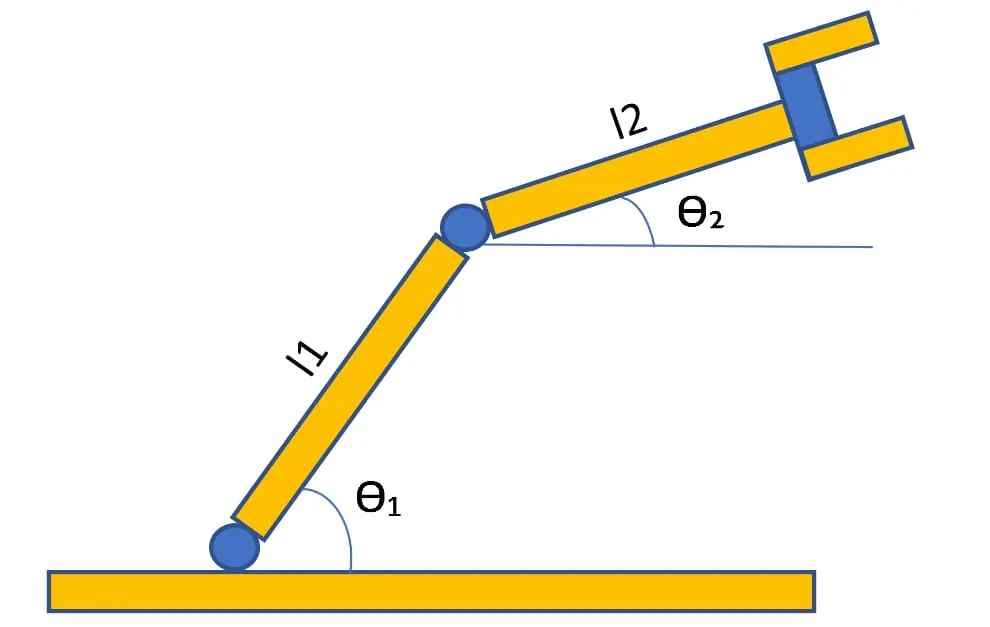
To calculate the position of the links;
Step 1: Calculate the position of link1
Starting point(0,0)
Ending point(`l_1costheta_1`,`l_1sintheta_1`)
Step 2 : Calculate the position of link2
Starting point(`l_1costheta_1` ,`l_1sintheta_1`)
Ending point(`x_1 + l_2costheta_2` ,`y_1 + l_2sintheta_2`)
Now we have the three co-ordinates
1. The starting point
2. The end point of link 1 or starting point of link 2
3.The end point of link 2
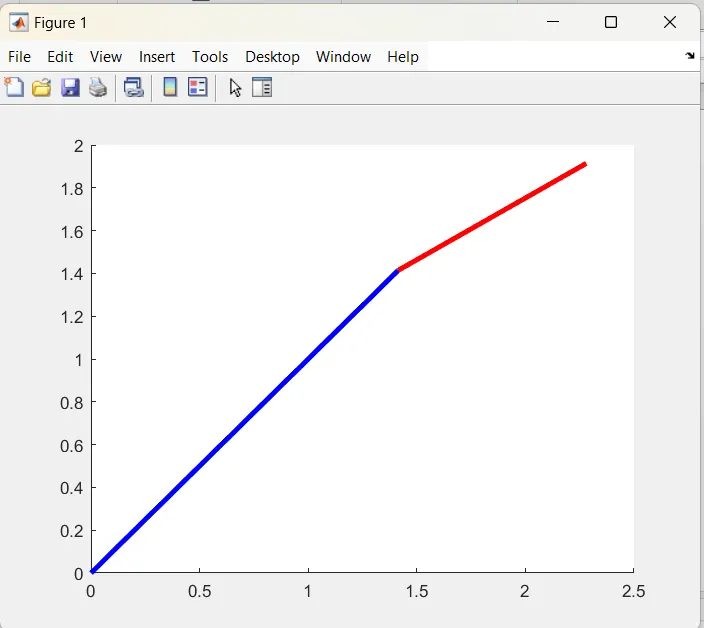
Case 1
Here `theta_1 =45`
`theta_2 = 30`
% Forward kinematics of 2R Robotic arm
clear all
close all
clc
% Inputs
l1 = 1;
l2 = 0.5;
theta1 = 45;
theta2 = 30;
% Coordinate
x0 = 0;
y0 = 0;
x1 = l1*cosd(theta1);
y1 = l1*sind(theta1);
x2 = x1 + l2*cosd(theta2);
y2 = y1 + l2*sind(theta2);
% Plotting
line([x0 x1],[y0 y1],'lineWidth',3,'color','b');
line([x1 x2],[y1 y2],'lineWidth',3,'color','g');
In the above plot, we can see the position of links 1 and 2 when theta values are given. This plot is a static plot. Here we have to manually change the values of `theta_1 and theta_2` to know the position of the manipulator. What if we don't want to manually do this. We can give a range of values of `theta` using 'linspace' command as shown below. The plot of the same is attached below.
% Forward kinematics of 2R Robotic arm
clear all
close all
clc
% Inputs
l1 = 1;
l2 = 0.5;
theta1 = linspace(0,90,10);
theta2 = linspace(0,90,10);
for i = 1:length(theta1)
THETA1 = theta1(i);
for j = 1:length(theta2)
THETA2 = theta2(j);
x0 = 0;
y0 = 0;
x1 = l1*cosd(THETA1);
y1 = l1*sind(THETA1);
x2 = x1 + l2*cosd(THETA2);
y2 = y1 + l2*sind(THETA2);
% Plotting
line([x0 x1],[y0 y1],'lineWidth',3,'color','b');
line([x1 x2],[y1 y2],'lineWidth',3,'color','g');
end
end
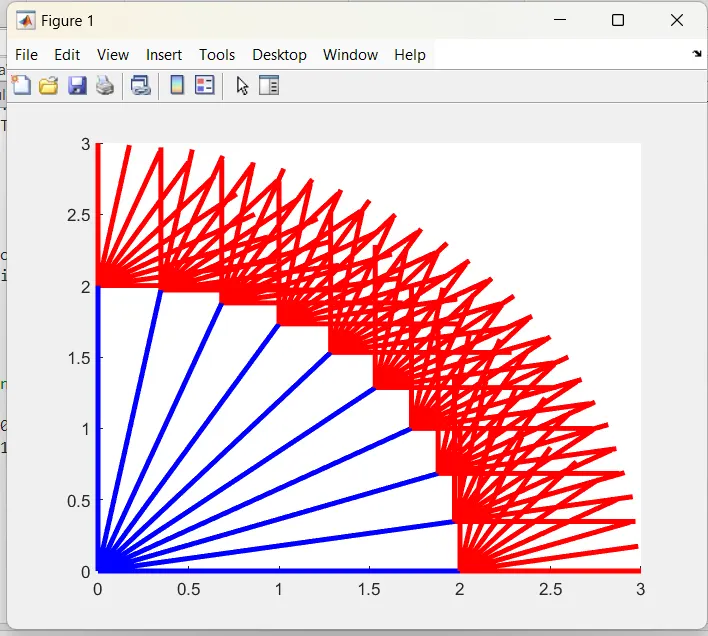
The above plots are static, suppose we want a dynamic plot that showcases the position of the links at different values of `theta`.
clear all
close all
clc
% Inputs
l1 = 1;
l2 = 0.5;
theta1 = linspace(0,90,10);
theta2 = linspace(0,90,10);
ct = 1
for i = 1:length(theta1)
THETA1 = theta1(i);
for j = 1:length(theta2)
THETA2 = theta2(j);
x0 = 0;
y0 = 0;
x1 = l1*cosd(THETA1);
y1= l1*sind(THETA1);
x2 = x1 + l2*cosd(THETA2);
y2 = y1 + l2*sind(THETA2);
%Plotting
plot([x0 x1],[y0 y1],[x1 x2],[y1 y2],'linewidth',3);
axis([-0.1 1.5 0 1.5])
pause(0.03)
M(ct) = getframe(gcf);
ct = ct + 1;
end
end
movie(M)
videofile = VideoWriter('robotic_arm.avi','uncompressed AVI');
open(videofile)
writeVideo(videofile,M)
close(videofile)
The above plot gives us the animation of both the links at different positions of theta. In order to create a movie, the movie command was used. To assign the video format the videoWriter command was used.Open command was used to open the video file while writevideo command was used to write the video and finally close the video with close command.
ERRORS FACED:
The only error I faced was while writing the program I used capital M for movie command. Matlab is case-sensitive and threw an error.
YOUTUBE VIDEO LINK
https://youtu.be/EKdzD3zLNWM?si=UIdAbhrb4H5vLSjZ
https://youtu.be/EKdzD3zLNWM?si=UIdAbhrb4H5vLSjZ