Week 2 Railwheel and Track
1 PROBLEM STATEMENT
Perform static structural analysis on Rail wheel and Track setup by varying bearing load from 100KN to 500KN. Compare Total Deformation, Equivalent stress and the life under both the loads. Also create user defined result to calculate Total Deformation & validate with the inbuilt ANSYS result.
2 OBJECTIVE
The aim of the study is to determine the effect of bearing pressure on wheel & track life cycle , identifying the critical section from stress & strain point of view.
3 GEOMETRY & MATTERIAL
3.1 GEOMETRY
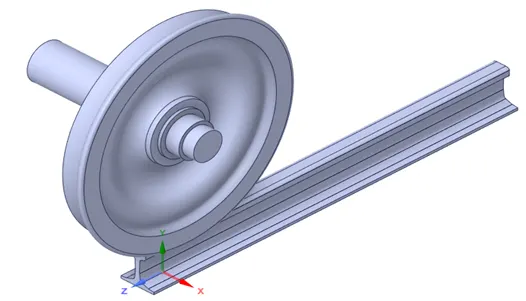
The cad model used for simulation has been shown below. It consists of mainly 3 components. They are wheel, track, & shaft.
3.2 MATTERIAL
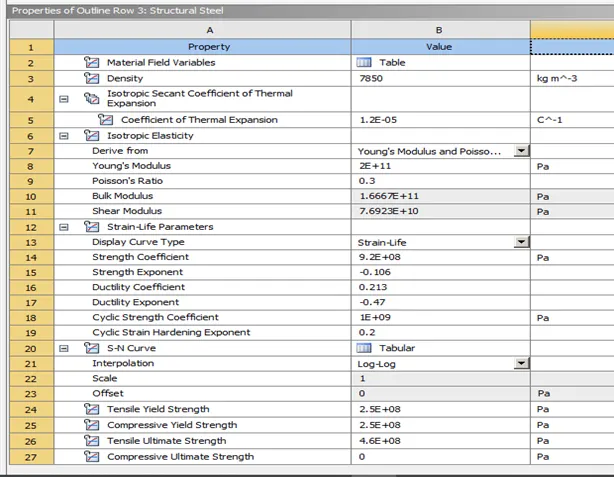
Structural steel has been chosen as a material for above cad model. Properties of structural steel has been mentioned below in figure.
|
PARAMETERS |
MAGNITUDE |
UNIT |
|
Density |
7850 |
Kg/m^3 |
|
Poisson’s ratio |
0.3 |
- |
|
Tensile yield strength |
2.5E+05 |
MPa |
|
Compressive yield strength |
2.5E+05 |
MPa |
|
Tensile ultimate strength |
4.6E+05 |
MPa |
4 MESHING
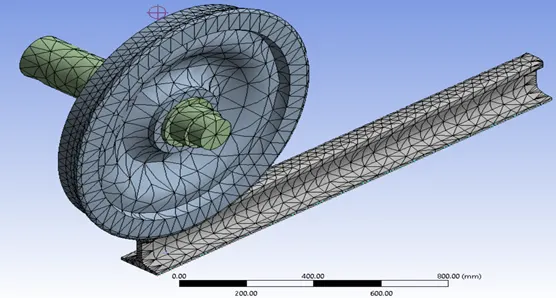
The overall element size is 50mm & refined meshing has been done near contacts. Element size near contact was 35mm & at remaining places is 50 mm by default meshing size. It resulted in 13304 nodes & 6726 elements overall which is within academic limit size.
5 CONNECTIONS & JOINTS
5.1 CONNECTIONS
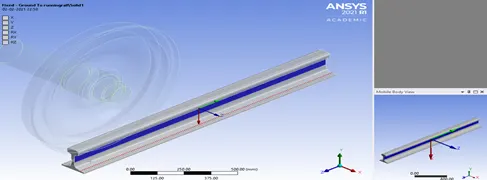
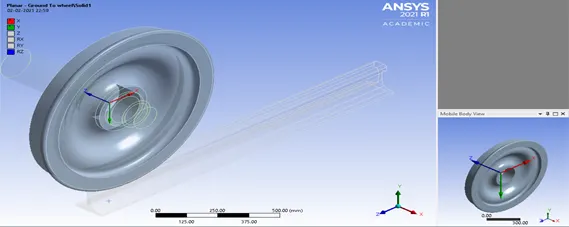
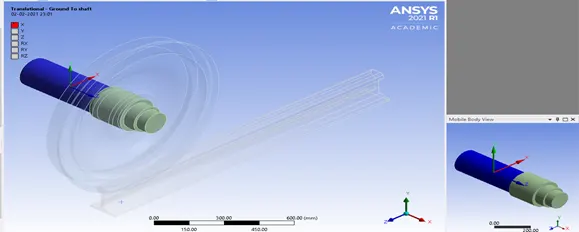
It is very important to identify correct connection type & location within model otherwise simulation will not take place. We can see very clearly that there are 2 different connection types. The first one is between Rail wheel & Track pair. This connection pair is of frictional type. The value of friction coefficient is 0.3. The second connection exist between Rail wheel & shaft Pair & this connection type is frictionless in order to support revolution at very high speed. Both are of body ground type connection.
Frictionless contact type allows separation and sliding & value of frictional coefficient is 0. Weak spring in frictionless contact type allows convergence to occur easily.
Frictional contact type takes a non-negative value as the frictional coefficient. It is capable of handling shear stresses up to specified value & after that sliding will take place.
5.2 JOINTS
5.2.1 FIXED
5.2.2 PLANAR
5.2.2 TRANSLATIONAL
6 BOUNDARY CONDITIONS
6.1 BEARING PRESSURE
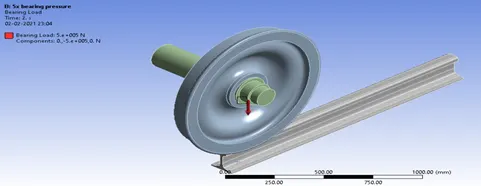
Bearing load was applied at centre of wheel as shown below (5e+005 N) & (1e+005 N). The result has been compared for both cases
6.2 JOINT DISPLACEMENT
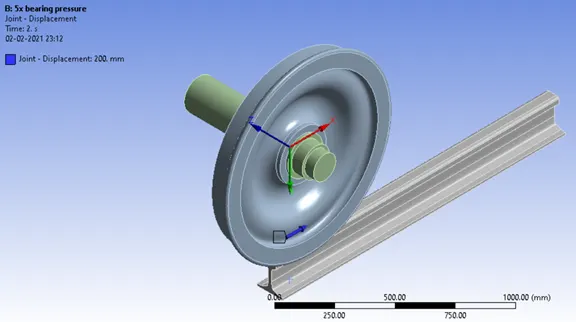
There are total of 3 different joints out of them one is fixed with ground. Remaining two pair are dependent on each other. The wheel will rotate & shaft will translate. These motions can be seen in following figure clearly.
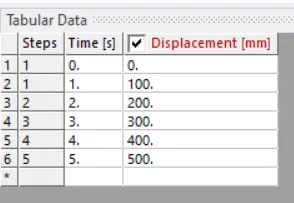
Displacement load has been given in step of 100mm to shaft as shown in following figure.
6.3 ANALYSIS SETTING
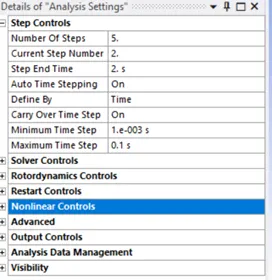
Simulation has been performed in 5 step. Automatic time step was on for step 2 to step 5 with carry over step time on. The minimum time was step was 1e-003 second & maximum was 0.1 second.
7 RESULT & DISSCUSSION
7.1 DEFORMATION
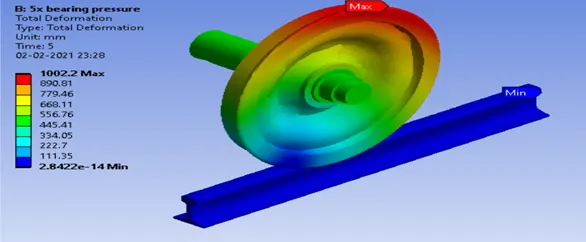
7.1.1 TOTAL DEFORMATION AT 5e+005 N BEARING PRESSURE
The maximum displacement was 1002.2mm
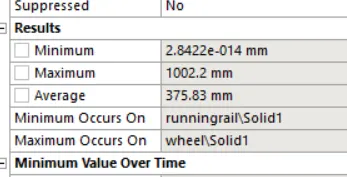
Following figure shows the deformation on setup. The maximum deformation is on wheel & the minimum occur at track at farthest from the wheel. Both points have been shown with red & blue tag respectively.
7.1.2 TOTAL DEFORMATION AT 1e+005 N BEARING PRESSURE
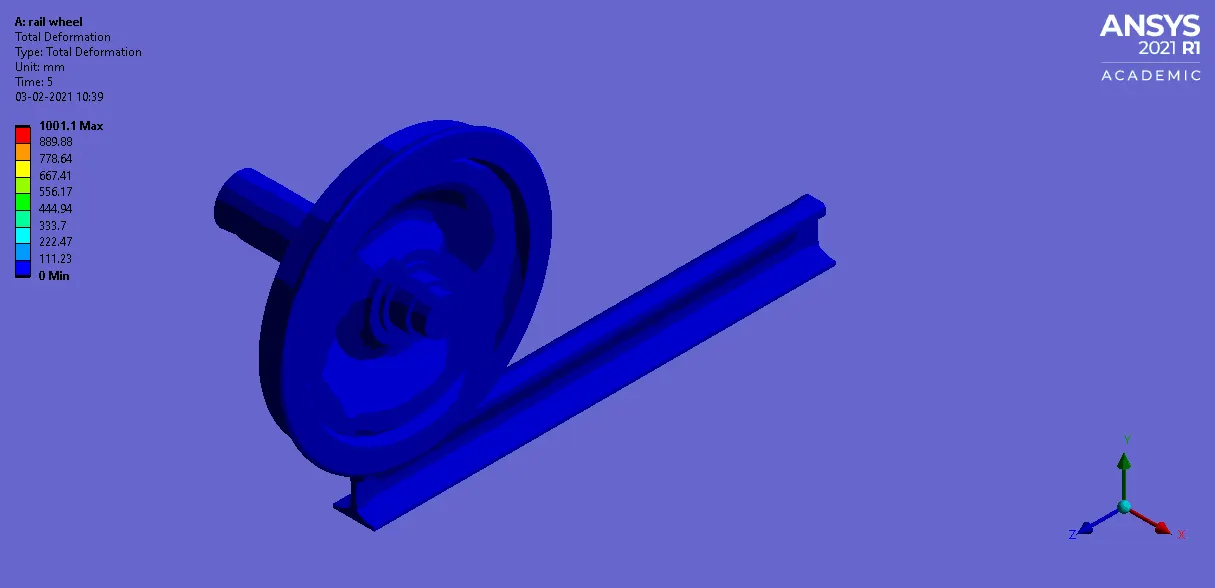
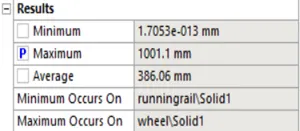
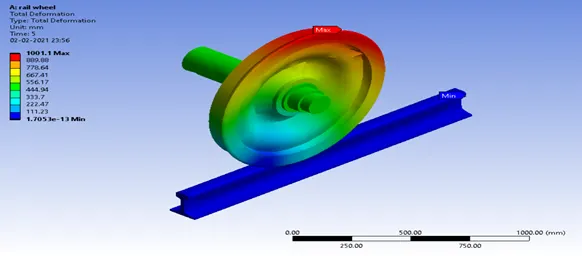
The maximum displacement was 1001.1mm
Following figure shows the deformation on setup. The maximum deformation is on wheel & the minimum occur at track at farthest from the wheel. Both points have been shown with red & blue tag respectively.
7.3 VON MISES STRESS
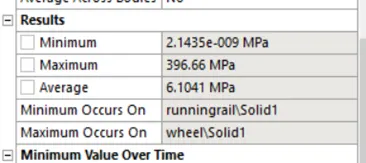
7.3.1 STRESS AT 5e+005 N BEARING PRESSURE
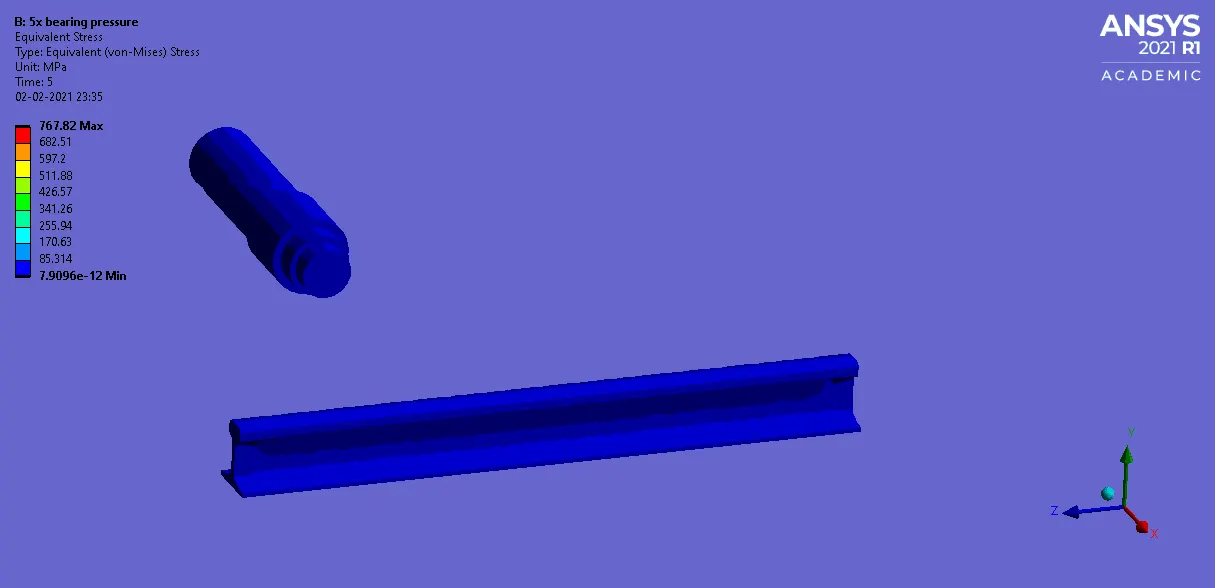
We can see that the maximum stress occur at point of contact & it keeps changing as the wheel translate forward. The value of maximum stress is 396.66 MPa.
7.3.2 STRESS AT 1e+005 N BEARING PRESSURE
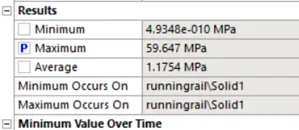
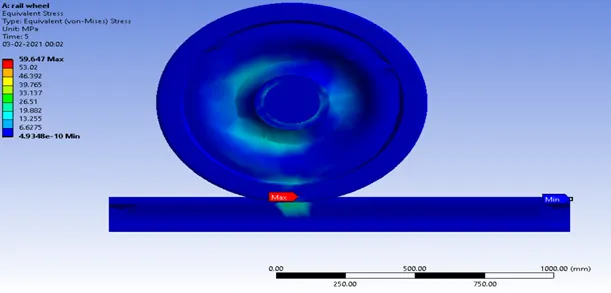
We can see that the maximum stress occur at point of contact & it keeps changing as the wheel translate forward. The value of maximum stress is 59.647 MPa.
7.4 FATIGUE LIFE
7.4.1 LIFE CYCLE AT 5e+005 N BEARING PRESSURE
The minimum life cycle at a load of 5e+005N is 2775.2 cycles
7.4.2 LIFE CYCLE AT 1e+005 N BEARING PRESSURE
The minimum life cycle at a load of 1e+005N is 1.e+006 cycles
7.5 USER DEFINED DEFORMATIO
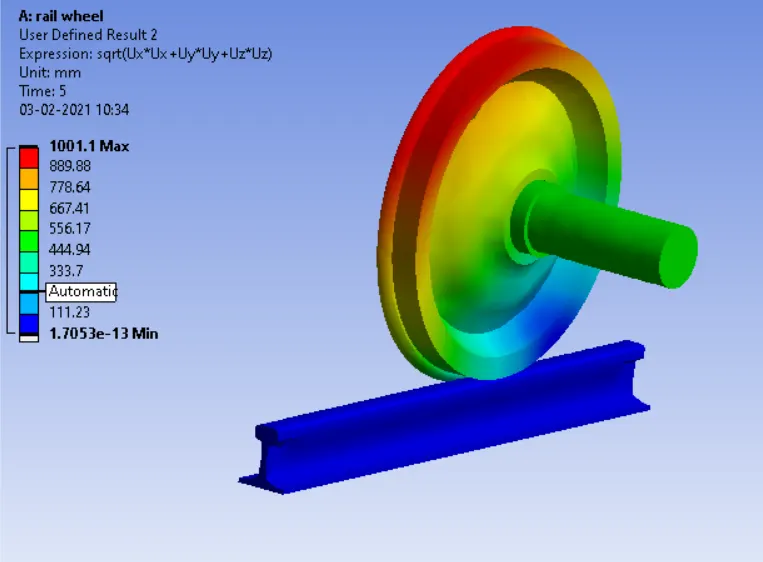
7.5.1 DEFORMATION AT 1e+005 N BEARING PRESSURE
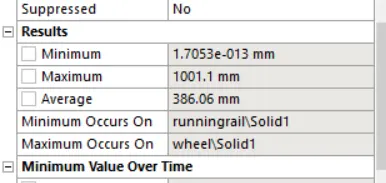
We can observe that maximum deformation is 1001.1 mm which is equal to inbuilt result at 1e+005 N
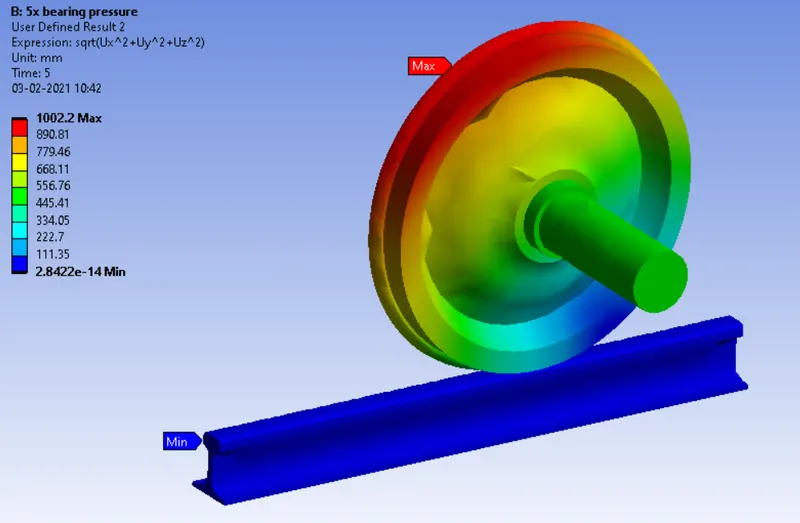
7.5.2 AT 5e+005 N BEARING PRESSURE
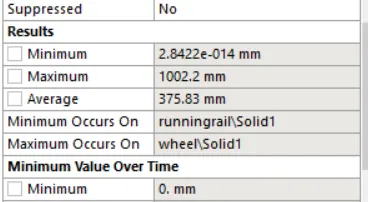
We can observe that maximum deformation is 1002.2 mm which is equal to inbuilt result at 1e+005 N
8 CONCLUSION
8.1 TABLE OF ALL RESULT
|
Bearing Pressure in N |
DEFORMATION in mm |
VON MISES STRESS in MPa |
FATIGUE LIFE in CYCLES |
USER DEFINED DEFORMATION in mm |
| 1e+005 | 1001.1 | 59.64 | 1.e+006 | 1001.1 |
| 5e+005 | 1002.2 | 396.66 | 2775.2 | 1002.2 |
8.2 CONCLUSION REMARKS
- LIFE CYCLE DECREASES WRT INCREASE IN BEARING PRESSURE
- STRESS & TOTAL DEFORMATION INCREASES WRT INCREASE IN BEARING PRESSURE
- THE RESULT OBTAINED USING USER DEFINED RESULT & INBUILT ANSYS FUNCTION ARE EXACTLY SAME IN BOTH CASES