Week 2 - Flow over a Cylinder.
AIM:
Simulate the flow over a cylinder and explain the phenomenon of Karman vortex street.
PART-I
- Simulate the flow with the steady and unsteady case and calculate the Strouhal Number for Re= 100.
PART-II
- Calculate the coefficient of drag and lift over a cylinder by setting the Reynolds number to 10,100,1000,10000 & 100000. (Run with steady solver)
- Discuss the effect of Reynolds number on the coefficient of drag. [ Results should be validated with any standard literature and error should be within 5 %]
Expected results:-
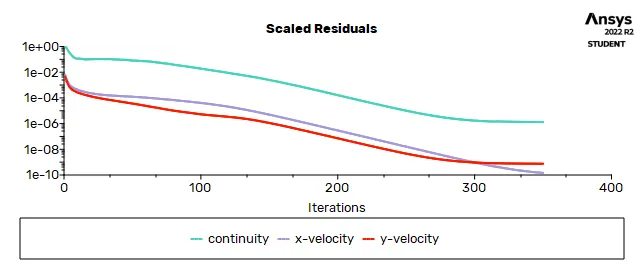
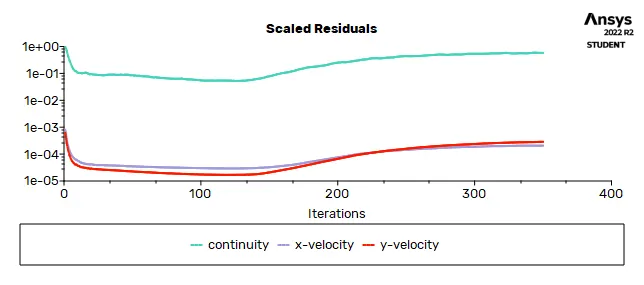
- In both approaches, show that the flow has converged. That is, what quantities or plots need to be looked at to determine that the flow has converged?
- Plots of the coefficient of drag and lift.
- Plots to show vortex shedding behind the cylinder and also Mention the referred material.
INTRODUCTION AND THEORY:
In the simulation of the flow over a cylinder ,some simulations and perform are perfomed. they are:
perform of 2d simulations,renolyds number is chnaged by customizing the fluid,and perform the Run time animations,vortex shedding.
in the post processing some addition of the monitor points,animation files, numerical diffusion,and some of the steady state VS tansient analysis is done.
PROCEDURE:
Open ansys workbench and drag and open fluid flow(fluent) and make it standalone system.
name it as the flow over a cylinder.now the double click the geometry and space claim is opened.
GEOMETRY:
now the space claim units are changed into meters.
Change the space claim sheet in Y-axis and draw a circle wwitha diameter of 2 meter.
And construct a inlet on the left side of the circle . the distance is (10*dia).so (10*2=20m from the centre of the circle).
now the outlet is on right side and that distance is (20*2=40 meter from the circle's centre)
now the inlet has increased the both side as 10m.
hence finally, the rectangle is created with a dimensions of 60*20.
finally 2d geometry is created.convert this geometry into the surface by using pull tool.
now by using select the cylinder is selected and delete of unwanted surface and lines are selected.
MESHING :
Comeback to the ansys workbench after completeing the geometry and after update it.
now double click on the meshing ,that is open.
in order to get the fine and triangular mesh ,mesh-insert-method.
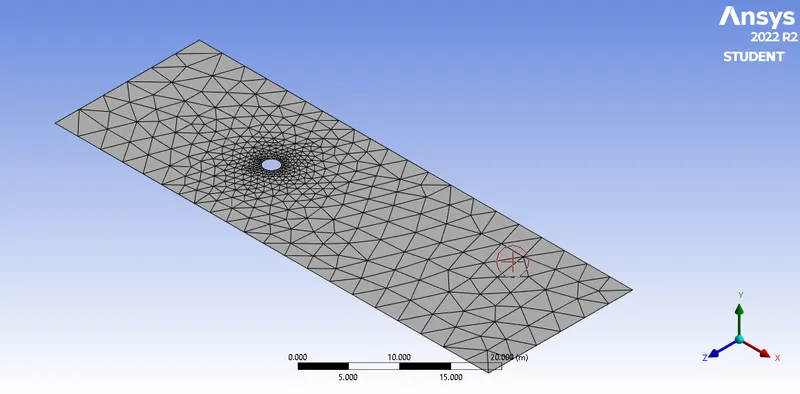
in that automatic method-geometry-body is selected by using face selection.after all this selection click applied.
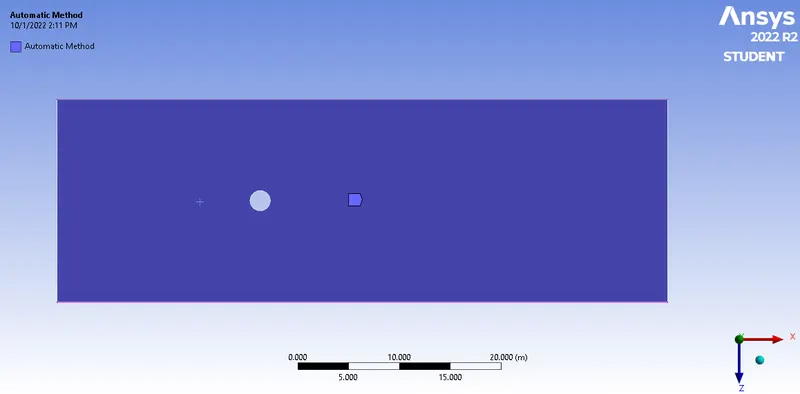
change the method as triangle method and change as the mesh length as 2mm.
the fine boundary of the cylinder(circle) is set by using sizing element which is present in the mesh-insert.
in that sizing the edge selection and inner circle is selected and give as 36 segment.
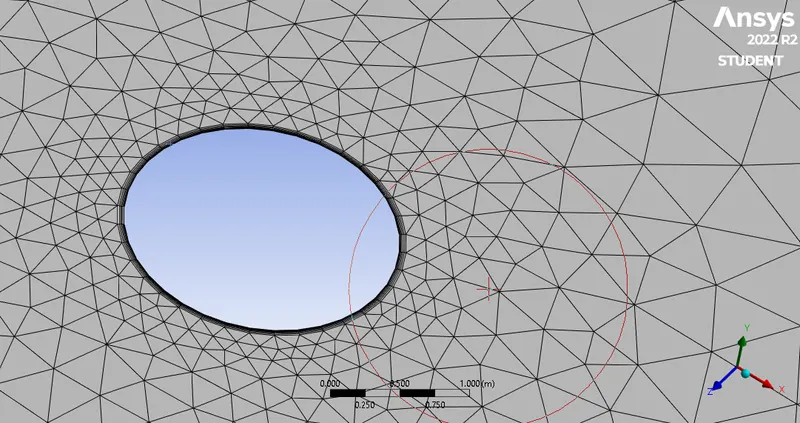
in order to fine simulation near the circle of the cylinder use inflation which is mesh-insert-inflation-set as six layers-one layers mesh.
hence the final meshed surface is:
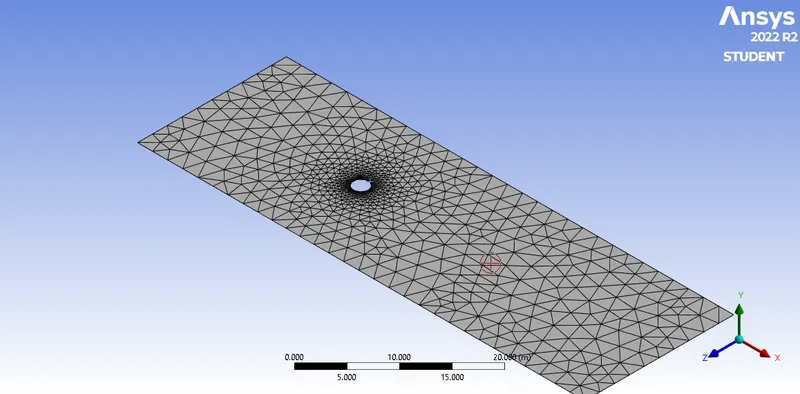
by selecting all these info now put the generate mesh is created.
and also pick all the edges by using the edge selection ans set as inlet, outlet,cylinder wall as wall, and the sides are symmetric.
SETUP:
After updating the mesh in the ansys workbench, now the setup is opened and the model is subjected into steady state, viscous- laminar
In material section apply the the fluid as user material(air) and change that as well as in the cell zones.
boundries are assigned :
for inlet-velocity as 1m/s.
the cylinder wall as shear slip boundaries.
outlet -gauge pressure as zero bar.
in the results deck the monitor point as created by the help of surface-create-point, name that point as monitor point.
in solution deck the new definitions report are created for MONITOR-POINT-VELOCITY.that velocity is calculate at the monitor point.
by repeating the same procedure again the MONITOR POINT PRESSURE report is generated.
in order to get the contour plot for that monitor point use the graphics-contour plots,this is available after only the initilization process.
in that contour plots the velocity and pressure contour plots are created.
now the solution is claculated by the help of run calculate with 350 iterations.
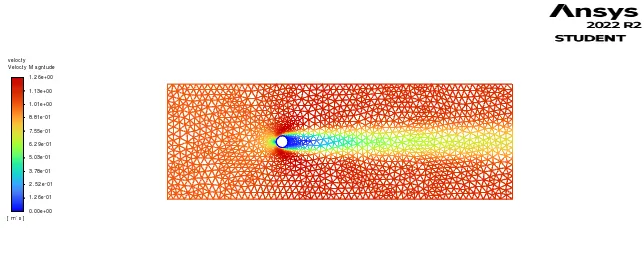
the contour velocity plots of the flow over a cylinder:
the resuidual graphs of the flow over a cylonder:
the monitor point velocity of flow over a cylinder:
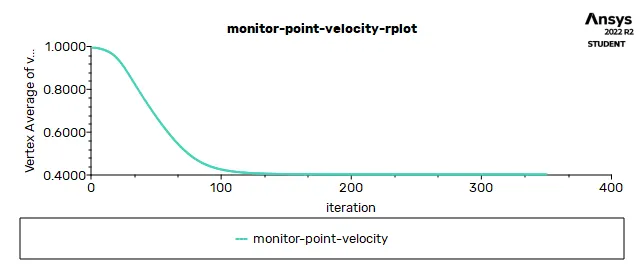
this is the result of the simulation of the flow over the cylinder and steady state case and the laminar simulation.
UNSTEADY FLOW:
in order to get or explore the vortex shedding there are some changes are done in the simulation of flow over the cylinder.
to analysis the vortex shedding the animation of the velocity movement over the monitor point and cylinder is requried.
so the animation is created with the help of the activities-solution animations-velocity animation. this reading is take after 10 iterations
.
after this changes are done then start the intialization and calculate upto 350 iterations.
it results the not that vortex shedding as expected ,so fine resolution of the mesh is created.
go back to the ansys workbench-meshing
and change the mesh length as 0.25 m and generate the mesh again.and the viscosity is changed as 0.02.
then come back to the ansys workbench and update the project.then again open the fluent ,then start initialization and calculate upto 350 iterations.
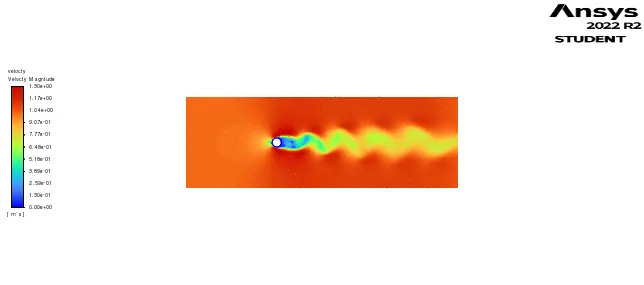
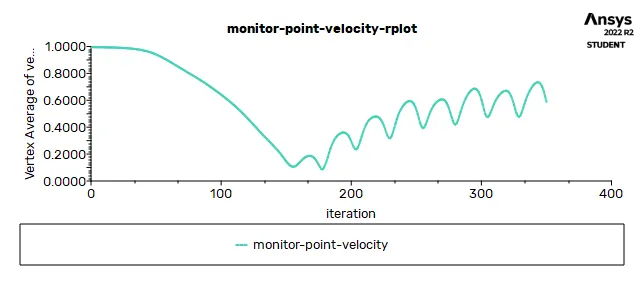
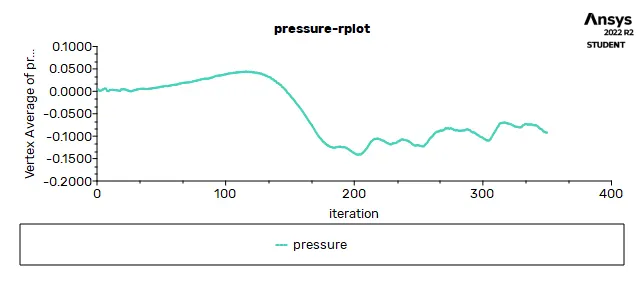
now the vortex are created as expected and the analysis is studied .
the contour velocity plots of the flow over a cylinder:
the resuidual graphs of the flow over a cylonder:
the monitor point velocity of flow over a cylinder:
the monitor point pressure of flow over a cylinder:
RESULTS:
The simulation of theflow over a cylinder is carried out succesfully.
the karman vortex shedding is the disturbance or vortex or turbulance in the flow of fluid over a object (here cylinder).
this vortex shedding is happens because of the some main reasons ,there are :
1.viscosity of the fluid
2.high reynolds number
3.velocity of the flow at inlet.
and so on.
the steady state and unsteady state case are both analysed for the reynolds number of 100.
in the steady state flow ,the flow is converged for the 350 iteration and give the graph the steady and constant solution of flow.
the coefficent of lift is high and coefficient of drag is low when the reylonds number is low and the laminar flow.
the reynolds number is directly proportional to the coefficient of thr drag.
the reynolds number is inversely proportional to the coefficient of the lift.
so the as reynolds number increase 100,1000,10000,100000 the co efficient becomes very low. because of creation of high drag.
the reason of the drag increases when reynolds number increase because of the vortex shedding occurs.
the distrubance of flow is cause the drag which opposes the forward motion of the object.
the referred material for this challange is the link which is provided in the challange page.
the refered link:https://www.sciencedirect.com/science/article/pii/S0307904X08000243
and also the I reffered the videos which is available in the skill lync ansys module page.